MM Science Journal | www.mmscience.eu ISSN 1803-1269 (Print) | ISSN 1805-0476 (Online)
Special Issue | HSM 2021
16th International Conference on High Speed Machining October 26-27, 2021, Darmstadt, Germany DOI: 10.17973/MMSJ.2021_11_2021162
MM Science Journal | 2021 | NOVEMBER - Special Issue on HSM2021
HSM2021-2021162
CHATTER DETECTION BASED ON A CONTACT SENSOR IN MILLING OPERATIONS
D. Hajdu1*, D. Bachrathy2
1MTA-BME Lendulet Machine Tool Vibration Research Group, H-1111 Budapest, Hungary
2Department of Applied Mechanics, Budapest University of Technology and Economics, H-1111 Budapest, Hungary
*Corresponding author; e-mail: hajdu@mm.bme.hu
Abstract
Chatter vibrations during machining operations are large-amplitude self-excited vibrations, which result in the loss of physical contact between the workpiece and the tool. This paper presents an electric contact sensor, which is used to detect the cutting and noncutting periods during the operation. The spectrum of the signal of the electric contact sensor is free from environmental noise and can be used to select the chatter frequencies as the boundary of stability is approached. The detection is automatic with the use of an analog phototransistor that helps the time-periodic sectioning of the measured signals. The presented approach makes chatter detection possible before harmful vibrations arise.
Keywords:
Milling; Contact sensor; Chatter detection
1 INTRODUCTION
Productivity of machining operations depends on the spindle speed, feed rate, and axial/radial immersions.
Tuning of these machining parameters, however, does not necessarily provide better cutting conditions, since large- amplitude vibrations can occur in various forms. One type of these vibrations is called the forced vibration, which is generated by the periodicity of cutting force variation and increase close to the resonant spindle speeds [Bachrathy 2009]. The other type of vibrations is called chatter, which is a self-excited unstable vibration explained by the regeneration of the machined surface.
According to the regenerative effect, the relative motion between the tool and the workpiece modifies the geometry of the uncut chip thickness, and the variation in the cutting force is described by a delay-differential equation. When the system loses stability, large-amplitude vibrations occur (even in case of negligible forced vibrations). Chatter spoils the surface quality, results in extensive noise, and increases the wear of the cutter edges. Detection and avoidance are therefore highly important tasks in machining [Munoa 2016].
The stability properties of the machining operations are visualized on stability lobe diagrams (SLDs), which typically plot the stable depth of cuts versus the spindle speeds. The regenerative delay depends strongly on the spindle speed, and by tuning the speed, the amplitude of vibrations can be moderated, and better surface quality can be achieved.
Preparation of these diagrams, however, need dynamical measurements and cutting force characterizations prior to
the real machining process, which can be time-consuming and may need expertise and special sensors. The reliability of predictions is also often not high enough to convince the machinists to invest time into chatter prediction methods.
Reliability and robustness are key issues in the applications of SLDs [Hajdu 2020]. Therefore, there is a high potential in chatter detection methods, which predict the occurrence of unstable vibrations as soon as they evolve. By monitoring the signs of chatter, the machinists can either tune manually the technological parameters until chatter is suppressed, or rely on automatic (active) vibration dampers that are built into the machine, which replaces the human intervention.
However, identification of chatter (especially in real-time) is challenging, and even experienced machinists cannot always identify chatter unambiguously. Especially in case of milling thin-walled workpieces with small radial immersion or micro machining processes, the vibrations are often not strong enough to make the detection an easy task.
Accelerometers, microphones, dynamometers are typical devices used to record vibration signals during the cutting operations. In order to monitor the occurrence of chatter, these signals must be filtered and analyzed during the tests.
The spectra of the signals often show the chatter frequencies, which are clear signs of the unstable vibrations, but it is sometimes not recognized due to noise and measurement difficulties. It is a hard task even for experienced machinists to select the real signs and ignore the irrelevant noise.
In this paper, we present an electric contact-based device for cutting detection and an analog phototransistor for accurate spindle speed measurements. The contact sensor
MM Science Journal | 2021 | NOVEMBER - Special Issue on HSM2021 is free form environmental noise and it is based on the
physical contact between the tool and the workpiece only.
The phototransistor provides a reliable and efficient way to determine the actual spindle speed with high precision, and helps to decompose the measured signals into periodic and aperiodic components. In practice it is important to identify the spindle speeds accurately, e.g., in case of the cutting force characteristic measurements or in the case of the analysis of resonant vibrations. In these situations, a ~0.1%
change in the nominal spindle speed can lead to error in the analysis, due to the cumulative error of the tool angle detection.
The structure of the paper is as follows. Section 2 presents the dynamical model of milling operations and summarizes the basic properties of time-periodic systems, which is utilized in the subsequent sections. Section 3 presents the devices used for chatter detection and Section 4 presents an experimental case study. The summary is given in Section 5.
2 DYNAMICAL MODEL OF MILLING
In this section, we present the dynamical model of milling operations for tools, which have unequal pitch between the subsequent cutting edges. These types of tools are designed to disturb the regenerative delay and increase the maximum stable depth of cuts [Stepan 2018]. The general model of a milling operation is presented in Fig. 1, where 𝑎 is the axial depth of cut, 𝑛 (rpm) is the spindle speed of the tool, 𝑎e is the radial depth of cut, 𝛽 is the constant helix angle, and 𝐷 is the diameter of the tool. The corresponding mathematical model is described by the governing equation 𝐪̈(𝑡) + [2𝜁𝑘𝜔n,𝑘]𝐪̇(𝑡) + [𝜔n,𝑘2 ]𝐪(𝑡) = 𝐔T𝐅(𝑡, 𝐪, 𝐪𝜏𝑙), (1) where 𝐪(𝑡) is the modal coordinate vector, 𝐔 = col(𝐔𝑘) is the mass-normalized modal transformation matrix, 𝜁𝑘 is the relative damping ratio of mode 𝑘, 𝜔n,𝑘 is the natural angular frequency and [∙] indicates the diagonal matrices. The time- delay between the subsequent teeth is given as 𝜏𝑙=60∙𝜑𝑙
𝑛∙2𝜋, where 𝜑𝑙 is the pitch angle (rad) between the subsequent teeth. Based on the geometry of the tool and the cutting force characteristics, the cutting force vector 𝐅 can be determined (the cutting force is characterized by empirical functions of the uncut chip thickness ℎ, see [Altintas 2012]).
Assuming that the pitch angles are all different for multitooth cutters, the main period of the system is 𝑇 = 60/𝑛. The cutting force vector 𝐅(𝑡, 𝐪, 𝐪𝜏𝑙) depends on the past positions of the tool 𝐪𝜏𝑙≔ 𝐪(𝑡 − 𝜏𝑙), whichintroduce variations in the chip geometry.
The stability properties of (1) are determined by the Floquet multipliers of the associated variational system [Insperger 2011]
𝐮̈(𝑡) + [2𝜁𝑘𝜔n,𝑘]𝐮̇(𝑡) + [𝜔n,𝑘2 ]𝐮(𝑡) =
∑𝑁𝑙=1𝜏 𝐔T𝐆𝑙(𝑡)𝐔(𝐮(𝑡 − 𝜏𝑙) − 𝐮(𝑡)), (2) where 𝐮(𝑡) ∶= 𝐪(𝑡) − 𝐪p(𝑡) is a small perturbation about the 𝑇-periodic solution 𝐪p(𝑡) = 𝐪p(𝑡 + 𝑇), and 𝑮𝑙(𝑡) are the 𝑇-periodic matrices. Stability analysis of (2) can be performed by numerical methods, such as the semi- discretization technique [Insperger 2011]. The governing equation can be rewritten into a first-order delay-differential equation in the form
𝐱̇(𝑡) = 𝐀(𝑡)𝐱(𝑡) + ∑𝑁𝑙=1𝜏 𝐁𝑙(𝑡)𝐱(𝑡 − 𝜏𝑙), (3) where 𝐀(𝑡) and 𝐁𝑙(𝑡) are also 𝑇-periodic matrices. Applying the semi-discretization method, the solution of (3) is approximated by the discrete-time map
𝐗𝑡+𝑇= 𝚽𝐗𝑡, (4)
where 𝐗𝑡 is state of the discretized delayed equation at time 𝑡, and 𝚽 is the monodromy matrix of the time-periodic system. The solution is stable if the spectral radius of the monodromy matrix is smaller than one, and unstable otherwise. Based on the critical eigenvalue of the monodromy matrix, the chatter frequencies can be predicted [Insperger 2008]. On the edge of stability, the trial function 𝐱(𝑡) = 𝐩(𝑡)𝑒𝑖𝜔c,b𝑡 (where 𝐩(𝑡) = 𝐩(𝑡 + 𝑇)) satisfies (3). According to the Floquet theory, the frequency components of chatter vibrations are located at discrete values at
𝜔c,𝑞= ±𝜔c,b+ 𝑞 ∙ 2𝜋/𝑇, 𝑞 ϵ ℤ, (5) where 2𝜋/𝑇 is the spindle frequency (rad/s), and 𝜔c,b is the base frequency that is determined by the critical eigenvalue of the monodromy matrix. Following the method proposed by [Dombovari 2011], the amplitude (ratio) of the frequency components can be calculated, and the dominant vibration frequencies can be predicted. The dominant frequency is typically close to one of the natural vibration modes of the tool (or workpiece). This property of the time-periodic systems helps to identify chatter based on the spectra of the measured signals.
3 CHATTER DETECTION
Identification of chatter based on spectra of the measured vibration signals is often not trivial, because the frequency content can be very diverse. The stationary solution 𝐪p(𝑡) of (1) in case of stable machining is periodic with 𝑇 and the corresponding spectrum contains nearly discrete peaks at the integer multiples of the spindle frequency 𝑓𝑇 = 1/𝑇 (Hz). When the periodic solution loses stability, chatter frequencies arise in the spectra of the measured signals at 𝜔c,𝑞. Ambient vibrations and noise are also captured by the sensors, which make it sometimes hard to pick the real chatter peaks in the spectrum. Therefore, chatter detection methods and indicator functions are used to help the identification process [Quintana 2011].
3.1 Traditional methods
There exist different methods to identify the unstable vibrations, which are categorized from several perspectives, see the review on the topic presented by [Quintana 2011]. The out-of-process solutions (off-line methods) are used to predict the stability lobe diagrams prior to the cutting process, while chatter detection methods (or on-line methods) are used to identify chatter during the machining. Based on the physical contact between the machine and sensors, direct and indirect methods can also be distinguished, see [Shiraishi 1989]. For example, strain gauges, dynamometers, thermal sensors, and accelerometers are direct sensors, while optical and sonic Fig. 1: Dynamical model of milling operations and the
schematic figure of the electric contact sensor.
MM Science Journal | 2021 | NOVEMBER - Special Issue on HSM2021 sensors are indirect instruments, since no physical contact
is needed during the operation. All sensors used during measurements have disadvantages, such as
the signal-to-noise ratio is small, the microphone typically contains external noise, which originates from the environment (fans, cooling system, other machines) with diverse frequency peaks unrelated to the spindle speed;
the acceleration sensor cannot be placed onto the rotating tool, only a near mounting point can be used, where the sensor measures the acceleration through bearings and other moving elements;
force sensor is usually placed under the workpiece: in case of flexible structures the measured force is not identical to the theoretical cutting force.
In order to reduce the uncertainty in the evaluation process, [Kuljanic 2008] presented a multi-sensor approach and chatter indicators, which combine the output of different sensors and give a more reliable prediction.
3.2 Spindle speed measurement
The control systems of the CNC machine tools continuously measure the actual spindle speed to keep the prescribed values. However, the speed can slightly fluctuate around the nominal value, moreover, a slight offset can also occur.
Even a slight mismatch between the desired and actual speeds (<0.1%) can lead to false results during the data evaluation process since the accumulating phase shift can be significant. The spindle speed can be determined from the measured signals also based on the higher harmonics of the spindle frequency (see [Kiss 2018]). It is also presented by [Kiss 2018] that small inaccuracies have high effect on the chatter detection techniques, too.
In order to increase the accuracy of spindle speed measurement, a measuring unit based on an analog reflective phototransistor (see Fig. 2) is applied. The reflected light on the surface provides trigger signs during the rotation of the spindle. Some of these reflective sensors have built-in ambient light rejection to compensate the lights form the environment, and have digital output. However, the integrated electronics have low sampling frequency 𝑓s (bandwidth), and the angular accuracy of these digital signals under one revolution is only
𝛥𝛼 = 360°60𝑛1
𝑓s. (6)
For example, in case of the Optek / TT Electronics OPB720 reflective switch (𝑓s=7 kHz) at 𝑛 = 30 000 rpm the angular resolution is only ~25.7°. To reach a desired 0.1° accuracy 1.8 MHz sampling rate would be needed, which could be achieved without internal logic only (e.g., Vishay CNY70 reflective sensor).
In a typical measurement, the signal of the spindle speed sensor is used together with other analog signals, e.g., accelerometer or force signals of a dynamometer, which typically leads to limited bandwidth. In case of the widely used National Instrument Compact DAQ Chassis cDAQ- 9178 and NI-9234 module, the sampling rate 𝑓s= 51.2 kHz, gives 102.4 samples per turn and 𝛥𝛼 = 3.51° angular accuracy at 𝑛 = 30 000 rpm. In case of a digital signal the trigger will arrive after 102 or 103 samples, with the resulting spindle speed 𝑛 = 29 825 rpm and 𝑛 = 30 118 rpm, respectively. The Vishay CNY70 sensor can also be used as an analog device, which outputs a fast, but continuous signal change (see Fig. 3a). Based on the interpolated values sub sampling trigger time can be determined.
3.3 Contact sensor
In case of stable machining, the physical contact is theoretically periodic, the entry and exit angles do not change in time, and the spectrum of the contact sensor is discrete. The schematic figure of the contact sensor is presented in Fig. 1. The tool operates as a switch, which closes the electric circuit if the tool is cutting. Ideally, this is (close to) a discrete signal with two states without transition.
A sample signal is presented in Fig. 3b, where the exit of the teeth is not ideal. This operation was unstable, the amplitude of vibrations of the tool tip were large enough to result in irregular contact at small chip thickness. The contact is theoretically not affected by environmental noise and external vibration, however, in real cases the contact is never ideal. In some cases the chip sticks onto the surface of the tool and results in false chatter marks. In order to distinguish the different situations, the spectra of the signals must be investigated.
4 EXPERIMENT
The devices were tested in a real case study on an NCT EmR-610Ms milling machine. During the experiment, a two- fluted variable pitch milling cutter was used, where the unequal pitch angle between the teeth is 168° and 192°, the helix angle is 𝛽 = 30°, and the diameter is 𝐷 = 16 mm. An Fig. 2: Experimental devices. The phototransistor and
the electric contact sensor are integrated into a prototype circuit.
Fig. 3: Sample captured signals during cutting operation:
(a) phototransistor, (b) contact sensor (-1 is noncutting, 1 is cutting).
MM Science Journal | 2021 | NOVEMBER - Special Issue on HSM2021 aluminum block (200x80x60 mm) made of AL2024-T351
was fixed onto the machine table and the length of the workpiece in the direction of the feed was 200 mm.
The frequency response functions (FRF) of the tool were measured by impulse hammer tests in directions 𝑥 (feed direction) and 𝑦. The identified dominant vibration modes (two degrees of freedom) are given in Tab. 1.
The cutting force characteristics is assumed to be a linear function of the uncut chip thickness ℎ in the form: 𝑓r(ℎ) = 𝐾re+ 𝐾rcℎ, 𝑓t(ℎ) = 𝐾te+ 𝐾tcℎ, the coefficients are 𝐾re= 16 N/mm, 𝐾te= 34 N/mm, 𝐾rc= 176 MPa, and 𝐾tc= 1095 MPa. The operations were 50% downmilling in all of the cases and the feed per revolution was 0.1 mm/rev. The stability chart is calculated by the semidiscretization method [Insperger 2011] and are presented in Fig. 4.
4.1 Chatter tests
Sample cutting tests were performed in the spindle speed region 5200-6200 rpm. The axial depth of cut 𝑎 was increased from 0.25 to 2 mm. In order to make the signal of the contact sensor more reliable, a slight ramp was added to the tool path, which was a 1 mm vertical increase after 200 mm horizontal displacement (≈ 0.3°). During the tests, the vibration sound was recorded by a Brüel&Kjær 2671 industrial microphone, and accelerations were measured by PCB 352C23 accelerometers mounted on the spindle housing and the workpiece, too.
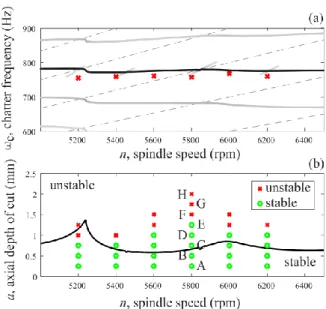
The experimentally identified stable/unstable points are marked by green circles/red crosses in Fig. 4. The dominant chatter frequency based on the spectrum of the microphone is marked by a red cross on the top panel. The results show a qualitatively good agreement with the predictions, but a slight shift in the natural frequency is recognizable. It is known that the modal parameters measured on the idle spindle (no rotation) are slightly different from the operational parameters (during rotation), see the study presented by [Hajdu 2020]. This can account for the mismatch between predictions and actual measurements.
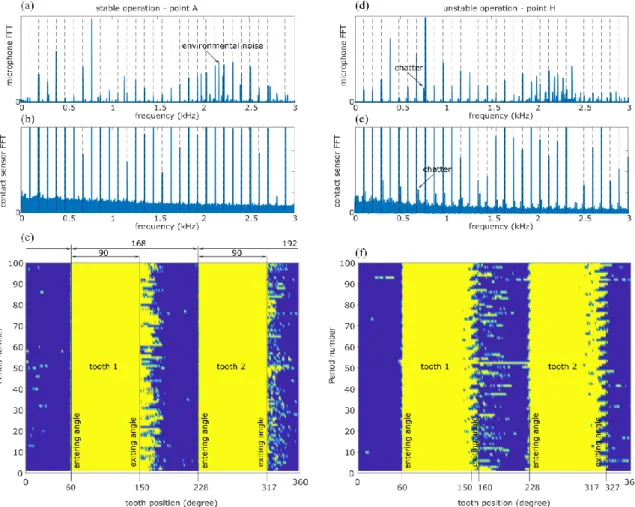
The spectra of the microphone and contact sensor are presented in Fig. 5 The stable measurement was performed at axial depth of cut 0.25 mm (point A in Fig. 4) and the unstable measurement was performed at axial depth of cut 2 mm (point H in Fig. 4). It must be noted that the microphone captures additional environmental noises, which must be ignored (Fig. 5a). These ambient vibrations may have a fixed frequency, and do not correspond to the vibrations of the tool tip. In contrast to the microphone, the contact sensor has a relative ideal spectrum since these frequencies are not present. The bottom panels (Fig. 5c,f) present the time-periodic sectioned signals based on the trigger of the phototransistor. The cutting and noncutting periods are clearly visible on the signals (entering and exiting angles). At 0.25 mm depth of cut, the difference of the entering angles match the pitch angles, therefore it is easy to identify which tooth is cutting. The radial immersion was 50%, meaning that the tool leaves the workpiece after 90° and then the contact is lost. However, the electric contact is not always lost completely, partly because of the helix angle and partly because the tool edge can slightly
graze the surface of the workpiece, which is enough to close the electric circuit. This results in a less ideal contact signal, but no dominant frequency is visible on the spectrum (except for the spindle frequencies).
In case of unstable machining, at 2 mm depth of cut (Fig.
5f), the contact between the workpiece and tool is lost close to the exiting angles, where the chip thickness is small (see the detailed explanation of the fly-over effect in milling [Dombovari 2019]). This results the periodic patterns at the exit angles. The corresponding spectrum also clearly shows the arising chatter frequencies.
Note that the chatter frequencies have relatively small amplitudes since the signal has only (theoretically) discreate values, but external noise is not present.
Therefore, in order to indicate better the occurrence of chatter, a cumulated spectrum is introduced as
Cn(𝜔) = ∑ C (𝜔 + 𝑘 ∙2𝜋
𝑇)
∞𝑘=0 , 𝜔 ∈ [0,2𝜋
𝑇] (7)
which sums up the higher modulations of the base frequency (C is the spectrum – FFT – of the contact signal).
With this indicator, and with the accurate sectioning of the signals, the 𝑇-periodic components can be eliminated, and the chatter frequency can be automatically detected. It can be useful to combine the method with another chatter indicator function and calculate the energy in the chatter vibrations based on the signals of the microphone, accelerometer or dynamometer as well ([Kuljanic 2008]).
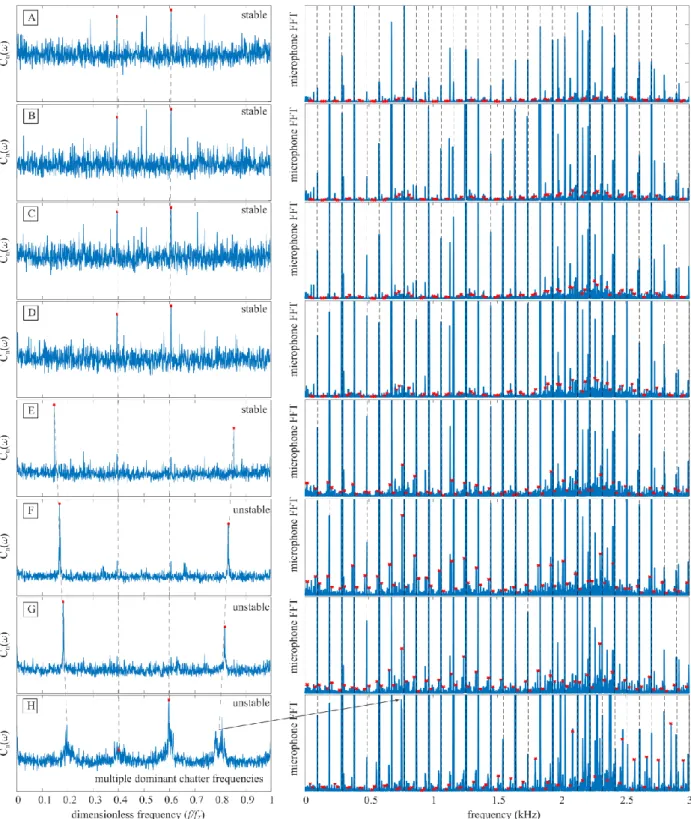
Fig. 6 shows the rise of the chatter vibrations at 𝑛 = 5800 rpm at different depth of cuts. It is notable that the base chatter frequencies are predicted already at 𝑎 = 0.25 mm, inside the stable domain, before unstable vibrations appeared. The reason for the early signs of chatter can be the stochastic resonance, which means that the stochastic effects excite the dominant multipliers of the dynamical system and stable (stochastic) vibrations can occur with frequency close to the chatter frequency. The works of [Sykora 2021] and [Bachrathy 2021] explain how the energy in chatter vibrations increase as the stability boundaries are approached. At 𝑎 = 2 mm, two dominant vibration frequencies appear, which means that the monodromy matrix has two pair of complex eigenvalues outside the unit circle. When the energy in chatter vibrations is large, the microphone provides obvious evidence, however, in case of marginally stable/unstable operation, it is not always trivial. With the help of the contact sensor the possible
Fig. 4: (a) Dominant chatter frequencies along the stability border. (b) Stability chart.
Tab. 1: Modal parameters of the milling tool.
Mode 𝑘 𝜔n,𝑘 (Hz) 𝜁𝑘 (%) 𝐔𝑘 (kg-1/2) 1 761.5 1.46 2.036 ∙ [0 1]T 2 785 1.49 1.847 ∙ [1 0]T
MM Science Journal | 2021 | NOVEMBER - Special Issue on HSM2021 chatter frequencies can be automatically detected. By
utilizing chatter indicators, e.g., the method presented by [Kuljanic 2008], the increase in the energy, and hence the closeness of instability, can be monitored.
5 SUMMARY
An electric contact sensor is tested to detect the onset chatter during machining operations. The dominant chatter frequencies are clearly visible on the spectrum of the signal and can be automatically selected. By selecting the chatter peaks in other signals, the dominant vibration frequency can be identified and monitored continuously.
The spindle speed measurement is made more accurate with the use of the phototransistor and made the sectioning of the signals also possible.
6 ACKNOWLEDGMENTS
This work was supported by the Hungarian Scientific Research Fund (OTKA FK-124462).
The research reported in this paper and carried out at BME has been supported by the NRDI Fund (TKP2020 IES, Grant No. BME-IE-NAT and TKP2020 NC, Grant No. BME- NC) based on the charter of bolster issued by the NRDI Office under the auspices of the Ministry for Innovation and Technology.
7 REFERENCES
[Altintas 2012] Altintas, Y. Manufacturing Automation: Metal Cutting Mechanics, Machine Tool Vibrations, and CNC Design. Cambridge University Press, 2012.
[Bachrathy 2009] Bachrathy, D., et al. Surface properties of the machined workpiece for helical mills. Machining Science and Technology, 2009, Vol.13, No.2, pp 227-245.
[Bachrathy 2021] Bachrathy, D., et al. Why is it hard to identify the onset of chatter? A stochastic resonance perspective. CIRP Annals, 2021.
[Dombovari 2011] Dombovari, Z., et al. Prediction of multiple dominant chatter frequencies in milling processes.
International Journal of Machine Tools and Manufacture, 2011, Vol.51, No.6, pp 457–464.
[Dombovari 2019] Dombovari, Z., et al. Experimental observations on unsafe zones in milling processes.
Philosophical Transactions of the Royal Society A:
Mathematical, Physical and Engineering Sciences, 2019, Vol.377, No.2153, pp 20180125.
[Hajdu 2020] Hajdu, D., et al. Robust stability of milling operations based on pseudospectral approach.
International Journal of Machine Tools and Manufacture, 2020, Vol.149, pp 103516.
[Insperger 2008] Insperger, T., et al. On the chatter frequencies of milling processes with runout, International Journal of Machine Tools and Manufacture, 2008, Vol.48, No.10, pp. 1081–1089.
[Insperger 2011] Insperger, T., Stepan, G. Semi- Discretization for Time-Delay Systems: Stability and Engineering Applications. Springer New York, 2011.
[Kiss 2018] Kiss, A. K., et al. Operational stability prediction in milling based on impact tests. Mechanical Systems and Signal Processing, 2018, Vol.103, pp 327–339.
Fig. 5: (a-c) Stable operation at 𝑎 =0.25 mm depth of cut, and (d-f) unstable operation at 𝑎 =2 mm depth of cut.
MM Science Journal | 2021 | NOVEMBER - Special Issue on HSM2021 [Kuljanic 2008] Kuljanic, E., et al. Multisensor approaches
for chatter detection in milling. Journal of Sound and Vibration, 2008, Vol.312, No.4-5, pp 672–693.
[Munoa 2016] Munoa, J., et al. Chatter suppression techniques in metal cutting. CIRP Annals, 2016, Vol.65, pp 785 – 808.
[Quintana 2011] Quintana, G., Ciurana, J. Chatter in machining processes: A review. International Journal of Machine Tools and Manufacture, 2011, Vol.51, pp 363–
376.
[Shiraishi 1989] Shiraishi, M., Scope of in-process measurement, monitoring and control techniques in
machining processes—Part 3: In-process techniques for cutting processes and machine tools. Precision Engineering, 1989, Vol.11, No.1, pp 39–47.
[Stepan 2018] Stepan, G., et al. Ultimate capability of variable pitch milling cutters. CIRP Annals, 2018, Vol.67, No.1, pp 373–376.
[Sykora 2021] Sykora, H. T., et al. Chatter formation during milling due to stochastic noise-induced resonance.
Mechanical Systems and Signal Processing, 2021, Vol.161, pp 107987.
Fig. 6: Cumulated spectra of the signal of the contact sensor (left) and spectra of the microphone (right). Red crosses indicate the chatter frequencies detected based on the contact sensor.