ARTICLE
OPENPressure-induced superconductivity and structure phase transition in Pt 2 HgSe 3
Cuiying Pei 1,8, Suhua Jin1,8, Peihao Huang2,8, Anna Vymazalova3, Lingling Gao 1, Yi Zhao 1, Weizheng Cao 1, Changhua Li1, Peter Nemes-Incze 4, Yulin Chen 1,5,6, Hanyu Liu 2,7✉, Gang Li 1,5✉and Yanpeng Qi 1✉
Recently monolayer jacutingaite (Pt2HgSe3), a naturally occurring exfoliable mineral, discovered in Brazil in 2008, has been theoretically predicted as a candidate quantum spin Hall system with a 0.5 eV band gap, while the bulk form is one of only a few known dual-topological insulators that may host different surface states protected by symmetries. In this work, we systematically investigate both structure and electronic evolution of bulk Pt2HgSe3under high pressure up to 96 GPa. The nontrivial topology is theoretically stable, and persists up to the structural phase transition observed in the high-pressure regime. Interestingly, we found that this phase transition is accompanied by the appearance of superconductivity at around 55 GPa and the critical transition temperatureTcincreases with applied pressure. Our results demonstrate that Pt2HgSe3with nontrivial topology of electronic states displays a ground state upon compression and raises potentials in application to the next-generation spintronic devices.
npj Quantum Materials (2021) 6:98 ; https://doi.org/10.1038/s41535-021-00402-w
INTRODUCTION
Quantum spin Hall insulators (QSHIs) constitute an important class of topological systems having a gapped insulating bulk and gapless helical edge states. Importantly, helical edge states, where the helical locking of spin and momentum suppresses back- scattering of charge carriers, are robust against interactions and nonmagnetic disorders, making QSHIs possess promising applica- tions from low power electronics to quantum computing1–9. After thefirst experimental realization of a QSHI in the form of a HgTe/
CdTe quantum well at cryogenic temperatures4,10, a quantum spin Hall state has subsequently been identified in exfoliated 1T′phase of transition metal dichalcogenides (e.g., WTe2) by scanning tunneling microscopy11 and charge transport measurements12. Despite their massive fundamental interest and their prospective technological applications, a major challenge is the identification of large gap QSHI materials, which would enable room temperature dissipationless transport of their edge states.
Recently, a robust QSHI with a gap of up to 0.5 eV, which is one order of magnitude larger than that in WTe2, has also been predicted in monolayer Pt2HgSe313. The ternary compound Pt2HgSe3, so called Jacutingaite14–20, has a “sandwich-like” structure reminiscent of transition metal dichalcogenides, with a platinum layer between selenium and mercury. In the case of the monolayer, it was argued that the competition between large spin-orbit coupling, associated with Hg and Pt atoms, and sublattice symmetry breaking leads to a QSHI state robust at room temperature and switchable by external electric fields13. Furthermore, recent theoretical work found that bulk Pt2HgSe3is one of only a few known dual-topological semimetals and may host different surface states protected by symmetries that are unrelated to the QSHI state21–23.
Specifically, Wu et al. predicted that the monolayer of Pt2HgSe3 hosts different phases of unconventional superconductivity for
finite hole and electron doping24. High pressure can effectively modify lattice structures and the corresponding electronic states in a systematic fashion25–27. Indeed, superconductivity has been induced by the use of pressure in some topological com- pounds27–34. Here, we systematically investigate the high-pressure behavior of bulk Pt2HgSe3. Through ab initio band structure calculations, we find that the application of pressure does not qualitatively change the electronic and topological nature of the material until the structural phase transition is observed in the high- pressure regime. Interestingly, superconductivity appears beyond the structural phase transition and the maximum critical tempera- ture,Tc, of 4.4 K at 88.8 GPa is observed. The results demonstrate that Pt2HgSe3 compounds with nontrivial topology of electronic states display a ground states upon compression.
RESULTS AND DISCUSSION
Crystal structure and electronic properties of Pt2HgSe3 Jacutingaite (Pt2HgSe3) is a layered platinum-group mineral, which has a centrosymmetric trigonal structure, belonging to the space groupP3m1 (No.164). As shown in Fig.1a, b, Hg atoms form a buckled honeycomb lattice surrounded by triangles of Pt and Se.
There are two inequivalent platinum positions indicated by Pt1 and Pt2. The Pt1 atoms show an octahedral coordination with six selenium atoms, while Pt2 are surrounded by two mercury atoms in a trans position with respect to one another and four selenium atoms in a square planar coordination. The Pt1 and Pt2 octahedra are Se-Se edges shared and form layers oriented parallel to (001), which is further AA-type stacking along thecaxis. TheP3m1 phase is known to be topological at ambient pressure. In our ab initio calculations, we found that, at all pressured studied in this work, Pt2HgSe3 remains topological with the location of topological surface states being slightly modified. The details of the bulk,
1School of Physical Science and Technology, ShanghaiTech University, Shanghai 201210, China.2State Key Laboratory of Superhard Materials and International Center for Computational Method and Software, College of Physics, Jilin University, Changchun 130012, China.3Czech Geological Survey, Prague 152 00, Czech Republic.4Centre for Energy Research, Institute of Technical Physics and Materials Science, Budapest 1121, Hungary.5ShanghaiTech Laboratory for Topological Physics, ShanghaiTech University, Shanghai 201210, China.6Department of Physics, Clarendon Laboratory, University of Oxford, Parks Road, Oxford OX1 3PU, UK.7International Center of Future Science, Jilin University, Changchun 130012, China.8These authors contributed equally: Cuiying Pei, Suhua Jin, Peihao Huang.✉email: lhy@calypso.cn; ligang@shanghaitech.edu.cn; qiyp@shanghaitech.edu.cn
www.nature.com/npjquantmats
1234567890():,;
surface states and their evolutions under pressure will be discussed in later sections. Here, we show in Fig. 1c, d the bulk and surface electronic structures at an arbitrary pressure 15.9 GPa.
In Fig.1c, the dashed blue lines and the solid red lines correspond to the bulk band structures without/with spin-orbital coupling. As is clearly shown, under pressure, Pt2HgSe3remains metallic and topological, which holds as long as the space group is unchanged.
Electrical resistivity at high pressure
Pt2HgSe3possesses a typical layered structure, which is principally sensitive to external pressure. Hence, we measuredρ(T) for Pt2HgSe3
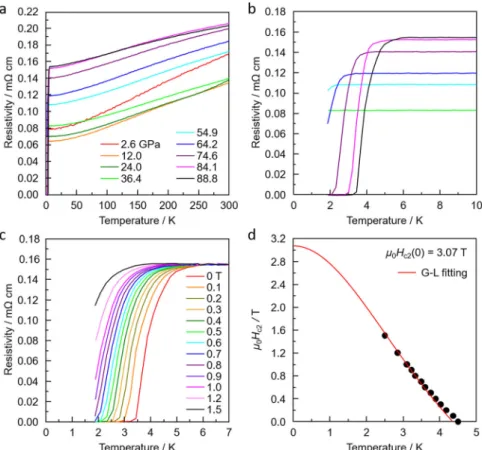
using a nonmagnetic diamond anvil cell (DAC). Fig.2a shows the plots of temperature versus resistivity of Pt2HgSe3for pressures up to 88.8 GPa. It reveals a metallic behavior in the whole pressure range. In a low-pressure region, increasing the pressure initially induces a weak but continuous suppression of the overall magnitude ofρwith a minimum occurring atPmin=12 GPa. Upon further increasing pressure, the resistivity starts to increase gradually.
At a pressure of 54.9 GPa, a small resistivity drop presents at 1.9 K, indicating superconducting phase transition. It should be noted that Mauro et al. performed transport measurements on individualflakes of Pt2HgSe3 down to 250 mK and found no superconducting transition18. However, it cannot rule out that superconductivity appears in the material at pressures below 54.9 GPa, at temperatures lower than measured here. As shown in Fig.2b, the resistivity drop becomes more visible and the critical temperatureTcincreases to the maximum of 4.4 K at 88.8 GPa. The measurements on different samples of Pt2HgSe3 for three independent runs provide the consistent and reproducible results (Supplementary Fig. 1), confirm- ing the intrinsic superconductivity under pressure. To gain insights into the superconducting transition, we applied the magneticfield for Pt2HgSe3 subjected to 88.8 GPa. When increasing μ0H, the resistivity drop is continuously shifted to a lower temperature (Fig.2c). The upper critical field,μ0Hc2, is determined using 90%
point on the resistivity transition curves, and plots of Hc2(T) are shown in Fig.2d. A simple estimate using the conventional one-
band Werthamer–Helfand–Hohenberg approximation35, neglecting the Pauli spin-paramagnetism effect and spin-orbit interaction, yields a value of 2.37 T for Pt2HgSe3. By using the Ginzburg–Landau formula μ0Hc2ð Þ ¼T μ0Hc2ð Þ01ðT=TcÞ2
=1þðT=TcÞ2 to fit the data, the estimatedμ0Hc2(0) value is 3.07 T at 88.8 GPa. These fields are much lower than the Pauli limitingfields,HP(0)=1.84Tc~ 8.10 T, respectively, indicating that Pauli pair breaking is not relevant.
Crystal structure evolution at high pressure
To further identify the pressure-induced electron structure transition, in situ x-ray diffraction (XRD) measurements have been performed on Pt2HgSe3to analysis the structure evolution under various pressures. Fig.3a displays the high-pressure synchrotron XRD patterns of Pt2HgSe3measured at room temperature up to 96.3 GPa. A representative refinement at 1 atm is displayed in Supplementary Fig. 2. All the diffraction peaks can be indexed well to a trigonal structure with space groupP3m1 based on Rietveld refinement with General Structure Analysis System (GSAS) soft- ware package36. As shown in Fig.3b, botha-axis andc-axis lattice constants decrease with increasing pressure. The structure of Pt2HgSe3 is robust until 50 GPa. However, when the pressure increases up to 54.2 GPa, a set of new peaks emerges and dominates on further compression, indicating the occurrence of a structural phase transition. It should be noted that the super- conductivity is observed beyond this pressure.
The pressure-induced structure evolution of Pt2HgSe3was also confirmed by in situ Raman spectroscopy measurements. Accord- ing to group theory analysis, there are seven Raman-active modes (3A1g+4Eg) that can be observed experimentally for Pt2HgSe337. Fig.3c shows the Raman spectra of Pt2HgSe3at various pressures.
The assignments of the modes of Pt2HgSe3at 1.9 GPa are given as follows:A31g=96.3 cm−1,Eg3=137.2 cm−1,Eg2=184.3 cm−1,A21g= 202.2 cm−1,A11g=210.7 cm−1,E1g=213.1 cm−1. TheE4gmode has not been observed in ambient condition due to its low scattering efficiency. With increasing pressure, the profile of the spectra remains similar to that at ambient pressure, whereas the observed Fig. 1 Crystal and electronic structures of Pt2HgSe3. a,bCrystal structure of Pt2HgSe3. Pt1 and Pt2 octahedra that are shown in blue and red, respectively, denote two symmetry inequivalent local environments of Pt atom in the unit cell.cElectronic structure of Pt2HgSe3.dThe corresponding states at (001) surface.
2
1234567890():,;
modes exhibit blue shift, thus showing the normal pressure behavior (Fig.3d). An abrupt disappearance of Raman peaks for pressure near to 50 GPa indicates the structural phase transition to a high-pressure phase (Supplementary Fig. 3). The evolution of the Raman spectra is consistent with our synchrotron XRD patterns. In summary, the Raman study provides further evidence for pressure-induced structural phase transitions.
Pressure-induced phase transition and high-pressure structure
To identify the high-pressure phase, we performed extensive structure searches of Pt2HgSe3by using our developed structure search method38,39(Supplementary Figs. 4–6). Structure searches are carried out with simulation cells ranging from one to four formula units and successfully predicted a stable phase (space groupPc, Phase II) at 68 GPa. The enthalpy difference curves for the predicted phases are shown in Supplementary Fig. 4a. The Phase II has lower enthalpy than that of the ambient phase (space group P3m1, Phase I)15, when the pressure is above 45 GPa, indicating the energetic stability of the newly predicted phase.
The experimentally observed phase transition is in apparent agreement with our theoretical prediction. Dynamical structural stabilities of the predicted structure were further investigated by calculating phonon dispersion curves. As shown in Supplementary Figs. 4 and 7, no imaginary frequency was found for the new structure, indicating dynamical stability of predicted structures.
We emphasize that by only relying on the experimental data, the structural evolution of the high-pressure phase is not possible because the XRD peaks are rather weak and broad. However, we have the predicted structure at hand, allowing us to refine the
observed XRD data from 58.0 to 96.3 GPa by using the predicted structures. It is remarkable that the uses of the predicted structures gave excellent Rietveld fittings, therefore leading to the unambiguous determination of the high pressure as the predicted structure. The high-pressure phase (Phase II) of Pt2HgSe3possesses a monoclinic structure with space group Pc.
The details of crystallographic data are shown in Table 1. The predicted crystal structure of Pt2HgSe3 at 68 GPa is shown in Fig. 4a. Accompanying the structure transition, the bonding feature changes dramatically. In the Phase II, Hg exists as a dimer with Hg-Hg distance of 2.52 Å, which is much smaller than that shortest value (4.5 Å) in ambient phase. In addition, compared with Phase I, the Pt-Pt, Se-Se distances decrease from 3.67, 3.37 Å to 2.81, 2.54–2.77 Å, respectively, while the Hg-Pt, Hg-Se and Pt-Se distances become diverse.
Electronic structure and topological properties under high pressure
To theoretically understand the evolution of the topology under pressures, we have performed DFT calculations of Pt2HgSe3 in P3m1 phase. Fig. 5a shows the bulk electronic structure of Pt2HgSe3at ten different pressures. At all pressures, Pt2HgSe3are metallic with electron pockets at K and H, and hole pockets between A-L, A-H, K-H, etc. With the increase of the applied pressure, the electron pockets become larger with the Dirac point at K and H moving to higher binding energy. Meanwhile, the hole pockets between A-L, A-H become larger as well by extending to higher energy. However, the hole pocket between K-H becomes smaller.
Fig. 2 Electrical transport proerties of Pt2HgSe3under high pressure. aElectrical resistivity of Pt2HgSe3as a function of temperature for various pressures. b Temperature-dependent resistivity of Pt2HgSe3 in the vicinity of the superconducting transition. c Temperature dependence of resistivity under different magneticfields for Pt2HgSe3at 88.8 GPa.dTemperature dependence of upper criticalfield for Pt2HgSe3at 88.8 GPa. Here,Tcis determined as the 90% drop of the normal state resistivity. The solid lines represent thefits based on the Ginzburg–Landau (G-L) formula.
C. Pei et al.
3
We further calculated the electronic states at (001) surface of Pt2HgSe3 to gain insight into the pressure influence on the topological nature, shown in Fig. 5b. We used the selected columns of the density matrix method to automatically generate the Wannier orbitals40,41, which were subsequently used to construct the tight-binding model to reproduce the 144 Bloch bands around the Fermi level (EF) and further calculated the surface states with the iterative Green’s function approach42. As shown in Fig. 5b, at all pressures studied where the P3m1 structure is preserved, the topological nature of Pt2HgSe3 is unaffected by the external pressure. Both surface states locating above and below the Fermi level survive at all ten pressures, indicating a robust topological nature of the system, confirming the topology is crystalline symmetry protected.
We further calculated the electronic band structure and the density of states (DOS) for the newly predicted phase. Fig. 4b indicates typical metallic feature of phase II (Pcphase) at 68 GPa, with significant contributions from Ptt2gand Sepyorbitals around the Fermi level. Our results demonstrate that superconductivity observed here comes from phase II. This is obviously different from previous prediction where unconventional superconductivity in monolayer jacutingaite could induce at van Hove filling for electron and hole doping24. We also characterized the phase II in terms of the topology by calculating the elementary band
representations of the bands below the band gap around the Fermi level using VASP2Trace43, and we found it is trivial (Supplementary Fig. 8). The transition from P3m1 to Pc phase not only induces the sharp change of resistivity, but also accompanies the topological phase transition originating from the loss of mirror protection present inP3m1.
Phase diagram of Pt2HgSe3
The pressure dependence of the resistivity at 1.8 K and the critical temperature of superconductivity for Pt2HgSe3are summarized in Fig. 6. It is seen that the high pressure dramatically alters the electronic properties in Pt2HgSe3. The resistivity first decreases with pressure to a minimum at approximate 11 GPa and then displays the opposite trend with further increasing pressure. The non-monotonic evolution of ρ(T) is also observed in other topological materials32,44. Here, we emphasize that this peculiar behavior of the resistivity in Pt2HgSe3 is not associated with a structure phase transition based on in situ high-pressure XRD measurements. However, the lattice parameter ratioc/apresents a discontinuous trend at the same pressure, indicating the anisotropy is changed at this pressure (Fig.3b). Our calculations clearly indicate that the topological phase transition cannot explain the resistivity change in Pt2HgSe3, as the topological Fig. 3 Structure evolution of Pt2HgSe3under high pressure. aXRD patterns of Pt2HgSe3under pressure up to 96.3 GPa at room temperature with an x-ray wavelength ofλ=0.6199 Å. The red and black patterns distinguish phase transition with pressure over 50.1 GPa. The new peaks attributed to phase II are marked with black dots.bPressure dependence of lattice parametera,c, andc/aratio for Pt2HgSe3P3m1phase.
cRaman spectra at various pressures for Pt2HgSe3.dRaman shift for Pt2HgSe3in compression; the vibration modes display in increasing wavenumber order.
4
nature persists to the structure change at 60 GPa. The evolution of the surface states is strongly affected by the surface potential, which does not monotonically change with the increase of pressure. Thus, we do not observe a uniform behavior of the surface state under the evolution of the pressure. The surface states only take a smaller weight as compared to the bulk states in contribution to the fermi surface. The overall fermi surface enlarges with the increase of pressure. This is consistent with the resistivity measurement at pressures smaller than 11 GPa.
However, when pressure is greater than 11 GPa, the experimental resistivity displays an upper turn and further increases with pressure, which cannot be solely explained by the electronic structure predicted by DFT. Meanwhile, the Raman spectra show thatA21gmode becomes weak and Eg4mode emerged at around 10.7 GPa (Fig.3d). Thus, other mechanisms, including the intrinsic electron–phonon interactions, extrinsic defects/vacancies reaction to external pressure, are more likely responsible for this interesting behavior.
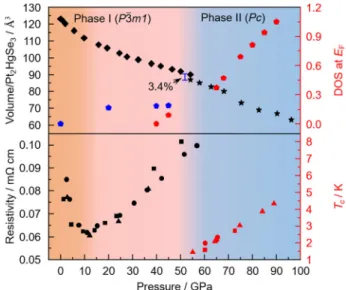
At a further increase of pressure, structural phase transition observed accompanying 3.4% volume drops at a critical pressure of 54.2 GPa (as shown on the upper panel of Fig.6). It is clearly seen that the superconducting state emerges beyond the phase transition, and then the superconducting transition temperature increases further with applied pressure. TheTcof Pt2HgSe3rises to 4.4 K at the pressure of 88 GPa and still does not exhibit the trend of saturation. As superconductivity occurs among electronic states atEF, we investigated the DOS at EF in the Phase II for various pressures (Supplementary Figs. 9 and 10). The upper panel of Fig.6also shows DOS at theEFfrom 65 to 90 GPa. It is clear that the DOS increase monotonically with increasing pressure. In addition, the electron–phonon coupling (EPC) parameter (λ) andTc
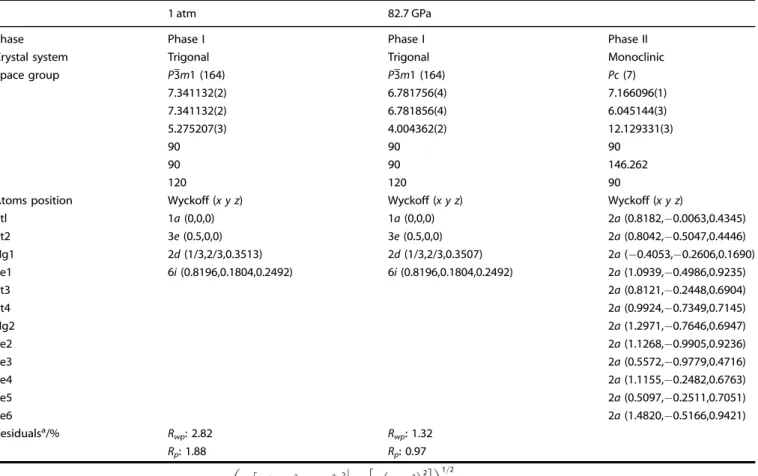
Table 1. Structures of Pt2HgSe3in phase I and phase II. Structural parameters of Pt2HgSe3under different pressures at room temperature.
1 atm 82.7 GPa
Phase Phase I Phase I Phase II
Crystal system Trigonal Trigonal Monoclinic
Space group P3m1(164) P3m1(164) Pc(7)
a 7.341132(2) 6.781756(4) 7.166096(1)
b 7.341132(2) 6.781856(4) 6.045144(3)
c 5.275207(3) 4.004362(2) 12.129331(3)
α 90 90 90
β 90 90 146.262
γ 120 120 90
Atoms position Wyckoff (x y z) Wyckoff (x y z) Wyckoff (x y z)
Ptl 1a(0,0,0) 1a(0,0,0) 2a(0.8182,−0.0063,0.4345)
Pt2 3e(0.5,0,0) 3e(0.5,0,0) 2a(0.8042,−0.5047,0.4446)
Hg1 2d(1/3,2/3,0.3513) 2d(1/3,2/3,0.3507) 2a(−0.4053,−0.2606,0.1690)
Se1 6i(0.8196,0.1804,0.2492) 6i(0.8196,0.1804,0.2492) 2a(1.0939,−0.4986,0.9235)
Pt3 2a(0.8121,−0.2448,0.6904)
Pt4 2a(0.9924,−0.7349,0.7145)
Hg2 2a(1.2971,−0.7646,0.6947)
Se2 2a(1.1268,−0.9905,0.9236)
Se3 2a(0.5572,−0.9779,0.4716)
Se4 2a(1.1155,−0.2482,0.6763)
Se5 2a(0.5097,−0.2511,0.7051)
Se6 2a(1.4820,−0.5166,0.9421)
Residualsa/% Rwp: 2.82 Rwp: 1.32
Rp: 1.88 Rp: 0.97
aHereRp¼P Fobs
j j jFcalcj
j j=P
Fobs
j jandRwp¼ P
w Fjobsj2jFcalcj22
h =P
wjFobsj22
1=2
whereFobsis the observed structure factor andFcalcis the calculated structure factor.
Fig. 4 Crystal and band structures of Pt2HgSe3 in phase II. a Crystal structure of Pt2HgSe3 in phase II (Pc). b Electronic band structure and density of states of Pt2HgSe3at 68 GPa without SOC.
Black, blue, red, and olive lines stand for the DOS of whole, Pt, Se, and Hg, respectively.
C. Pei et al.
5
is estimated from the Allen–Dynes formula of thePcphase under high pressures.λ increases from 0.41 to 0.43 and theoreticalTc
increases from 0.68 to 0.87 K monotonically when pressure increase from 45 to 90 GPa, which agree with our experimental results (Supplementary Fig. 9 and Supplementary Tables 1 and 2).
In conclusion, the evolution of the electrical transport properties in QSHI Pt2HgSe3 is investigated under high pressure. A non- monotonic evolution ofρ(T) is observed under high pressure. The nontrivial topology in Pt2HgSe3is robust and persists to around 55 GPa according to the calculations. The appearance of super- conductivity is accompanied by a structural phase transition.
Considering effectively tunable of electronic properties and crystal structure in this QSHI, Pt2HgSe3 offers a platform for exploring exotic physics upon compression.
METHODS Crystal growth
The high-quality Pt2HgSe3sample used in this work was synthesized from three individual elements by high-temperature solid state reactions23.
Experimental details of high-pressure measurements
In situ high-pressure resistivity measurements were performed in a nonmagnetic DAC. A cubic BN/epoxy mixture layer was inserted between BeCu gaskets and electrical leads. Four Pt foils were arranged in a van der Pauw four-probe configuration to contact the sample in the chamber for resistivity measurements. Pressure was determined by the ruby lumines- cence method45. An in situ high-pressure Raman spectroscopy investiga- tion of Pt2HgSe3was performed using a Raman spectrometer (Renishaw inVia, UK) with a laser excitation wavelength of 532 nm and low- wavenumber filter. A symmetric DAC with anvil culet sizes of 250μm was used, with silicon oil as pressure transmitting medium (PTM). In situ high-pressure XRD measurements were performed at beamline BL15U of Shanghai Synchrotron Radiation Facility (x-ray wavelengthλ=0.6199 Å).
Fig. 5 Elctronic structure of Pt2HgSe3 under high pressure. aElectronic structure of Pt2HgSe3in space groupP3m1 phase at different pressures. The blue dashed lines and red solid lines correspond to the calculations without/with SOC, respectively.bThe corresponding states at (001) surface calculated from Wannier tight-binding model.
Fig. 6 Structure and electronicP-Tphase diagram of Pt2HgSe3. The lattice volume, DOS atEF, resistivity at 1.8 K andTcfor Pt2HgSe3
is shown as a function of pressure. The upper panel shows the pressure dependence of the lattice volume calculated from experiments. The density of states (DOS) at the Fermi level for phase II also shown here. Black rhombus and star stand for lattice volume in phase I and phase II, respectively. Blue and red pentagons stand for DOS at the Fermi level for phase I and phase II. The lower panel shows the superconducting Tc as function of pressure and resistivity at 1.8 K for Pt2HgSe3 in different runs. The values ofTc
onset were determined from the high-pressure resistivity. Dot, diamond, and triangle stand forρ(T) measurements in run I, run II, and run III, respectively. Black and red stand for resistivity at 1.8 K andTc, respectively.
6
Symmetric DACs with anvil culet sizes of 250μm and Re gaskets were used.
Silicon oil was used as the PTM and pressure was determined by the ruby luminescence method45. The two-dimensional diffraction images were analyzed using the FIT2D software46. Rietveld refinements on crystal structures under high pressure were performed using the GSAS and the graphical user interface EXPGUI36,47.
DFT calculations
Structure prediction was performed through a swam-intelligence-based CALYPSO method and its same-name code38,39,48. Density functional total energy calculations and structure relaxation were performed using the VASP plane-wave code49,50. We have adopted the Perdew–Burke–Ernzerhof (PBE) generalized gradient approximation den- sity functional51and frozen-core all-electron projector-augmented wave potentials52 in our calculations. The electronic wave functions are expanded in a plane-wave basis set with a kinetic energy cutoff of 350 eV. The Brillouin zone sampling is performed on k-meshes with a reciprocal space resolution of 2π× 0.03 Å−1to ensure that energies are converged to several meV/atom. The bulk and surface electronic structures under the evolution of pressures were calculated with VASP, while EPC parameterλwas calculated within the framework of linear response theory through the EPC module of the QUANTUM ESPRESSO code53. We have adopted the PBE generalized gradient approximation density functional and ultrasoft pseudopotential in our calculations. The kinetic energy cutoff with 70 Ry, a 3 × 3 × 3k-mesh, and a 3 × 3 × 3q-mesh are used for the EPC calculations.
DATA AVAILABILITY
The data that support thefindings of this study are available from the corresponding authors upon reasonable request.
Received: 17 February 2021; Accepted: 9 November 2021;
REFERENCES
1. Kane, C. L. & Mele, E. J. Quantum spin Hall effect in graphene.Phys. Rev. Lett.95, 226801 (2005).
2. Kane, C. L. & Mele, E. J. Z2topological order and the quantum spin Hall effect.
Phys. Rev. Lett.95, 146802 (2005).
3. Bernevig, B. A. & Zhang, S. C. Quantum spin Hall effect.Phys. Rev. Lett.96, 106802 (2006).
4. König, M. et al. Quantum spin Hall insulator state in HgTe quantum wells.Science 318, 766 (2007).
5. Knez, I., Du, R. R. & Sullivan, G. Evidence for helical edge modes in inverted InAs/
GaSb quantum wells.Phys. Rev. Lett.107, 136603 (2011).
6. Suzuki, K., Harada, Y., Onomitsu, K. & Muraki, K. Edge channel transport in the InAs/GaSb topological insulating phase.Phys. Rev. B87, 235311 (2013).
7. Fei, Z. et al. Edge conduction in monolayer WTe2.Nat. Phys.13, 677–682 (2017).
8. Wu, S. et al. Observation of the quantum spin Hall effect up to 100 kelvin in a monolayer crystal.Science359, 76 (2018).
9. Reis, F. et al. Bismuthene on a SiC substrate: a candidate for a high-temperature quantum spin Hall material.Science357, 287–290 (2017).
10. Bernevig, B. A., Hughes, T. L. & Zhang, S.-C. Quantum spin Hall effect and topo- logical phase transition in HgTe quantum wells.Science314, 1757 (2006).
11. Tang, S. et al. Quantum spin Hall state in monolayer 1T’-WTe2.Nat. Phys.13, 683–687 (2017).
12. Shi, Y. et al. Imaging quantum spin Hall edges in monolayer WTe2.Sci. Adv.5, 1 (2019).
13. Marrazzo, A., Gibertini, M., Campi, D., Mounet, N. & Marzari, N. Prediction of a large-gap and switchable Kane-Mele quantum spin Hall insulator.Phys. Rev. Lett.
120, 117701 (2018).
14. Cabral, A. R., Galbiatti, H. F., Kwitko-Ribeiro, R. & Lehmann, B. Platinum enrichment at low temperatures and related microstructures, with examples of hongshiite (PtCu) and empirical‘Pt2HgSe3’from Itabira, Minas Gerais, Brazil.Terra Nova20, 32–37 (2008).
15. Vymazalova, A. et al. Jacutingaite, Pt2HgSe3, a new platinum-group mineral species from the Cauê iron-ore deposit, Itabira district, Minas Gerais, Brazil.Can.
Mineral.50, 431–440 (2012).
16. de Lima, F. C., Miwa, R. H. & Fazzio, A. Jacutingaite-family: a class of topological materials.Phys. Rev. B102, 235153 (2020).
17. Rademaker, L. & Gibertini, M. Gate-tunable imbalanced Kane-Mele model in encapsulated bilayer jacutingaite.Phys. Rev. Mater.5, 044201 (2021).
18. Mauro, D. et al. Multi-frequency Shubnikov-de Haas oscillations in topological semimetal Pt2HgSe3.2D Mater.7, 025042 (2020).
19. Marrazzo, A., Marzari, N. & Gibertini, M. Emergent dual topology in the three- dimensional Kane-Mele Pt2HgSe3.Phys. Rev. Res.2, 012063 (2020).
20. Marrazzo, A., Gibertini, M., Campi, D., Mounet, N. & Marzari, N. Relative abundance of Z2topological order in exfoliable two-dimensional insulators.Nano Lett.19, 8431–8440 (2019).
21. Facio, J. I. et al. Dual topology in jacutingaite Pt2HgSe3.Phys. Rev. Mater.3, 074202 (2019).
22. Ghosh, B. et al. Saddle-point Van Hove singularity and dual topological state in Pt2HgSe3.Phys. Rev. B100, 235101 (2019).
23. Kandrai, K. et al. Signature of large-gap quantum spin Hall state in the layered mineral Jacutingaite.Nano Lett.20, 5207–5213 (2020).
24. Wu, X., Fink, M., Hanke, W., Thomale, R. & Di Sante, D. Unconventional super- conductivity in a doped quantum spin Hall insulator.Phys. Rev. B100, 041117 (2019). R.
25. Pei, C. et al. Pressure-induced a partial disorder and superconductivity in quasi- one-dimensional Weyl semimetal (NbSe4)2I. Mater. Today Phys. 21, 100509 (2021).
26. Pei, C. et al. Pressure-induced topological and structural phase transitions in an antiferromagnetic topological insulator.Chin. Phys. Lett.37, 066401 (2020).
27. Qi, Y. et al. Superconductivity in Weyl semimetal candidate MoTe2.Nat. Commun.
7, 11038 (2016).
28. Kang, D. et al. Superconductivity emerging from a suppressed large magne- toresistant state in tungsten ditelluride.Nat. Commun.6, 7804 (2015).
29. Pan, X. C. et al. Pressure-driven dome-shaped superconductivity and electronic structural evolution in tungsten ditelluride.Nat. Commun.6, 7805 (2015).
30. Qi, Y. et al. Topological quantum phase transition and superconductivity induced by pressure in the bismuth tellurohalide BiTeI.Adv. Mater.29, 1605965 (2017).
31. Li, Y. et al. Concurrence of superconductivity and structure transition in Weyl semimetal TaP under pressure.npj Quantum Mater.2, 66 (2017).
32. Qi, Y. et al. Pressure induced superconductivity and topological quantum phase transitions in a quasi one dimensional topological insulator Bi4I4.npj Quantum Mater.3, 4 (2018).
33. Chi, Z. et al. Pressure-induced superconductivity in MoP.npj Quantum Mater.3, 28 (2018).
34. Cheng, E. et al. Pressure-induced superconductivity and topological phase tran- sitions in the topological nodal-line semimetal SrAs3.npj Quantum Mater.5, 38 (2020).
35. Werthamer, N. R., Helfand, E. & Hohenberg, P. C. Temperature and purity dependence of the superconducting criticalfield,Hc2. III. electron spin and spin- orbit effects.Phys. Rev.147, 295–302 (1966).
36. Larson, A. C. & Dreele, R. B. V. General Structure Analysis System (GSAS).Los Alamos National Laboratory Report LAUR86–748 (2004).
37. Longuinhos, R. et al. Raman spectrum of layered jacutingaite (Pt2HgSe3) crystals
—experimental and theoretical study.J. Raman Spectrosc.51, 357–365 (2019).
38. Wang, Y., Lv, J., Zhu, L. & Ma, Y. Crystal structure prediction via particle-swarm optimization.Phys. Rev. B82, 094116 (2010).
39. Wang, Y., Lv, J., Zhu, L. & Ma, Y. CALYPSO: a method for crystal structure pre- diction.Comput. Phys. Commun.183, 2063–2070 (2012).
40. Damle, A., Levitt, A. & Lin, L. Variational formulation for Wannier functions with entangled band structure.Multiscale Model. Simul.17, 167–191 (2019).
41. Vitale, V. et al. Automated high-throughput Wannierisation.npj Comput. Mater.6, 66 (2020).
42. Sancho, M. P. L., Sancho, J. M. L. & Rubio, J. Highly convergent schemes for the calculation of bulk and surface Green functions.J. Phys. F: Met. Phys.15, 851–858 (1985).
43. Vergniory, M. G. et al. A complete catalogue of high-quality topological materials.
Nature566, 480–485 (2019).
44. Qi, Y. et al. Pressure dirven superconductivity in the transition metal penta- telluride HfTe5.Phys. Rev. B94, 054517 (2016).
45. Mao, H. K., Xu, J. & Bell, P. M. Calibration of the ruby pressure gauge to 800 kbar under quasi-hydrostatic conditions.J. Geophys. Res.91, 4673–4676 (1986).
46. Hammersley, A. P., Svensson, S. O., Hanfland, M., Fitch, A. N. & Hausermann, D.
Two-dimensional detector software: from real detector to idealised image or two- theta scan.High. Press. Res.14, 235–248 (1996).
47. Toby, B. EXPGUI, a graphical user interface for GSAS.J. Appl. Crystallogr.34, 210–213 (2001).
48. Gao, B. et al. Interface structure prediction via CALYPSO method.Sci. Bull.64, 301–309 (2019).
49. Kresse, G. & Furthmüller, J. Efficient iterative schemes for ab initio total-energy calculations using a plane-wave basis set.Phys. Rev. B54, 11169–11186 (1996).
C. Pei et al.
7
50. Kresse, G. & Furthmuller, J. Efficienc of ab-initio total energy calculations for metals and semiconductors using a plane-wave basis set.Comput. Mater. Sci.6, 15–50 (1996).
51. Perdew, J. P., Burke, K. & Ernzerhof, M. Generalized gradient approximation made simple.Phys. Rev. Lett.77, 3865–3868 (1996).
52. Kresse, G. & Joubert, D. From ultrasoft pseudopotentials to the projector augmented-wave method.Phys. Rev. B59, 1758–1775 (1999).
53. Giannozzi, P. et al. QUANTUM ESPRESSO: a modular and open-source software project for quantum simulations of materials.J. Phys. Condens. Matter21, 395502 (2009).
ACKNOWLEDGEMENTS
We thank Prof. Yanming Ma for valuable discussions. This work was supported by the National Key R&D Program of China (Grant No. 2018YFA0704300 and 2017YFE0131300), the National Natural Science Foundation of China (Grant Nos. U1932217, 11974246, 11874263, 12004252, and 12074138), the Natural Science Foundation of Shanghai (Grant Nos. 19ZR1477300), and the Science and Technology Commission of Shanghai Municipality (19JC1413900). P. N.-I. acknowledges support from the Hungarian Academy of Sciences, Lendület Program, grant no. LP2017-9/2017. A. V. acknowledges the support from the Czech Geological Survey (DKRVO/CGS 2018–2022). The authors thank the support from Analytical Instrumentation Center (#SPST-AIC10112914), SPST, ShanghaiTech University. We thank the staffs from BL15U1 at Shanghai Synchrotron Radiation Facility, for assistance during data collection. We used the computing facility at the High-Performance Computing Centre of Jilin University.
AUTHOR CONTRIBUTIONS
Y.Q., G.L., H.L., and Y.C. conceived the project. C.P., L. G., Y.Z., W.C., and C.L. conducted the high-pressure transport, XRD, Raman studies, and data analysis. A.V. and P.N.-I.
grew the crystals; S.J. and G.L. did the topological properties calculations; P.H. and H.L. did the structural prediction calculations; all authors contributed to the discussion and writing of the paper.
COMPETING INTERESTS
The authors declare no competing interests.
ADDITIONAL INFORMATION
Supplementary informationThe online version contains supplementary material available athttps://doi.org/10.1038/s41535-021-00402-w.
Correspondenceand requests for materials should be addressed to Hanyu Liu, Gang Li or Yanpeng Qi.
Reprints and permission information is available at http://www.nature.com/
reprints
Publisher’s noteSpringer Nature remains neutral with regard to jurisdictional claims in published maps and institutional affiliations.
Open AccessThis article is licensed under a Creative Commons Attribution 4.0 International License, which permits use, sharing, adaptation, distribution and reproduction in any medium or format, as long as you give appropriate credit to the original author(s) and the source, provide a link to the Creative Commons license, and indicate if changes were made. The images or other third party material in this article are included in the article’s Creative Commons license, unless indicated otherwise in a credit line to the material. If material is not included in the article’s Creative Commons license and your intended use is not permitted by statutory regulation or exceeds the permitted use, you will need to obtain permission directly from the copyright holder. To view a copy of this license, visithttp://creativecommons.
org/licenses/by/4.0/.
© The Author(s) 2021
8