Examination of milling technological properties of different wheat varieties
ZOLT AN MAGYAR
1, ANTAL V EHA
2and BAL AZS P. SZAB O
2p1University of Debrecen, Kerpely Kalman Doctoral School, Hungary
2University of Szeged, Faculty of Engineering, Hungary
CONFERENCE FULL PAPER
Received: January 31, 2020 • Accepted: September 28, 2020 Published online: October 17, 2020
© 2020 The Author(s)
ABSTRACT
In milling industry, the object of milling is to separate endosperm and bran parts of wheat, and to recover flour. The most important and the highest energy requirement operation is grinding. The quantity and quality of flour depends on: the variety of wheat that will be milled, the type of grinding equipment and the condition used before the grinding. During our experiments two different grain structured varieties of wheat were milled in laboratory conditions with disk, stone grinder and roller miller in air-dry, and conditioned states. The performance of the equipment and the particle size distribution (PSD) of the produced grist were measured, then the energy requirements of the grinders were calculated. In the milling experiments the ash contents of the different particle sized fractions were compared to map particular properties of wheat cultivars.
KEYWORDS
wheat, milling, sieve analysis, particle size distribution
INTRODUCTION
Nowadays wheat has one of the highest economic values among the grain plants in Hungary (Horvath, 2014). It plays an indispensable role in our daily nutrition worldwide. Its processing
pCorresponding author. E-mail: szpb@mk.u-szeged.hu
extends to the animal feed as well, but its main role is in the milling and baking industry, as the basic raw material (Ragasits, 1998).
The grading based on kernel hardness is extremely important for milling and other industries as well. The most important and the highest energy-consuming operation is grinding. In milling technology, the degree of kernel hardness is proportional to the energy used for grinding, since the grinding of harder kernel requires far more energy than soft ones. The broken particles distribute differently in hard and soft cultivars (Galindez-Najera et al., 2016). In addition, the kernel hardness specifies the conditioning parameters, theflour particle size, the density, the starch damage rate and through this the flour water absorption ability and theflour extraction rate. Soft wheat cultivars usually give U-shape distribution, which means that the proportion of small and larger particles is large, and mid-size range is lower, meanwhile hard genotypes have more even distribution (Campbell et al., 2007). The industries are processing variousflours based on kernel hardness and protein content (Gaines et al., 1996). The hard endosperm structure is closely related to the high flour extraction rate, furthermore, the proportion of yields is higher of valuable fractions, besides the water absorption capacity being also higher. Hard varieties are used mainly by the baking industry, meanwhile, soft wheat is suitable for the brewing and confectionary industry (Rakszegi et al., 2000).
The typical composition of wheat is 82% endosperm, 8% pericarp, 7% aleurone, and 3% germ (Pomeranz, 1988). In the milling industry, the objective of grinding is to separate the endosperm and branpartsofwheatgrains,andtorecoverflour(Posner&Hibbs,1997).Fundamentallywecouldassume thatif the same grinder and parameters were usedflours with the same properties willbe obtained, but in practice it is affected by many factors (Fistes & Tanovic, 2006). The quantity and quality offlour depends on: the variety of wheat that will be milled, the type of grinding equipment and the conditioning used before the grinding.Hoseney (2010)highlighted that, even under the best conditions, the absolute separation of bran and endosperm is not achievable. With regard to requirements forfinal use, several types of grinder can be used: roller, disk, stone, and hammer mill (Farkas, 1977). The reason why mills use roller mill is the separating mechanism of breakage, where the endosperm fragments in small particles (100–200
m
m), the bran fragments in the large particles, like pericarp, and aleurone (2,000– 2,100m
m) (Fistes & Tanovic, 2006; Galindez-Najera et al., 2016). During our experiment two different grain structured varieties of wheat (soft and hard) were milled in laboratory conditions with disk, stone, and a roller grinder in air-dry and conditioned circumstances. The performance of equipment was measured from which the producedflour particlesize distribution (PSD) and the energy requirement of each grinder were calculated. The ash contents of the different particle sized grist fractions were compared to map particular properties of wheat cultivars. Typical ash content of bran is 6%, shorts 4%, patentflour 0.4% (Hoseney, 2010).MATERIALS AND METHODS
Our experimental materials were GK Bekes (hard, improver quality, A1-A2 class, early maturity, awned type) and GK Feny (soft, standard quality, A2-B1 class, early maturity, awnless type) cultivated by GabonaKutato Kft. (Szeged, Hungary).
The wheat samples were examined in two different moisture conditions: 11% (air-dry) and 15.5% moisture content (conditioned). The moisture content was defined according to MSZ 6367-3:1983 Hungarian standard. The needed amount of water was calculated with the following equitation:
76 Progress in Agricultural Engineering Sciences16 (2020) S1, 75–86
w¼m$ðn1n0Þ ð100n1Þ where:w–needed amount of water (cm3)
m–weight of wheat (g)
n1–moisture content to be achieved (%) n0–starting moisture content (%).
The conditioning was done for 16 h on 228C. The aim of conditioning is to bring wheat to an appropriate state for milling by achieving optimum level of moisture content, where the bran is toughened to reduce its powdering, the endosperm is turning looser and helping its reduction into flour. Usually soft wheat is conditioned to a lower moisture content, because it tends to turn too sticky and making it difficult to sift properly (Lovra-Szabolcski, 2011; Wrigley et al., 2016).
During the experiments disk, stone, and roller grinders were used. Asdisk grindera Perten 3303 laboratory equipment was used. The grinding operation takes place between a stationary and a rotating disk. In this equipment thefineness of the milling can be controlled by adjusting the space between the disks (Kacz, 2011). There are 6 different grades on its scale. Our mea- surement was performed at the lowest gap, “0” position. The most important technical pa- rameters of disk grinder: motor power 180 W, dial velocity 2,800 1/min and the dial diameter 75 mm. Thestone grinderwas a custom-made equipment and was designed primarily for exper- imental purposes. The grinding is made by grinding stones located on a horizontal axis. One stone is stationary, the second one is rotating. The most important technical parameters: motor power 1,500 W, dial velocity 735 1/min, diameter of dial is 250 mm. Theroller grinderwas a QC 109 type laboratory mill. In the device the wheat is moving along rollers, that rotate at different speeds. The gap between the rollers is factory-set, and cannot be changed, thus ensuring the stability of the parameters during the experiment. The most important technical parameters of roller grinder: motor power 480 W; rolls speed 980 1/min; roll velocity is 3.6 m/s; the diameter of rolls is 70 mm; the differential of the rolls is 2.4.
The power of the two-phase disk grinder was measured using Voltcraft Energy Logger 3,500 type electric power meter. The power of the three-phase stone and roller grinder was measured by Fluke 435 Series II Power Quality and Energy Analyzer. During the measurements the machines were run empty for the first minute to determine the power of empty run, and then the wheat samples were measured. During the empty and normal runs using the Voltcraft device, the power was recorded every 10 s, while the Fluke device saved automatically the data every 10 s. During the grinding the mass of the grist were measured three times with stopwatch to determine the mass flow.
One of the most common methods of classifying the particle size of flours is the sieve analysis. During this procedure upwardly rising sieves were used. The wheat materials were poured onto the top sieve, then the sieve column was subjected to a regular shake movement. At the end of the test the mass of the materials that remained on each sieve were weighed. Thus, the percentage of all materials can be determined. Also, the wheat material can be broken down into average particle size fractions. The sieve analysis was carried out using the Fritsch Analisette 3 type vibration sieve. The series of the sieves consisted of 12 pieces, and the dimensions were: 63, 100, 200, 250, 300, 400, 500, 600, 800, 1,250, 1,800, and 2,500
m
m. The name of fractions that are produced during milling:flour (130–250m
m), shorts (270–350m
m), grist (400–1,300m
m), andtransition (Lovra-Szabolcski, 2011). To prevent the clogging of the sieves four 20 mm diameter sized rubber balls were utilized. The sieves in empty state were measured. Then the sieve column was set up, and the 100 gflour was given. 1.5 mm amplitude and 10 min were set. After the procedure the sieves were measured, and the percentage of fractions was calculated. After the sieve analysis every fraction separately was collected. The moisture content was measured ac- cording to MSZ 6369-4:1987 Hungarian standard (130 8C, 2 h). The ash content was done according to MSZ 6369-3:1987 Hungarian standard (5508C, 6 h).
For processing the results of the measurements, R studio 3.6.1 version was used. For ar- ranging and filtering the data, dplyer package (Wickham et al., 2009) was utilized. One-way ANOVA with least significant difference (LSD) post-hoc tests on 0.05 significance level of agricolae package (Mendiburu, 2019) were used. For graphical representation Microsoft Excel 2016 was used.
RESULTS AND THEIR ASSESSMENTS
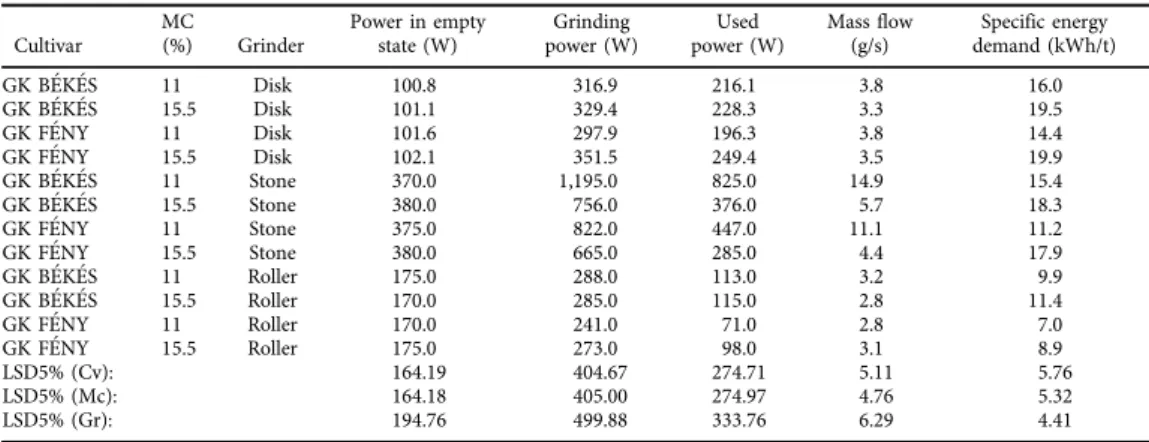
InTable 1the values of grinding can be seen, which were calculated from the main parameters.
Since we could not ensure the dosing stability of the massflow during the measurement, the energy values to the measured mass flows were compared. The specific energy demand of grinding in kWh/t is shown inFig. 1.
The stone grinder had significantly higher values of“power in empty state”(LSD5%: 194.76 W) and “grinding power” (LSD5%: 499.88 W) compared to the disk and roller grinders. The roller miller (9.3 kWh t1) had the smallest specific energy demand (LSD5%: 4.41 kWh t1), the disk grinder (17.45 kWh t1) had the highest, although there was no significant difference between the disk and the stone grinder (15.7 kWh t1). Also, the roller milling (99.25 W) had significantly lower value of “used power” (LSD5%: 333.76 W) compared to stone grinding (483.25 W). The conditioning increased appreciably the specific energy demand of grinding, but this amount was the smallest in the case of roller milling (Table 2).
Table 1.The characteristics of grindings
Cultivar
MC
(%) Grinder
Power in empty state (W)
Grinding power (W)
Used power (W)
Mass flow (g/s)
Specific energy demand (kWh/t)
GK BEKES 11 Disk 100.8 316.9 216.1 3.8 16.0
GK BEKES 15.5 Disk 101.1 329.4 228.3 3.3 19.5
GK FENY 11 Disk 101.6 297.9 196.3 3.8 14.4
GK FENY 15.5 Disk 102.1 351.5 249.4 3.5 19.9
GK BEKES 11 Stone 370.0 1,195.0 825.0 14.9 15.4
GK BEKES 15.5 Stone 380.0 756.0 376.0 5.7 18.3
GK FENY 11 Stone 375.0 822.0 447.0 11.1 11.2
GK FENY 15.5 Stone 380.0 665.0 285.0 4.4 17.9
GK BEKES 11 Roller 175.0 288.0 113.0 3.2 9.9
GK BEKES 15.5 Roller 170.0 285.0 115.0 2.8 11.4
GK FENY 11 Roller 170.0 241.0 71.0 2.8 7.0
GK FENY 15.5 Roller 175.0 273.0 98.0 3.1 8.9
LSD5% (Cv): 164.19 404.67 274.71 5.11 5.76
LSD5% (Mc): 164.18 405.00 274.97 4.76 5.32
LSD5% (Gr): 194.76 499.88 333.76 6.29 4.41
Abbreviations: cv5cultivar; mc5moisture content; gr5grinder; LSD5least significant difference.
78 Progress in Agricultural Engineering Sciences16 (2020) S1, 75–86
FromFig. 1it can be read at air-dry state (11%) that the specific energy demand of GK Bekes was higher compared to GK Feny, but due to conditioning (15.5%), this difference could only be experienced during roller milling.
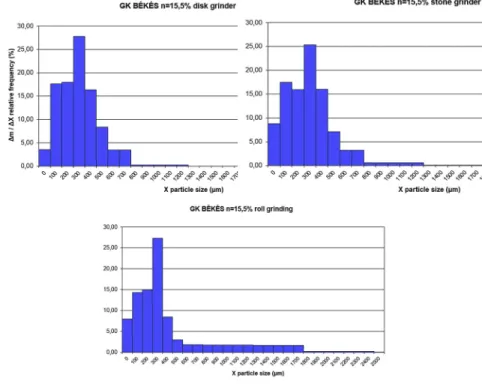
The results received from the histograms were used for describing the PSD, in such a way that the individual sieve residues were divided by the size differences of the following sieves. The relative frequency values thus obtained were depicted as a function of the particle size. The effect of 3 factors (wheat type, milling device, and conditioning) can be seen on the following 3 graphs (Figs. 2–4).
During the sieve analysis it could be observed that the hard type, GK Bekes had definite mode, while the soft type, GK Feny had bimodal distribution (Fig. 2). GK Feny produced a much larger quantity granule in the range of 100–200
m
m (flour), while GK Bekes produced most particles within the range of 300–400m
m (shorts). The soft variety, GK Feny produces much larger bran particles compared to the hard variety. This finding confirmed the conse- quences ofGalindez-Najera et al. (2016).Regarding the PSD (Fig. 3) it can be concluded that there was no difference in the modes of the grinders, but in the case of roller grinder the width of the distribution was greatly varying, more larger bran particles (1,300–1,800
m
m) were produced compared to the other two grinders.This shows the selective separating effect of the roller miller, the endosperm fragmented into smaller pieces, meanwhile the bran fragmented in larger pieces.
The conditioning effect on GK Bekes can be seen inFig. 4. It can be observed that the mode of the particle size did not change after conditioning on 15.5% moisture content, but less smaller particles (0–700
m
m) were obtained and the size range of large bran pieces increased (particles can be found even in the range of 1,525–2,500m
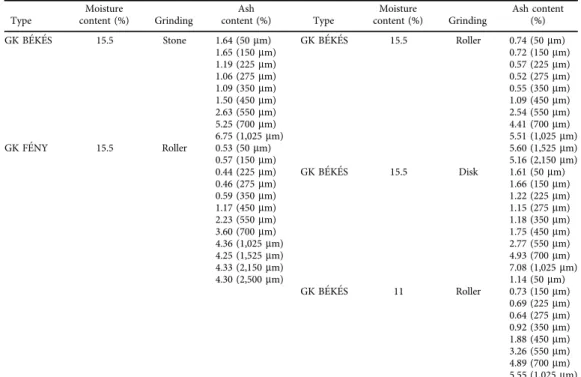
m). This proves that the separating charac- teristic increased after conditioning.In addition to the PSD we also wanted to know how many wheat bran and endosperm particles were presented in the different fractions, as the main aim of the milling technology is to separate them. Therefore, the ash content of the 12 size fractions were determined (Table 3).
InFig. 5the ash contents can be seen (mc515.5%, roller miller). The fractions of the soft wheat, GK Feny had lower ash contents, but we canfindflour in larger size ranges as well. This phenomenon refers to theflour-like fragmenting of soft cultivars, the larger particles areflat- tened while they are milled, and more endosperm parts can attach to them.
Fig. 1.Specific energy demand of grinders
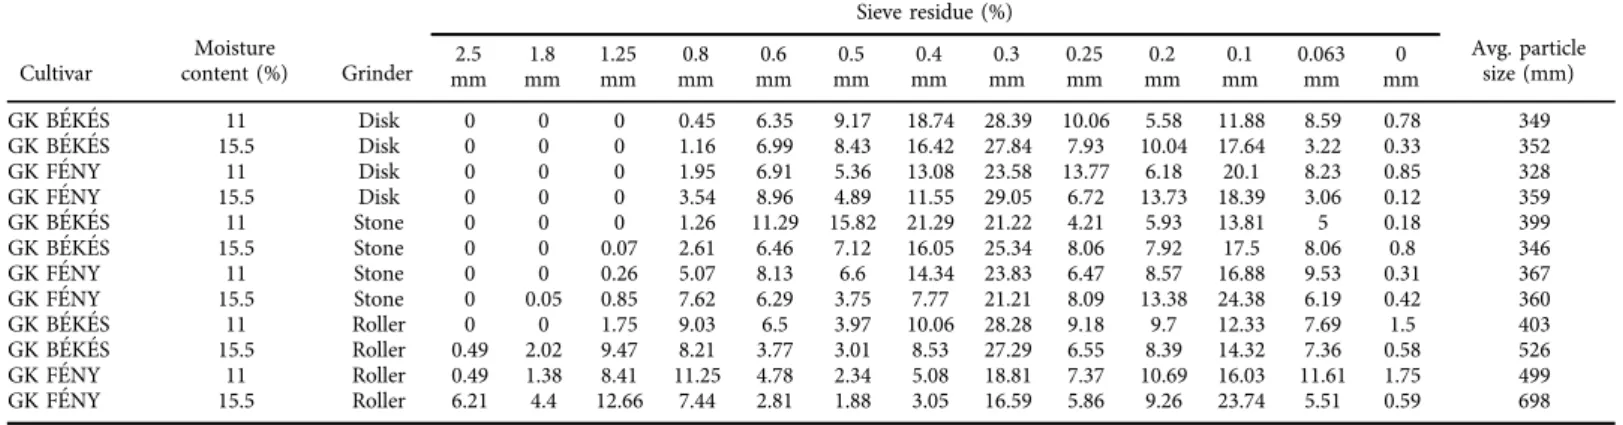
Table 2.The results of sieve analysis
Cultivar
Moisture
content (%) Grinder
Sieve residue (%)
Avg. particle size (mm)
2.5 1.8 1.25 0.8 0.6 0.5 0.4 0.3 0.25 0.2 0.1 0.063 0
mm mm mm mm mm mm mm mm mm mm mm mm mm
GK BEKES 11 Disk 0 0 0 0.45 6.35 9.17 18.74 28.39 10.06 5.58 11.88 8.59 0.78 349
GK BEKES 15.5 Disk 0 0 0 1.16 6.99 8.43 16.42 27.84 7.93 10.04 17.64 3.22 0.33 352
GK FENY 11 Disk 0 0 0 1.95 6.91 5.36 13.08 23.58 13.77 6.18 20.1 8.23 0.85 328
GK FENY 15.5 Disk 0 0 0 3.54 8.96 4.89 11.55 29.05 6.72 13.73 18.39 3.06 0.12 359
GK BEKES 11 Stone 0 0 0 1.26 11.29 15.82 21.29 21.22 4.21 5.93 13.81 5 0.18 399
GK BEKES 15.5 Stone 0 0 0.07 2.61 6.46 7.12 16.05 25.34 8.06 7.92 17.5 8.06 0.8 346
GK FENY 11 Stone 0 0 0.26 5.07 8.13 6.6 14.34 23.83 6.47 8.57 16.88 9.53 0.31 367
GK FENY 15.5 Stone 0 0.05 0.85 7.62 6.29 3.75 7.77 21.21 8.09 13.38 24.38 6.19 0.42 360
GK BEKES 11 Roller 0 0 1.75 9.03 6.5 3.97 10.06 28.28 9.18 9.7 12.33 7.69 1.5 403
GK BEKES 15.5 Roller 0.49 2.02 9.47 8.21 3.77 3.01 8.53 27.29 6.55 8.39 14.32 7.36 0.58 526
GK FENY 11 Roller 0.49 1.38 8.41 11.25 4.78 2.34 5.08 18.81 7.37 10.69 16.03 11.61 1.75 499
GK FENY 15.5 Roller 6.21 4.4 12.66 7.44 2.81 1.88 3.05 16.59 5.86 9.26 23.74 5.51 0.59 698
80ProgressinAgriculturalEngineeringSciences16(2020)S1,75–86
Fig.2.PSDofGKBekescv.andGKFenycv.(mc515.5%;rollermiller)
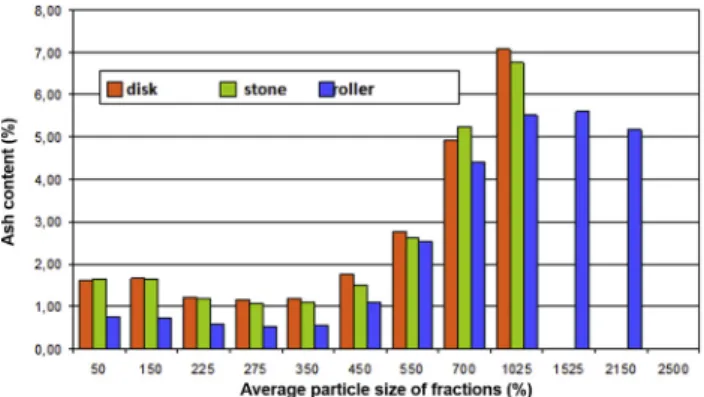
The ash content of the fractions produced by each grinder are shown inFig. 6. There was no serious difference between the ash content of the disk and stone grinder. The separating charac- teristic of roller grinder shows up greatly here as well. Theflours that were produced were much whiter and rich in endosperm parts. The parts that contain high ash content bran are bigger, but more endosperm parts are attaching to them, therefore they have a lower ash content.
Fig. 3.PSD of disk, stone and roller grinding on mc515.5% (GK Bekes cv.)
Fig. 4.PSD at 11 and 15.5% moisture content (roller miller, GK Bekes cv.)
82 Progress in Agricultural Engineering Sciences16 (2020) S1, 75–86
The effect of conditioning can be seen inFig. 7. It can be concluded that the wetter the grist fractions (conditioning) the lower the ash content was.
The differences of ash contents can be seen clearly in the fractions (Fig. 8, left picture).
Examining the GK Bekes with roller grinder, it can be seen that after the conditioning, theflours were whiter and the range of size was increased, so the separating character as well. The separating characteristics of the grinders are presented inFig. 8(right picture). Considering the
Table 3.Ash content of sieve fractions
Type
Moisture
content (%) Grinding
Ash
content (%) Type
Moisture
content (%) Grinding
Ash content (%)
GK BEKES 15.5 Stone 1.64 (50mm) GK BEKES 15.5 Roller 0.74 (50mm)
1.65 (150mm) 0.72 (150mm)
1.19 (225mm) 0.57 (225mm)
1.06 (275mm) 0.52 (275mm)
1.09 (350mm) 0.55 (350mm)
1.50 (450mm) 1.09 (450mm)
2.63 (550mm) 2.54 (550mm)
5.25 (700mm) 4.41 (700mm)
6.75 (1,025mm) 5.51 (1,025mm)
GK FENY 15.5 Roller 0.53 (50mm) 5.60 (1,525mm)
0.57 (150mm) 5.16 (2,150mm)
0.44 (225mm) GK BEKES 15.5 Disk 1.61 (50mm)
0.46 (275mm) 1.66 (150mm)
0.59 (350mm) 1.22 (225mm)
1.17 (450mm) 1.15 (275mm)
2.23 (550mm) 1.18 (350mm)
3.60 (700mm) 1.75 (450mm)
4.36 (1,025mm) 2.77 (550mm)
4.25 (1,525mm) 4.93 (700mm)
4.33 (2,150mm) 7.08 (1,025mm)
4.30 (2,500mm) 1.14 (50mm)
GK BEKES 11 Roller 0.73 (150mm)
0.69 (225mm) 0.64 (275mm) 0.92 (350mm) 1.88 (450mm) 3.26 (550mm) 4.89 (700mm) 5.55 (1,025mm) 5.59 (1,525mm)
Fig. 5.Ash content of fractions (mc515.5%, roller milling)
Fig. 6.The ash content of fractions (GK Bekes cv., mc515.5%)
Fig. 7.The ash content of fractions (GK Bekes cv., roller grinder)
Fig. 8.Fractions of GK Bekes, 11 and 15.5% moisture content (roller miller) (left); Stone, disk and roller grinder (GK Bekes cv.,n515.5%) (right)
84 Progress in Agricultural Engineering Sciences16 (2020) S1, 75–86
roller milling, the size of the range increased and the grains are lighter in smaller ranges (fraction 3–8).
CONCLUSIONS
Summarizing our results it can be stated that the grinding device, along with the cultivar and the conditioning had serious effect on the milling and the parameters of the produced grists, like PSD and ash content. The roller miller was the best equipment, because it had the most favorable specific energy demand, separating characteristics and widest PSD. Conditioning increased the specific energy demand in all cases, however, this difference was the modest during the roller milling. On the basis of the results of sieve analysis, GK Bekes (hard) had a definite mode, whereas GK Feny (soft) had bimodal, and much wider distribution. After conditioning the mode of GK Bekes (roller miller) did not change, but particles can be found even in the range of 1,525–2,500
m
m. Conditioning the samples on 15.5% moisture content, the average size distribution did not vary in the case of disk and stone grinder. This experiment helps to well understand the different grinding methods to achieve the fundamental aim, to ensure and maintain consistent, good qualityflour, bran, and whole-wheat flour for users in spite of the global wheat market trends, like variability of raw material.REFERENCES
Campbell, G.M., Fang, C., and Muhamad, I.I. (2007). Effect of kernel hardness and shape on the particle size distribution fromfirst break milling of wheat.Food and Bioproducts Processing, 85: 7–23.
Farkas, J. (1977).Malomipari anyagismeret es az }orles m}uveletei. Mez}ogazdasagi Kiado, Budapest. (in Hungarian).
Fistes, A. and Tanovic, G. (2006). Predicting the size and compositional distributions of wheatflour stocks followingfirst break roller milling using the breakage matrix approach.Journal of Food Engineering, 75:
527–534.
Gaines, C.S., Finney, P.F., Fleege, L.M., and Andrew L.C. (1996). Predicting a hardness measurement using the single kernel characterisation system.Cereal Chemistry, 73(2): 278–283.
Galindez-Najera, S.P., Choomjaihan, P., Barron, C., Lullien-Pellerin, V., and Campbell, G.M. (2016). A compositional breakage equation for wheat milling.Journal of Food Engineering, 182: 46–64.
Horvath, Cs. (2014). Storage proteins in wheat (Triticum aestivumL.) and the ecological impacts affecting their quality and quantity, with a focus on nitrogen supply.Columella, 1(2), 57–76.
Hoseney, R.C. (2010).Principles of cereal science and technology. 3rd ed. AACC,pp. 110–118.
Kacz, K. (2011).Allattart as m}uszaki ismeretei, Debreceni Egyetem, Nyugat-Magyarorszagi Egyetem, Pannon Egyetem (in Hungarian).
Lovra-Szabolcski, I. (2011).Malomipari technologia, Topolya, pp. 45–56. (in Hungarian).
Mendiburu, F.D. (2019). Agricolae: Statistical procedures for agricultural research. R Package v. 1.3-1.
Pomeranz, Y. (1988).Wheat chemistry and technology II. 3rd ed. American Association of Cereal Chemists, St Paul, MN, USA, pp. 285–328.
Posner, E.S. and Hibbs, A.N. (1997).Wheatflour milling. American Association of Cereal Chemists, MN.
Ragasits, I. (1998).Buzatermesztes. Mez}ogazda Kiado, Budapest, pp. 19–140. (in Hungarian).
Rakszegi, M., Juhasz, A., Lang, L., and Bed}o Z. (2000). Elter}o endospermium szerkezet}u buzafajtak reologiai tulajdonsagainak vizsgalata,N€ovenytermeles49, 599–606. (in Hungarian).
Wickham, H., François, R., Henry, L., and M€uller, K. (2009). DPLYR: A grammar of data manipulation. R Package v. 0.8.3.
Wrigley, C., Corke, H., Seetharaman, K., and Faubion, J. (2016). Encyclopedia of food grains, 2nd ed.The World of Food Grains, Academic Press, Oxford.
Open Access.This is an open-access article distributed under the terms of the Creative Commons Attribution 4.0 International License (https://creativecommons.org/licenses/by/4.0/), which permits unrestricted use, distribution, and reproduction in any medium, provided the original author and source are credited, a link to the CC License is provided, and changes–if any–are indicated. (SID_1)
86 Progress in Agricultural Engineering Sciences16 (2020) S1, 75–86