DOI: 10.1556/606.2018.13.1.4 Vol. 13, No. 1, pp. 45–56 (2018) www.akademiai.com
LOW FREQUENCY NOISE EMISSION OF SINGLE PHASE RECTIFIERS BUILT IN ELECTRONIC
LIGHTING LAMPS
Róbert ISTÓK
Power System Department, Kálmán Kandó Faculty of Electrical Engineering Óbuda University, Alternative Energy Source Knowledge Center, Bécsi út 94-96/a
1034, Budapest, Hungary, e-mail: istok.robert@kvk.uni-obuda.hu
Received 2 April 2017; accepted 17 July 2017
Abstract: The electronic devices, which contain single phase rectifiers, have significant harmonics emissions. Modern lamps are driving by electronic ballast, which contains single phase rectifiers. The modern lamps are nonlinear loads and introduce harmonic distortions in power supply lines. In conformity with standard requirements the emission measurements are done for a single lamp during the validation process. In real life more than one lamp is used at the same time in a system. Measurement of more modern lamps in a circuit shows that the harmonics emission in their case is lower than in the case of one lamp.
Keywords: Harmonic emission, Compact fluorescent lamps, Induction lamps, Total harmonic emission, Electromagnetic compatibility, Power factor
1. Introduction
The increased usage of modern lighting lamps produces increased electromagnetic emissions. From the frequency point of view the conducted electromagnetic emissions are divided into two groups: low frequency emissions and high frequency emissions.
The low frequency conducted emissions are noise emissions up to 9 kHz. The high frequency conducted emissions are noise emissions between 9 kHz-30 MHz. The electromagnetic fields could be calculated based on Finite Element Method (FEM) [1].
Replacements of incandescent lamps in a house are doing gradually; when an old lamp is burnt out it is replaced with a modern lamp: compact fluorescent lamp, induction lamp or Light Emission Diode (LED) lamp. In other cases, for different reasons different types of lamps are used in a house, for example night lamps and reading lamps
2. Harmonic and total harmonic distortion
If a non-linear load is connected to the power system, it draws a current that is not sinusoidal. The current waveform can become quite complex, depending on the type of load and its interaction with other components of the system. The current waveform is described with the help of Fourier series analysis [3]. It is divided into a series of simple sinusoids, which start at the power system fundamental frequency and occur at integer multiples of the fundamental frequency.
The voltage from power source is distorted by current harmonics due to source impedance. If the voltage source has small source impedance, the current harmonics will cause only small voltage harmonics. This is the case when voltage harmonics are small compared to current harmonics. It is typically for lighting electronic ballast.
Total Harmonic Distortion (THD) is a measurement of the level of harmonic distortion present in power systems. Total harmonic distortion can be related to either current harmonics or voltage harmonics, and it is defined as the ratio of total harmonics to the value at fundamental frequency times 100% [4].
% 100
% 100
1 2
2
1
2 2
3 2
2 ⋅
¦
= + ⋅
+
= + =
V V V
V V
V THD
n
k k
n V
, (1)
% 100
% 100
1 2
2
1 2 2
3 2
2 ⋅
¦
= + ⋅
+
= + =
I I I
I I
I THD
n
k k
n I
, (2)
where Vk is the RMS voltage of k-th voltage harmonic; Ik is the RMS current of the k-th current harmonic; k=1 is the fundamental frequency.
3. Effects of harmonics
Motors and generators
The voltage and current harmonics in motors and generators increase heating due to iron and cooper losses at the harmonic frequencies, and affects the efficiency and
developed torque as well. The harmonic currents in a motor can raise the audible noise emission, and produce a resultant flux distribution in the air gap. The fifth and seventh harmonics can create mechanical oscillation in a turbine-generator combination or in a motor load system.
Transformers
Current harmonics cause an increase in cooper losses and stray flux losses. Voltage harmonics cause an increase in iron losses. The result is transformer heating increases.
The losses increase with frequency. The higher frequency harmonic components are more important than the lower frequency component. Another effect of harmonics is increasing audible noises.
Power cables
If cables take part in a resonance system, the cables could be affected by voltage stress and corona, which can produce dielectric failure.
Capacitors
The reactance of a capacitor bank decreases with frequency, and the bank acts as a sink for higher harmonic currents. This effect increases the heating and dielectric stresses
.
Electronic equipment
Electronic devices, which are sensitive to the zero-crossing point of the voltage waveform, can be affected by harmonic distortion. Harmonics can shift the voltage zero crossing or the point at which one phase-to-phase voltage becomes greater than another phase-to-phase voltage.
Other types of electronic devices can be affected by transmission of ac supply harmonics through the equipment power supply or by magnetic coupling of harmonics, which can produce malfunctions of device. The harmonic voltage distortion factor has to be no more than 5% and the largest single harmonic no more than 3% [5].
4. Measurement system
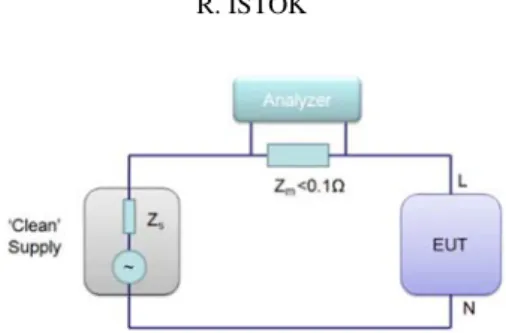
IEC 61000-3-2 is the standard, which describes the harmonic measurements method for lighting equipment. The measurement system is presented in Fig 1.
The power supply of the measurement system has to be a ‘clean supply’ with a stable voltage, frequency and poor harmonic emission.
The voltage of power supply has to be the same as the rated voltage of the device under test. In the case of 220-240 V voltage range, the test voltage has to be 230 V. The variation of test voltage has to be within ±2.0% and the frequency within ±0.5% of the nominal value.
Fig. 1.Harmonic emission measurement system The harmonic emissions must not exceeded the next values.
• 0.9 % for harmonic of order 3;
• 0.4 % for harmonic of order 5;
• 0.3 % for harmonic of order 7;
• 0.2 % for harmonic of order 9;
• 0.2 % for even harmonics of order from 2 to 10;
• 0.1 % for harmonics of order from 11 to 40.
The peak value of the test voltage shall be within 1.40 and 1.42 times its RMS value and shall be reached within 87° to 93° after the zero crossing [6]. The Equipment Under Test (EUT) in this case is a lighting lamp.
5. Low frequency noise emission
The standards, which refer to harmonic emission, require measurements of only one device, but what is happening when the devices are working in a network. One idea is that the increase of the number of the lamps results in noise emission increase. In Fig. 2 the typical circuit diagram of electronic ballast is presented. The AC line input voltage, typically 220-240 VAC 50/60 Hz, an EMI filter to block the noise emission, a rectifier with smoothing capacitor, a half-bridge inverter for DC to AC conversion, and the resonant circuit to ignite and run the lamp. The main source of low frequency harmonics is the rectifier stage [7].
Fig. 2.Circuit diagram of electronic ballast
In Fig. 3 the voltage and current wave form of a 11 W compact fluorescent lamp is presented. The measurement result of 23 W induction lamps is presented in Fig. 4. In
both cases the current consumption is not sinusoidal, which means that the harmonic current emission is high. The amount of harmonic emission is higher if the current waveform starts to increase later than voltage wave form. Important is that current has to start flowing before 60° [6]. From measurement results it can be seen (Fig. 3 and Fig. 4) that the harmonic emission of induction compact fluorescent lamp is higher than the emission of compact fluorescent lamp.
Fig 3. Voltage and current wave form of a compact fluorescent lamp
Fig 4. Voltage and current wave form of an induction lamp
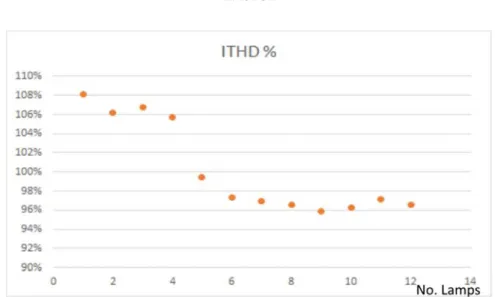
In Fig. 5 the results of the total harmonic distortion measurements for different number of 11 W 230 V compact fluorescent lamps are presented.
Fig. 5. THD emission for different number of compact fluorescent lamps
The measurements setup used short power supply cables. The reason is the impedance of power supply cable, which could modify the measurements result. If the length of the power cable is increased, then the inductance and the capacitance of the cable will be also increased. A higher inductance and capacitance of the power cable could result in harmonic emission attenuation [8].
Starting from measurement results, a higher number of compact fluorescent lamps do not result in a higher emission of current total harmonics distortion. On the contrary a higher number of lamps determine a cancellation effect of the system [9], [10]. After 6 lamps the current’s total harmonics distortion emission is not changed significantly.
This measurement results show that the compact fluorescent lamps in a higher number have a lower current total harmonic distortion emission than in case of one lamp. The voltage total harmonic emission is between 1%-3%.
Fig. 6 shows the measurement results for Power Factor (PF). From load point of view the electronic ballast is a capacitive load. In case of higher number of lamps, the capacitive characteristic of load decreases whiles the inductance increases. The power factor increases with the increase the number of the lamps. The power factor and the current total harmonic distortion are not changed significantly if the number of lamps increases over 6 lamps.
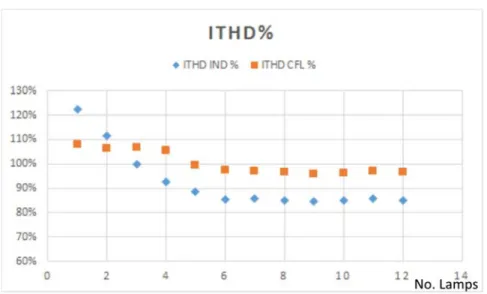
Induction lamp is a gas discharge lamp in which the power is transferred to the gas via an electromagnetic field. The major advantage of this lamp type is the missing of electrodes, which are the parts that are the most susceptible to failure in traditional fluorescent lamps. In Fig. 7 the current total harmonic emission measurement results is presented for different numbers 23 W, 230 V induction lamps. For comparison in the diagram the current total harmonic is presented for compact fluorescent lamp as well.
The total power consumption was the same for induction and compact lamps. The decrease of the current harmonics emission of induction lamps is more accentuated than
in case of compact fluorescent lamps. One reason for that a higher inductivity of the circuit in case of induction lamps.
Fig. 6. Power factor of compact fluorescent lamps
Fig. 7.Current total harmonic emissions of induction and compact fluorescent lamps The measurement result for power factor of different number of induction lamps is presented in Fig 8. The situation is the same as after 6 lamps the power factor does not increase.
Fig 8.Power factor of induction and compact fluorescent lamps
In the case when not only modern lamps are used, but an incandescent lamp too, the measurement results are show a significant change.
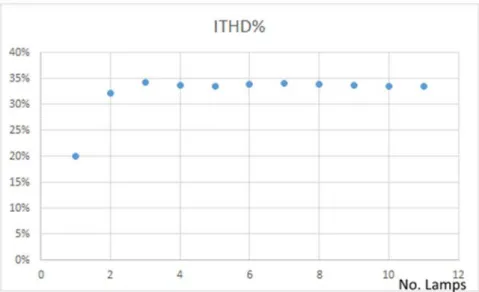
In Fig. 9 the measurement results for a lamp network can be seen, where one incandescent lamp and different number of compact fluorescent lamps were used.
Fig. 9.One incandescent lamp and different number of CFL lamps
The measurement results present a very low current total harmonic distortion. In case of compact fluorescent lamps measurement the increasing number of lamps determined a cancelation effect. In this case the total harmonic distortion of current increases. The explanation is coming from the total harmonic distortion calculation formula.
The incandescent lamp does not have harmonic emission, but the base harmonic is much higher than the harmonics emission of the compact fluorescent lamps.
This is the reason why the level of measurement result is lower in comparison to the measurement results of the compact fluorescent lamps. The power factor in this case is near one.
In Table I different configuration of lamps, their total harmonic distortion, and power factor measurement results are presented.
Table I
Different lamp combination emission No. of lamps ITHD % PF 2 Induction+2CFL 82.4 0.703 3 Induction+2CFL 85.1 0.7 1 Induction+4CFL 88.9 0.681
16 W LED 16.4 0.955
15 W LED 140 0.552
A higher number of induction lamps produce a slight emission increase because the harmonic emission of induction lamps is higher than that of the compact fluorescent lamps. In the third case when only one induction lamp is in measured circuit the emission is higher, because the inductivity of the circuit is lower.
Typically the power factors of expensive lamps are much higher than those of the cheaper ones [11], [12]. The reason is that the expensive lamps have an active power factor correction. In Fig. 10 the measurement result of a 16 W LED lamp with a better factor correction is presented. The THD is 16.4% and the power factor is 0.95
In Fig. 11 the measurement results of a 15 W LED lamp with a lower quality power correction factor circuit are presented. The THD is 140% and power factor is 0.552.
When the wave form of load current is different from sinus shape, it means that the load will have a current harmonic emission. In Fig. 10 the current waveform of LED lamp is almost sinusoidal, which means that the LED lamp has less harmonics emissions. In Fig. 11 the current wave has a spike form and is like in the case of the compact fluorescent lamps, which means a higher harmonic emission than in the case of the LED lamp from Fig. 10.
6. Power factor correction in non-linear loads
Passive PF correction
One method for harmonic current control is to use passive filters, which pass only the line frequency 50 Hz. Typically the filter includes capacitors and inductors. The
Fig. 10. Voltage and current wave form of LED lamp with better power factor correction
Fig. 11. Voltage and current wave form of LED lamp with lower quality power factor correction
Active PF correction
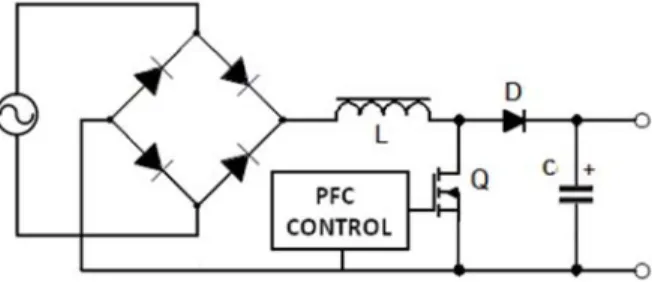
The current drawn by a load is changed by active Power Factor Correction (PFC) to improve the power factor. In case of electronic ballast, a boost converter is inserted between the AC/DC rectifier and the input capacitors. The boost converter tries to maintain a constant DC bus voltage on the output while it draws a current that is always
in phase with it and at the same frequency as the line voltage. A switched-mode converter produces the desired output voltage from the DC bus. This method requires more semiconductor components and control electronics Fig. 12, [13].
Fig. 12.Active PFC control
7. Conclusion
Electronic devices, which contain single phase rectifiers, have significant harmonics emission. Increasing the number of consumer’s, in this case modern lamps, they do not produce an increase of harmonic emissions. On the contrary a reduction of harmonic emission appears. Various types of lamps have a different reduction amount than other type of lamps. In the case when an incandescent lamp is in measured circuit, the result of total harmonic distortion could be misunderstood. The amount of total harmonic distortion is very low. This phenomenon does not mean that the incandescent lamp works as a good filter. Starts from equation of total harmonic distortion the first harmonic of incandescent lamp from denominator is very high in comparison to the harmonics of modern lamps. Typically LED lamps have lower harmonic emission, but this idea is not true for every situation.
References
[1] Tevan Gy. Quasi steady-state harmonic model of an infinite conductor plate pair, Pollack Periodica, Vol. 10, No. 3, 2015, pp. 43–58.
[2] Nassif A. B., Acharya J. An investigation on the harmonic attenuation effect of modern compact fluorescent lamps, 13th International Conference on Harmonics and Quality of Power, Wollongong, Australia, 28 September-1 October 2008, pp. 16.
[3] Abagiu S., Lepadat I., Helerea E., Mihai C. Assesment of voltage quality indicators in unbalanced and harmonic distorted regime, Pollack Periodica, Vol. 11, No. 1, 2016, pp. 67–79.
[4] Domagk M., Zyabkina O., Meyer J., Schegner P. Trend identification in power quality measurements, 2015 Australasian Universities Power Engineering Conference, Wollongong, Australia 27-30 September 2015, pp. 16.
[5] IEEE Std 519-1992, IEEE recommended practices and requirements for harmonic control in electrical power systems, 2014.
[6] IEC 61000-3-2:2014, Electromagnetic compatibility (EMC) - Part 3-2, Limits for harmonic current emissions (equipment input current 16 A per phase), 2014.
Electricity Distribution, Frankfurt, Germany, 6-9 June 2011, paper 0755.
[10] Gil-de-Castro A., Rönnberg S., Bollen M. H. J., Moreno-Muñoz A., Pallares-Lopez V.
Harmonics from a domestic customer with different lamp technologies, 2012 IEEE 15th International Conference on Harmonics and Quality of Power , Hong Kong, 17-20 June 2012, pp. 585–590.
[11] Rönnberg S. K., Wahlberg M., Bollen M. H. J. Harmonic emission before and after changing to LED lamps, - Field measurements for an urban area, 2012 IEEE 15th International Conference on Harmonics and Quality of Power, Hong Kong, China, 17-20 June 2012, pp. 552557.
[12] Lenk R., Lenk C. Practical Lighting Design with LEDs, Second Edition, John Wiley &
Sons, 2017.
[13] Power Factor Correction (PFC) basics, Fairchild Semiconductor, 2004, Application note, 42047.