Full Terms & Conditions of access and use can be found at
https://www.tandfonline.com/action/journalInformation?journalCode=ciai20
ISSN: 1366-2716 (Print) 1469-8390 (Online) Journal homepage: https://www.tandfonline.com/loi/ciai20
Overlap in external technology search locations and the breadth of IPR assets: lessons from the Security Software Industry
Szabolcs Szilárd Sebrek
To cite this article: Szabolcs Szilárd Sebrek (2020) Overlap in external technology search locations and the breadth of IPR assets: lessons from the Security Software Industry, Industry and Innovation, 27:1-2, 105-133, DOI: 10.1080/13662716.2019.1588710
To link to this article: https://doi.org/10.1080/13662716.2019.1588710
© 2019 The Author(s). Published by Informa UK Limited, trading as Taylor & Francis Group.
Published online: 16 Mar 2019.
Submit your article to this journal
Article views: 465
View related articles
View Crossmark data
Citing articles: 1 View citing articles
ARTICLE
Overlap in external technology search locations and the breadth of IPR assets: lessons from the Security Software Industry
Szabolcs Szilárd Sebrek
Department of Business Studies, Institute of Business Economics, Corvinus Business School, Budapest, Hungary
ABSTRACT
This study examines the effect of intellectual property rights (IPR) on firms’ geographic overlap strategy of external technology search (ETS) compared to rivals. I reveal thatfirms are able to realise less intensity of geographic overlap in ETS locations compared to com- petitors and that this outcome is a function of the breadth of their upstream (generality of patents) and downstream (diversification of trademarks) IPR tools. Accordingly, I conclude that both covariates influence the spatial isolation of ETS vis-à-vis competitors. The effect of generality of patents on isolation, however, is more pronounced in comparison with diversification of trademarks at strategic technology alliances, meanwhile the reverse scenario is true at acquisitions. I also reveal relevantfindings about resource-rich organisations defined as those with the broadest portfolio of such up- and downstream IPR assets within the industry.
KEYWORDS Open innovation;
geographic overlap; patents and trademarks; security software
1. Introduction
Past literature on open innovation highlights the imperative role of knowledge and technology seeking forfirms (Kim and Kogut1996; Rosenkopf and Nerkar 2001). Such organisational behaviour that aims to source externally generated knowledge is more pronounced if the focal industry undergoes a rapid technological change (Chung and Alcácer2002), and if technology development exhibits a clear pattern for complexity due to technological interdependencies (Dodgson 1989). Prior research indicates a strong correspondence between external technology search (ETS) and geography owing to the significant variation in innovative activity that can take place across regions within the same country (Almeida and Kogut1999; Saxenian1994), and to the specific factors that can be tapped at distinct locations (Cantwell 1989). Such crucial external factors can even be accessed from resource-poorfirms if they are located in resource-rich areas that promote investment in technology innovation (Forman, Goldfarb, and Greenstein2008).
At the same time, however, there exists another argument that can trigger a geographically isolated realisation of ETS from rival entities. As knowledge spillovers can be captured from geographically proximate competitors (Jaffe, Trajtenberg, and Henderson 1993), a defensive argument concentrates on firms’ interest in protecting
CONTACTSzabolcs Szilárd Sebrek sebrek@uni-corvinus.hu Department of Business Studies, Institute of Business Economics, Corvinus Business School, Fővám tér 8, Budapest, Hungary
2020, VOL. 27, NOS. 1–2, 105–133
https://doi.org/10.1080/13662716.2019.1588710
© 2019 The Author(s). Published by Informa UK Limited, trading as Taylor & Francis Group.
This is an Open Access article distributed under the terms of the Creative Commons Attribution-NonCommercial-NoDerivatives License (http://creativecommons.org/licenses/by-nc-nd/4.0/), which permits non-commercial re-use, distribution, and reproduction in any medium, provided the original work is properly cited, and is not altered, transformed, or built upon in any way.
their own technological knowledge from rivals by a means of locating apart and avoiding geographic clustering (Shaver and Flyer 2000). As a matter of fact, studies recognise thatfirms can perceive the balance of knowledge in- and outflows (Cassiman and Veugelers2002), and corresponding to possible knowledge spillover benefits, they can actively shape location strategies to preserve or augment their technical capabilities vis-à-vis rivals in the industry (Alcácer and Chung2007).
Drawn from prior literature,firms can correspondingly notice the importance of ETS for their competitiveness, the manner by which relevant technology is spatially dis- persed, and the limited number of locations where technology is presumably accessible.
Furthermore, firms can discern the relevance of self-defence against non-deliberate knowledge outflows during their explorative undertakings. The central topic of this article is to merge geography and active location strategies, which has remained scant until now in the received openness literature. Thus, thefirst question is: Can we observe the strategic value of location choices in ETS and any corresponding patterns in varying intensity of geographic overlap? This raises the second question: What drives the intensity of geographic overlap in open innovation activities betweenfirms?
In this paper, I explore these issues through distinguishingfirms’relative resources in intellectual property rights (IPR) at upstream and downstream levels. Consequently, I resort to patents and trademarks as both are quintessential technological and marketing resources, respectively (Zhou et al.2016), that can enhance the competitive advantage of the firm due to being nonsubstitutable and costly to imitate (Barney1991; Castanias and Helfat 1991). Further still, such assets can advantageously influencefirms’ability to adapt and to exploit new opportunities (Tripsas1997; King and Tucci2002). This standpoint is based on the breadth of these protected assets, captured by the generality of patents and the diversification of trademarks, which influences the firm’s competitive position in ETS associated with open innovation compared to its within-industry rivals.
In this context, I formulate the following three research hypotheses: 1. (2.) Firms with more general (diversified) stock of patents (trademarks) are more likely to have less intensity of geographic overlap in external technology search locations compared to rivals; 3. Resource-richfirms that achieve parity and score high either on the generality of patent or on the diversification of trademark, are more likely to have high intensity of geographic overlap in ETS locations with each other, conditioned by multiple contacts in the market niches of the focal industry.
I empirically test these propositions on a unique dataset that is built upon the worldwide Security Software Industry (SSI). The practise of external technology search in SSI is a widespread activity because (i) it is a technology-based industry with enhanced product innovation, (ii) competition is fierce implied by low entry barriers and a high hazard rate offirm exit, (iii) new lucrative product categories proliferate, and (iv) the design of a security software system is a complex undertaking (Giarratana2004;
Giarratana and Fosfuri2007; Fosfuri, Giarratana, and Sebrek 2018).
Two distinct mechanisms of ETS are examined: acquisitions and strategic technology alliances that correspond to acquiring and sourcing – two crucial inbound processes defined by Dahlander and Gann (2010). To this end, I assembled a comprehensive dataset of three years between 2000 and 2002. As the hypothesised relationships are inherently dyadic, I built up the sample of dyadic pairs of firms for which I incorporated 57 (51) security softwarefirms in the sample on strategic technology alliances (acquisitions) that
performed at least two ETS in the study period. I use the quadratic assignment procedure that permits me to analyse the sampledfirms’geographic dispersion of ETS in a dyadic fashion. To study the hypothesised links with more precision, following Alcácer (2006) I apply three units of geographical classification: clusters, countries and economic regions.
My empirical results suggest that both IPR-based core covariates–patent generality and trademark diversification–support a lower extent of geographic overlap in external technology search compared to rivals. However, they play different roles depending on the type of the search activity, as trademarks support such an isolation process more than patents at acquisitions, while for patents the reverse case holds regarding strategic technology alliances. Other interestingfindings are linked to resource-richfirms whose operationalisation was done separately both for patents and trademarks. The results imply that a high intensity of spatial overlap vis-à-vis similar research-rich competitors is achieved, only if bothfirms exhibit multimarket contact in the niches of the industry in question. The results associated with strategic technology alliances reveal that the significance of this effect depends on the level of geographic gradation applied.
This work links together several branches in the literature, such as openness of external technology search and the geographic component offirm strategy. I was able to demonstrate the strategic value of location choices where firms’breadth of upstream and downstream intellectual property rights play an indispensable role. An important contribution of the study is that it jointly incorporates technology alliances and acquisitions as key external knowledge and technology channels for organisations. By constructing a detailed dataset on partners’location of SSI incumbents, I assess that the intensity of geographic overlap in external technology search compared to rivals is a direct consequence of resource differentials in the breadth offirms’IPR-related assets.
In addition, the study can enhance our understanding offirms’location patterns of ETS by applying a diverse geographical classification. Furthermore, I follow prior research that considers trademarks as important assets forfirm strategy (e.g. Block et al.2015;
Fosfuri, Giarratana, and Luzzi 2008; Fosfuri and Giarratana 2009; Mendonça, Santos Pereira, and Godinho 2004). This paper offers a value addition in terms of measure- ment as it directly captures the diversification dimension of this downstream IPR asset.
Finally, this paper joins with the line of academic enquiries (Block et al.2014; De Vries et al.2017; Helmers and Rogers2010; Zhou et al.2016) that mutually considers patents and trademarks in studying openness.
2. Theoretical background
The ability to compete in high-technology industries depends on the acquisition of competitive knowledge, implying, that afirm has to attain experience with the underlying science and related technological fields (Kim and Kogut 1996). Some of these newly acquired capabilities help the firm to respond rapidly to market changes and allow for expansion during windows of opportunity (Kim and Kogut 1996). Studying patenting activity in optical disc technology, Rosenkopf and Nerkar (2001) show that exploration spanning organisational boundaries consistently generates higher impact on subsequent technological evolution, thereby it can provide for the explorer organisation a competitive advantage within the industry and an option to diversify. Resorting to external exploration is desirable as technological evolution is generated by communities of organisations
(Rosenkopf and Tushman1998). For instance, the evolution of products with the under- lying components can be viewed as the result of variation, selection and retention processes that take place by a broad community of organisational actors (Rosenkopf and Nerkar 1999). This feature influences a firm’s technological trajectory and makes all industrial actors mutually interdependent.
To maintain or enhance competitive edge,firms might be motivated to employ ETS for search of new capabilities, and presumably to recombine those newly acquired or accessed capabilities with existing skills. This motive has been termed technology or knowledge seeking, and such organisational search behaviour can be more prevalent if afirm competes in a technology-intensive industry (Chung and Alcácer2002). One can expect somefirms to value locations’traits that reflect the level of localised technical activity. The uniqueness of a location relies much on location-specific factors that can nurture technologies not available elsewhere (Cantwell1989). Even a relatively resource-poorfirm but one that is situated in a resource abundant location can considerably improve chances to realise investment in innovative processes (Forman, Goldfarb, and Greenstein 2008).
Tapping localised technology sources is greatly enhanced by frequent inter-partner inter- action as relevant knowledge can be tacit and the prerequisite of its transfer depends on physical propinquity (Kogut and Zander1992). This idea thatfirms seeking new knowledge have to approach the target locations is reaffirmed by Almeida and Kogut (1999). They demonstrate that localised knowledge builds upon cumulative ideas within regional bound- aries, and as knowledge is frequently tacit that knowledge resides with engineers of a particular geographic community. For instance, science parks attract large enterprises that through spatial proximity enable them to satisfy their knowledge needs and to facilitate the transfer of tacit knowledge (le Duc and Lindeque 2018). Cantwell and Janne (1999) bring evidence thatfirms emanating from leading technical centres are also likely to pursue technological strategies in which they geographically differentiate their innovative activities abroad. In contrast tofirms from more laggard technical centres whose primary interest relies on catch-up, they are primarily focused on sourcing more diverse technical knowl- edge. Studying inward FDI into the United States, Chung and Alcácer (2002) make a parallel inference, arguing that knowledge seeking takes place not only among technical laggards, but is also ubiquitous among technically leadingfirms.
Acknowledging the potential for higher added value and nonredundant knowledge to be captured from geographically distant organisations, a defensive argument puts emphasis on geographically isolating external technology search vis-à-vis competitors. Certain industries are based upon technical competition, which may force all participants to seek spillovers from competitors. The study by Shaver and Flyer (2000) argues thatfirms with the best technologies have strong motivation to geographically distance themselves, otherwise their technologies with other key resources spill over to competitors which become stronger and eventually endanger the competitive position of the former. Chung and Alcácer (2002) arrive to a similar conclusion in connection with foreign technologically leadingflagshipfirms as they opt to spatially isolate themselves from existing clusters in the United States to prevent outward knowledge spillovers to rivals. Such unwanted outgoing knowledge spillover can occur as the level of knowledge in- and outflows is not exogenous to thefirm, but the recipientfirm can affect the extent of incoming spillovers through a deliberate innovation strategy (Cassiman and Veugelers2002). In a related paper, Alcácer and Chung (2007) recognise thatfirms are active entities in making decisions upon location strategies in terms of net spillover benefits
they may obtain, and thus are aware of the possible cost of outward spillovers. Using information on European inventions and data about firms and location, Giarratana and Mariani (2014) show thatfirms conducting research projects in locations with high levels of absorptive capability in a specific technology risk internal knowledge spillovers.
2.1. IPR assets and geographic overlap in ETS
The management literature on openness emphasises the strategic value of ETS locations choices that serve as key assumptions to the theory laid down. First, firms assign the importance of ETS in high-tech environments. Second, knowledge and technology are not concentrated but geographically dispersed, and there is a limited number of best locations for certain advanced types of knowledge and technology. Last, firms might apply self- defence from unintended knowledge spillover by diverging ETS from rivals. Therefore, ceteris paribus, there must be strong competition for the most attractive locations, implying that somefirms should be able to exert an expelling effect or tofirst break-in into such locations; put differently, thesefirms should be able to reach a lower extent of geographic overlap through an isolation process in ETS locations vis-à-vis rivals. This represents a research gap in the open innovation management literature that I attempt tofill.
In turn, what moves the above process? This paper posits that an organisational strategy to flock with or to enjoy a position of spreading ETS geographically more extensively than within-industry competitors relates closely tofirm resources. Namely, upstream and downstream organisational resources in intellectual property rights can potentially act as driving forces for firms to geographically isolate their external technology search networks. To this point, I examine patents and trademarks, the two types of IPR tools that, respectively, represent technological and marketing resources (Zhou et al. 2016). Both protected assets constitute as rare, not easily substitutable, costly and difficult to imitate internal organisational resources that may be key to thefirm’s acquisition and maintenance of sustainable, competitive advantage (Barney 1991; Castanias and Helfat 1991). Preexisting assets with these qualities can positively affectfirms’ability to adapt and to exploit new opportunities (Tripsas1997;
King and Tucci 2002). In deriving the hypotheses, I utilise to the breadth of the endowments in patents and trademarks instead of the pure stock of such protected assets, proposing that resource differentials between firms affect the degree of geo- graphic overlap in their ETS channels. A broader portfolio of protected assets can better support openness in search activities, taking into consideration a potentially significant geographic variation in innovative activity (Almeida and Kogut1999), reuse of existing capabilities to generate inventions (Strumsky and Lobo 2015), constraints on firm resources (Garriga, Von Krogh, and Spaeth 2013), evaluation difficulties of partners’
resources and prospects (Reuer and Lahiri 2013), costs of identifying external knowl- edge inputs (Salge et al.2013), and overall hidden costs (Cassiman and Valentini2016).
Overall, firms with larger breadth of upstream and downstream IPR assets are expected to achieve less intensity of geographic overlap in ETS locations against their rivals because they can keep competitors out of strategically valuable locations (e.g. by breaking-in first or expelling rivals) or because they attempt to isolate themselves to diminish unintended knowledge spillovers and defend their competitive advantage.
3. Hypotheses
3.1. Upstream resources: generality of patents
A more general, industry-core patent portfolio (i.e. a stock of patented inventions with widespread impact) provides greater resilience and latitude in ETS which lowers the extent of geographic overlapvis-à-viscompetitors for several reasons.
Thefirst reason is strategic. Patents normally symbolisefirms’technological capabilities (Giarratana and Torrisi2010), assist with building a positive technological image (Blind et al.2006; Veer and Jell2012), and help open innovation activities (Zobel, Balsmeier, and Chesbrough 2016). A firm with a portfolio of more general stock of industry-specific patents is more effective at applying competitive pressures to rivals in forming ETS links.
Particularly, exhibiting variety in the generality dimension, patents look more attractive for generating knowledgeflows in the eyes of potential partners, thus the focalfirms can easily approach thosefirms that are located in capability rich areas. By a related consideration, owning a more general patent portfolio of widespread impact can signal a technology leader position in the industry (Garud and Kumaraswamy1993) which might offer a possibility for exploiting this reputation of a technology champion, enabling the leader to create a spatially divergent set of technology search locations with respect to less capable rivals.
Therefore, less-capable competitors will prove to be less attractive candidates which reduces their opportunities to break into a geographically divergent set of locations. An additional source of advantage is that a more general industry-core patent portfolio might render potential partners a necessary knowledge overlap, facilitating broader partner selection with complementary patents and technologies. This can be an important aspect for geographi- cally distant R&D collaborations that entail difficulties to evaluate others’resources and prospects (Reuer and Lahiri2013).
The second reason is defensive and also indicates a lower extent of geographic overlap in technology search networks. Establishing multiple technological coopera- tions involves risk for thefirm to infringe upon patents held by other entities. However, a more general patent portfolio of the searcher organisation through stronger bargain- ing power increases the likelihood of avoiding litigation or establishing friendly agree- ments with potential litigators. Through studying the semiconductor sector, Hall and Ziedonis (2001) and Ziedonis (2004) demonstrate that when there is a fragmented market for technologies, patent portfolios help resolve hold-up problems via the use of cross-licensing agreements. Consequently, a more general patent portfolio can shield the firm against IPR-related litigations and therefore may potentially dismantle legal barriers of geographically spreading ETS more extensively than the network of rivals with less general portfolios.
Third, firms with a more general patent portfolio obtain a different kind of benefit whereby, compared with and against competitors, they enjoy a geographic divergence of their technological search channels. A more general knowledge base creates a higher potential absorptive capacity (Lane and Lubatkin 1998; Zahra and George 2002) that extends an organisation’s possibility to value and assimilate external knowledge. This component increases the overall level of absorptive capacity that allowsfirms to manage external knowledge flows more efficiently, and, consequently, stimulate innovative outcomes (Escribano, Fosfuri, and Tribo 2009). This leads to less information asym- metry when evaluating the quality of the skills of potential partners or acquisition
targets that operate in a different segment of the industry. Lower expected costs due to higher absorptive capacity give thefirm more freedom for trial and error experimenta- tion. Therefore, afirm incurs less search costs of ETS which permits spatial divergence augmentation of its open innovation locations compared to rivals.
Finally, a more general patent portfolio provides more universal skills that can increase knowledge coordination in ETS links. Improved knowledge coordination contributes to the better exploitation of synergies and to the rate of organisational learning (Zollo and Winter 2002). Furthermore, a more general knowledge base with enhanced learning potential can promote a‘connect and develop’strategy that leverages external capabilities in order to enrich the connecting firm’s innovation portfolio (Sakkab 2002), and can permit the reuse of existing capabilities to generate inventions (Strumsky and Lobo 2015).
As a result, by taking into account all the positive consequences of a more general patent portfolio for ETS associated with open innovation, I hypothesise the following:
HYPOTHESIS 1. Firms with a more general preexisting stock of patents will have less intensity of geographic overlap in external technology search locations compared to rivals.
3.2. Downstream resources: diversification of trademarks
The next proposition suggests thatfirms with more diversified complementary or down- stream assets to product commercialisation have strong incentives to spread external technology search in the geographic space and build up beneficial positions against rivals.
Teece (1986) argues that, in almost all cases, the successful commercialisation of an innovation requires complementary assets and that the ownership of such assets can position the innovator advantageously. Correspondingly, the lack of those assets can force a technology entrepreneur to sell its technology instead of commercialisation (Gans and Stern2003; Arora and Ceccagnoli2006). For instance, brand advertising can contribute to the creation of stronger downstream assets either by greater brand loyalty due to higher perceived customer differentiation (Lancaster 1984) or by elevating entry barriers to competitors when the brand acts as a reference in its category (Kapferer1997).
An efficient form of creating downstream assets is through registering trademarks that secure legal marketing protection (Fosfuri, Giarratana, and Luzzi 2008) and technological investments by boosting the rate of appropriability (Block et al. 2015;
Flikkema, De Man, and Castaldi 2014; Mendonça, Santos Pereira, and Godinho 2004). Differentiation is largely enhanced by trademarks that permit customers to distinguish a firm and its offerings from those of the competitors (Mendonça, Santos Pereira, and Godinho 2004; Fosfuri and Giarratana 2009) which reduces simultaneously their search costs (Cohen 1991). Trademarks key to the scope of operation is a signal of conscious investments into a firm’s own brands, reputation for perceived quality, customer loyalty and distribution channels (Mendonça, Santos Pereira, and Godinho 2004; Block et al.2015). Investment into trademarks provides good protection of marketing efforts as a strong brand along with reputation for quality transforms into an intangible asset that is not easily imitable by competitors.
Linking this with the fact that an efficacious way to own markets is to own brands (Aaker 1991), trademark registration represents valuable efforts to develop and
strengthen a business. Relatedly, Gao and Hitt (2012) have found that trademarks represent a signal of new product development capacity. Trademarks also protect brands against low-priced copycats as the aggrieved party can seek legal remedies for any market advantage enjoyed by the copycat due to confusion, mistake or deception (Warlop, Ratneshwar, and van Osselaer 2005). In consequence of the vantage-point for a successful commercialisation that emanates from several market- ing- and reputation-related advantages, firms with a more diversified portfolio of trademarks seem more attractive to target organisations and can enjoy more free- dom in selecting open innovation partners, as opposed to weaker rivals whose ETS activities would be expelled or limited. A diversified trademark portfolio might signal ample relevant marketing information about the firm, which is crucial in cases of geographically distant R&D collaboration and difficulty when determining would-be peers’ resources and prospects (Reuer and Lahiri 2013).
Past research points out correspondence between a firm’s own trademarks and its pecuniary features. For instance, Fosfuri and Giarratana (2009) find that filed trade- marks relevant to the industry in question imply larger financial firm value. Prior studies also detect that trademarks strongly correlate with company sales (Seethamraju 2003), stock market value (Smith and Parr 2000), firm value (Sandner and Block 2011), cash flow, Tobin’s q and return on assets (Krasnikov, Mishra, and Orozco2009). As a consequence, one can expect a more diversified stock of trademarks concentrated in the focal industry to contribute more to thefinancial soundness of the firm compared to rivals that possess a less diversified portfolio. This implies that the focalfirm has more resources for non-local search and can also become more attractive for potential partners due to larger investment freedom. In effect, more available resources to allocate can increase the geographic divergence of technology search channels compared with competitors that have a scarcity of such downstream assets.
Furthermore, a more diversified trademark holding generally encompasses brands from a broad range of product categories. To achieve wide product scope, the organisa- tion had to undergo a continuous and repeated sequence of changes that identify the underlying organisational routines of this group of firms (Sorenson et al. 2006). Such firms might have presumably developed the ability to accommodate new technologies due to former expansions and the acumen to analyse the potential use of a technology due to the experience with a wide range of products (Fosfuri, Giarratana, and Sebrek 2018). Additionally, a diversified brand portfolio can prove to be beneficial from cost- efficiency considerations. For example, Cohen and Klepper (1996)find that the returns on R&D are closely dependent on the range of a firm’s output because fixed costs related to R&D activities can be better spread and thus absorbed with more business applications. These organisational traits on firms with a diverse set of brands may involve a spatially divergent external search compared to their rivals.
Based on the above, the consequences of a more diversified trademark portfolio for ETS associated with open innovation leads to the next hypothesis:
HYPOTHESIS2.Firms with a more diversified preexisting stock of trademarks will have less intensity of geographic overlap in external technology search locations compared to rivals.
3.3. Resource richness, its parity and multimarket contacts
To this point, the arguments of Hypotheses 1 and 2 suggest that differences in the degree of breadth of upstream and downstream IPR assets influence the outcomes of competitive contests between pairs of firms at external technology search. As a consequence, large resources differentials prevent weaker rivals to occupy similar geographic locations in ETS.
Nevertheless, these inquires do not permit drawing precise conclusions on ETS location strategies, if bothfirms of a given pair score high either on the generality of patent or on the diversification of trademark. Studying the ETS location behaviour of such intra-industry resource-richfirms is of prime interest in contrast to medium valuefirm pairs, for instance, which according to theory established in the prior two hypotheses are only able to apply less extensive ETS due to the limitations of their IPR resources.
Therefore, questions regarding equally resource-rich firms remain unanswered: If both members of afirm pair reach parity in the breadth of key IPR assets, then both rivals may equally break into valuable locations. Therefore, a more spatially similar ETS network would develop. I propose that such a process is moderated by the existence of a high extent of market overlap between thefirms that they develop within their focal industry. Indeed, Sirmon, Grove and Hitt (2008) found that the degree of parity in the resources held by the two rivals moderates the relationship between resource manage- ment and outcomes of competitive contests.
The precondition of multipoint competition is an organisational strategy in which the firm broadens its product portfolio and diversifies within its own industry (Giarratana and Fosfuri2007; Li and Greenwood2004). Firms having stakes in many product categories can enjoy different kinds of positional advantages like increased stability in a more uncertain business environment (Dobrev, Kim, and Carroll2002), more strategic latitude for managers to hedge their bets (Sorenson 2000), increased entry barriers against newcomers (Lancaster 1990), beneficial positions at technology acquisitions (Fosfuri, Giarratana, and Sebrek 2018), higher survival chances (Dowell 2006; Giarratana and Fosfuri 2007) and better overall performance (Barroso and Giatarrana 2013; Zahavi and Lavie 2013). Furthermore, consumers might find it con- venient to buy on the idea of one-stop shopping (Siggelkow 2003), and should con- sumer preference be positively correlated, a product bundling strategy might be implemented (Gandal, Markovich, and Riordan2005).
In the model, I propose that if both members of afirm dyad are resource-rich in the breadth of their upstream or downstream IPR assets, and there is a high overlap of within-industry market niches, then it augments the convergence of their open innova- tion locations. I highlight three reasons that help explain such a competitive outcome.
First, firms develop common interests for the same types of new technologies and knowledge as they operate in similar market segments serving the same groups of customers. This results in targeting a geographically similar network of external tech- nology search which is more conspicuous if specific skills or technology can only be accessed in a limited number of locations.
The second reason is strategic and relates to the possibility of mutual forbear- ance. Multiplicity of contacts makes competitors recognise their interdependence, and hence advances the possibility of collusion (Karnani and Wernerfelt 1985).
This leads to a more conscious coordination, development of information about
each other and to a reduced intensity of market competition (Boeker et al. 1997).
Mutual forbearance between two firms with high level of multimarket contacts is a stable strategy as it is buttressed with a lower rate of exit from the competitor’s market (Baum and Korn 1999). Furthermore, if the mutual forbearance agreement breaks, namely if overly aggressive rivalry is not undermined, then multimarket contacts widen the scope for punishing attempts of technology expropriation, knowledge dissipation or reverse engineering. Such retaliation can be realised in those market niches where the aggressor has more to lose than the responder (Bernheim and Whinston 1990), or the cost of defense is likely to be relatively low (Karnani and Wernerfelt 1985). One effective way to counter-attack is if the threatened firm starts to sell products applying predatory pricing in core, cash- cow niches of the aggressor where it can achieve the starkest possible retaliation on the attacking firm. Therefore, multimarket contacts with rivals facilitate a higher extent of ETS overlap due to less fear of negative spillover balance. Instead of a lengthy litigation process, it can directly provide the opportunity for retaliation on cash-cow niches of the deviating rival. In addition, similarly to our notion of resource parity, Li and Greenwood (2004) found that similarity between firms facilitates rivals to capture more pecuniary benefits of multimarket contacts through mutual forbearance.
Third, the resource-partitioning model of organisational ecology demonstrates that the width of product portfolio through distinct forms of group identity development process shapes differently the adherence to quality, production methods, and clinging to customers and communities (Negro, Visentin, and Swaminathan 2014; Carroll and Swaminathan2000; Swaminathan2001). Consequently, to alleviate competitive threat posed by specialistfirms, resource-rich, wide market-scoped generalists’ETS might be affected by their competitive interdependence and collective identity that would even- tually permit a more mutually supportive behaviour in ETS for this class of organisa- tions. These arguments lead to the last hypotheses:
HYPOTHESIS 3a(b). If both members of a firm-pair are resource-rich in their generality of patents (diversification of trademarks), and exhibit multiple contacts in their market niches, then they will have more intensity of geographic overlap in ETS locations with each other.
4. Data and methodology 4.1. Sample construction
To test these ideas, I resort to the Security Software Industry (SSI) which has its techno- logical origins in the 1970s due to large investments made by the US government in military projects related to security of data transmissions. As a result, a sound scientific background in cryptography and encryption emerged through the involvement of large ICTfirms and university departments which manifested in a historical, USPTO-registered patent stock.
This process created a publicly available source of knowledge spillovers that benefited enormously the birth of the SSI with a clear commercial focus at the turn of 1980s and 1990s. At that time, several favourable environmental factors supported the industry’s evolution such as the fabulously growing PC market, the development of the Internet
accompanied with the need towards secure Internet-based financial transactions.
Consequently, the worldwide sales of security software products between 1997 and 2002 tripled from USD2.2 billion to USD6.9 billion (IDC2000,2003). Rising demand enlarged the spectrum of market supply which embraced not only basic products of encryption such asfirewall or antivirus programmes, but comprehensive and advanced security services linked to protection of operating systems and applications, network security management packages, and sensible data and hardware protection (Giarratana and Fosfuri2007).
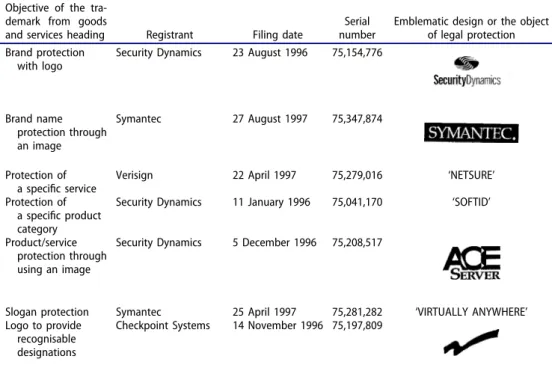
The emergence of new market niches altogether with fierce market competition spurred widespread trademark issuance in SSI that enables firms to forge brand protection, to take advantage of superior product quality reputation and to forge customer loyalty, which ultimately enhances the commercialisation potential of the trademark issuer.Table 1exemplifies the various motives and applications of trademark issuance in the sector.
A notable technical characteristic of the industry pertains to the mathematical crypto algorithm that is the principal component of a security software product through transforming plain text data into cipher text, and what it can be strongly protected by patents. The task of crypto algorithm is to execute the encryption and decryption processes of the data, and its quality in terms of security level and speed of mathema- tical calculations is a decisive factor to provide competitive advantage for the owner organisation (Giarratana 2004). For instance, the US Patent 5,768,373 filed on 6 May 1996 by Symantec Corp. is directed towards providing a secure method to access data when the user has lost or forgotten the user password. The patent description employing several block diagrams explains that the decryption of an access key gives
Table 1.SSI trademarks with the scope of applicationfiled by prominent security software producers.
Objective of the tra- demark from goods
and services heading Registrant Filing date
Serial number
Emblematic design or the object of legal protection Brand protection
with logo
Security Dynamics 23 August 1996 75,154,776
Brand name protection through an image
Symantec 27 August 1997 75,347,874
Protection of a specific service
Verisign 22 April 1997 75,279,016 ‘NETSURE’
Protection of a specific product category
Security Dynamics 11 January 1996 75,041,170 ‘SOFTID’
Product/service protection through using an image
Security Dynamics 5 December 1996 75,208,517
Slogan protection Symantec 25 April 1997 75,281,282 ‘VIRTUALLY ANYWHERE’ Logo to provide
recognisable designations
Checkpoint Systems 14 November 1996 75,197,809
Source: My collections from the USPTO database.
access to data and that two encrypted versions of the access key are created. If the password is forgotten access to data is accomplished by decrypting the second encrypted version of the access key via the private key, from the public-private key pair, which is required to be stored at a remote site. A further illustrative example is the US Patent 6,141,420 filed by Certicom Corp. on 29 January 1997 which applies an elliptic curve cryptosystem method instead of integer calculus, performing the encod- ing-decoding process more quickly while requiring less computer space expressed in bits (Giarratana2004).
There are several industry traits that emphasise the importance of external technol- ogy search for security software manufacturers. First, product innovation plays a major role accompanied by the proliferation of lucrative new product categories (The Economist2002). Second, it is a technology-based industry with continuous innovation where the complexity of a security software system requires incorporating problem solutions from distinct technological areas, for instance mathematics, hardware engi- neering, software development and network design (Giarratana2004). Third, competi- tion is intense implying low entry barriers, paucity of first-mover advantages for survival and a high hazard rate of firm exit (Giarratana and Fosfuri 2007). Therefore, I believe that the worldwide SSI proves an ideal setting to study firms’ collocation patterns of external technology search.
To verify the hypotheses, I constructed a comprehensive data set tracing SSIfirms’
locations for acquisitions and strategic technology alliances on a global basis.
I discovered the population of SSI organisations via security software product intro- duction data from Infotrac’s General Business File ASAP and PROMT database (former Predicast) that, from a large set of trade journals, magazines and other specialised press (e.g. eWeek, PC Magazine, PR Newswire, Telecomworldwire), reports several categories of events classified by industrial sectors. This data source is the more recent version of the former Predicast database and was applied in various studies (e.g. Pennings and Harianto1992; Fosfuri, Giarratana, and Luzzi2008). I searched for all press articles that reported a‘Product announcement’, a‘New software release’and a‘Software evaluation’
in SSI at SIC Code 73726 (Encryption Software Sector) from 1980 to 2002. These steps determined that the first product was introduced in 1989.
Prior contributions point at the pivotal role that acquisitions (Haspeslagh and Jemison 1991; Hitt et al. 1996; Pisano1991; Vermeulen and Barkema 2001; Cassiman and Colombo 2006) and strategic technology alliances (Dussauge, Garrette, and Mitchell 2000; Hamel 1991; Kumar and Nti 1998; Lane and Lubatkin 1998) can play when external sources of knowledge and technology have become relevant. Therefore, I take into consideration these inter-organisational mechanisms to study ETS patterns offirms. Resorting to the same Infotrac database, I downloaded all the articles for SSI firms that report an acquisition and an alliance event under SIC 73726. For all types of events, I carefully read the text of business news, and removed the equivocal events from the sample. Considering alliance texts, I selected only those events for the variable strategic technology alliance where partners are involved in combined innovative activities or exchange of technologies (Hagedoorn and Duysters2002). Hence, equivo- cal cases or marketing alliances were excluded. It is worth noting that acquisitions are often used to increase CEO power or to penetrate in a new and untapped geographic market (especially at older sunk-cost industries). Notwithstanding, an acquisition in SSI
has primarily a technology or knowledge acquisition orientation, as target organisations can have a valuable (protected) technology or employ skilled software engineers. For instance, Cisco Systems, a firm that is heavily interested in the network, content and web security business, uses a considerable part of its profits to purchasefirms with R&D capabilities (Shapiro and Varian1999).
I studied all the security softwarefirms that realised at least two external technology searches during the 3-year span 2000–2002. By this period, SSI developed into a mature industry where the use of the above two mechanisms became ubiquitous. The sample on strategic technology alliances (acquisitions) consists of 57 (51) security software firms that are undoubtedly the leading players in the industry. In constructing the database, I made firm dyads as the unit of analysis which was motivated by the following reasons: it captures afirm’s relative position, it provides a consistent compar- ison across organisations, and it efficiently reflects the competitive engagements offirms (Alcácer2006; Baum and Korn1999; Chen1996; Sirmon, Gove, and Hitt2008).Table 2 offers descriptive statistics on the different types of ETS that the sampledfirms realised across the entire study period.
4.2. Dependent variables
Following Alcácer’s study (2006), I apply a similar measure for the construction of the dependent variable. This location index (LOCI) allows for comparing the geographic convergence or dispersion of ETS networks to any two samplefirms (iandj) in giving an in-between value of complete coincidence or total dissimilarity. The sign i’ is a 1xn row vector whilejdenotes annx1 column vector. Each element, ofilorjltakes on either 1 or 0, depending on whether the given firm has realised an ETS activity in location l. From the viewpoint of firm i, the LOCIij measure is a percentage value of ETS locations overlapped by bothfirms, mathematically:
LOCIij¼i0j i0i ¼
Pl¼n
l¼1iljl
Pl¼n
l¼1ilil:
The LOCI measure is dyadic by construction and varies theoretically from 0 (dispersion) to 1 (similarity). If the index reaches its maximum value 1, it means thatfirmjexplored exactly the same geographical sites asfirmi. In the reversed case,firmiandjdon’t share any geographically coinciding locations in their explorative undertakings, and so the index takes the value of zero. Alcácer’s index is a quite precise and convenient way to compare the location choices of any two samplefirms, as it represents a multidimensional relationship with a single value, and the interpretation is intuitive. Additionally, the index weighs only those elements that equal 1 and it is independent of the number of elements in the vectors, in contrast to correlation or covariance which‘vary when more null elements are added to the vectors (Alcácer 2006, 1461)’. Ultimately, the LOCI measure inherently is not
Table 2.Descriptive statistics on the types of ETS.
Type of ETS Number offirms Total number of ETS Mean SD Min Max
Acquisitions 51 252 4.94 3.53 2 13
Strategic technology alliances 57 430 7.54 7.16 2 34
symmetric forfirm pairsi-jandj-iowing to the scale applied in the denominator that is always related to the focalfirm. In fact, this feature reflects competitive asymmetry (Chen 1996) by recording differently the presence in geographic factor markets for participants in a givenfirm dyad.
To calculate LOCI,first, I had to identify the exact location of all organisations with which the sample SSIfirms had ETS links. Forfirmi, I considered the acquiredfirms by i, and its technology alliance partners. Second, I had to devise an appropriate policy with regard to possible geographic divisions because isolation patterns of ETS grasped by the location index might be sensitive to units of geographical classification. Let’s consider a Southern California security software maker that through locating ETS within a geographically limited territory, for example only in the neighbouring counties, might obtain increasingly higher values for LOCI compared to the same rivals if there is an increased size of geographic units. As a result, I apply a similar geographic gradation to that of Alcácer (2006), for which I determine the value of LOCI for three geographic levels: clusters, countries and economic regions. Operationally, clusters are equal to US counties, or equally sized official geographic units outside of the US; country level refers to independent states or US states; and an economic region is related to a group of countries that culturally or economically share common traits. The involvement of the spatially greater regions can amplify our understanding of ETS location patterns as cluster level may overestimate the extent of geographic extension of an ETS network, assigning a biased lower value to the LOCI index. Nonethless, a cluster-level measure for LOCI can provide a more sophisticated insight of location choices because some firms may concentrate ETS to a geographically limited area.
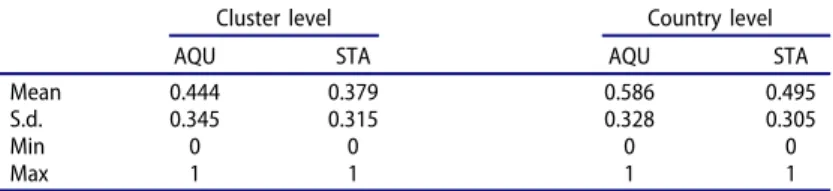
I identified all actual geographic locations properly through the Geographic Names Information System for US locations and the Getty Thesaurus of Geographic Names for foreign, non-US locations. Finally, I calculate the LOCI value for all geographic levels considering the type of ETS activities separately (acquisition or strategic technology alliances). Consequently, I obtained six LOCI measures depending on geographic gradation and activity type. Table 3 summarises the dyadic level location indices by the type of ETS activities (acquisition and strategic technology alliances) calculated at the cluster and country levels, whereasTable 4(a,b) show the geographic profile of the two ETS channels at the cluster level.
4.3. Estimation procedures
I hypothesise that the location of boundary-spanning external technology search vis-à-vis rivals is generated by the functionLOCIij=xTijβ+ɛij, where the dependent variable is the location index for the convergence or dispersion of technology exploration networks,xijis the set of explanatory dyadic variables,βis a vector of parameters to be estimated, andɛijis an error term. One econometric challenge involves the fact that dyadic data are assumed not to consist of independent observations, but rather have varying amounts of dependence on one another which can lead to autocorrelation in the error terms (Krackhardt1988). The lack of such independence is best illustrated by afirm that purposefully decides to separate its ETS allocation from the rest of competitors due to some unknown reasons. The result introduces a chain of positive autocorrelation for all dyadic observation related to the deviating firm which can generate small standard errors and thus inflated t-statistics
(Alcácer2006). Additionally, the existing row or column interdependence can bias ordin- ary-least-squares (OLS) tests of significance (Krackhardt 1988). To contend with this problem of bias, I use a method based on Krackhardt (1988), who proposes a nonparametric solution called the Quadratic Assignment Procedure (QAP) that provides unbiased tests for regression coefficients. The QAP algorithm proceeds byfirst performing an OLS regression on the original data set. Then the rows and columns of the dependent variable matrix are permuted to provide a new, scrambled matrix. The OLS regression
Table 3.Descriptive statistics on the LOCI measure at dyadic level.
Cluster level Country level
AQU STA AQU STA
Mean 0.444 0.379 0.586 0.495
S.d. 0.345 0.315 0.328 0.305
Min 0 0 0 0
Max 1 1 1 1
Table 4. (a) Geographic profile of ETS activities for strategic technology alliances (at the cluster level). (b) Geographic profile of ETS activities for acquisitions (at the cluster level).
County N. of STA % Country
(a)
Santa Clara 99 23% USA
San Mateo 44 10% USA
Middlesex 39 9% USA
King 30 7% USA
Westchester 28 7% USA
Tokyo 20 5% Japan
Toronto 20 5% Canada
San Francisco 19 4% USA
Alameda 17 4% USA
New York 17 4% USA
Etela-Suomen 14 3% Finland
Suffolk 10 2% USA
Fulton 9 2% USA
Baden-Wurttemberg 9 2% Germany
Number of different locations at cluster level 39
County N of AQU % Country
(b)
Santa Clara 41 16% USA
Middlesex 35 14% USA
Alameda 34 13% USA
San Mateo 28 11% USA
King 16 6% USA
Toronto 13 5% Canada
San Francisco 12 5% USA
Etela-Suomen 11 4% Finland
San Diego 8 3% USA
Fulton 6 2% USA
Erie 5 2% USA
Essex 4 2% USA
Los Angeles 4 2% USA
Philadelphia 4 2% USA
Number of different locations at cluster level 34 Source. My elaborations spawn from the use of Infotrac’s General Business File ASAP
and PROMPT database.
calculation is then repeated with the new dependent variable. The programme stores coefficient estimates and R2values. Next, another permutation of the dependent variable is drawn that is subjected to a new OLS regression whose coefficients and R-square values are again stored. This permutation-regression step is repeated 500 times that yields a reference, empirical sampling distribution for the stored betas of independent variables under the null hypothesis of no relationship between the independent variables and the dependent variable. In the end, one can compare each actual coefficient of thefirst OLS regression with the empirical distribution to reject the null hypothesis at an extremely high or low percentile.
4.4. Independent variables
I controlled for the generality of a firm’s upstream intellectual property right-related assets with the patentgenerality variable. Patents have been used extensively in the innovation literature to measure technological capabilities (e.g. Henderson and Cockburn 1994) and provide externally validated measures of innovative success that closely resonate to afirm’s level of technological competence (Narin, Noma, and Perry 1987). I only considered the fundamental technological classes pertaining to the SSI which include the 380, 382, 705, 709, 713 and 726 three-digit patent classes (Giarratana 2004). Thepatentgeneralityvariable is the Jaffe-Trajtenberg index of generality which is essentially a one minus Herfindhal index on forward citations of patents in three-digit SIC codes (Trajtenberg, Jaffe, and Hall 2000). By construction, it can vary between 0 and 1 (maximum portfolio generality) with high generality scores representing wide- spread impact in a wide range offields (Trajtenberg, Jaffe, and Hall2000). This variable is for 1998, as lagged by two years with respect to the dependent variables, and was built upon the NBER/Case Western patent database.
To grasp the downstream intellectual property right breadth of the sampled firms I resorted to the USPTO database (see De Vries et al.2017; Giarratana and Fosfuri2007) and downloaded exclusively the annual number of live software trademarks. To obtain only software-related trademarks for the focal organisations, I followed the method of Fosfuri, Giarratana, and Luzzi (2008) in which I applied a search algorithm through strings of words to the text of the trademark description of goods and services. The second core variable, trademarkdiversificationis the one minus Herfindhal index on the industrial class trade- mark codes from the yearly set of LIVE software trademarks of a firm. Similarly to patentgenerality, this variable is within the range 0–1 (maximum width of trademark portfolio) and lagged by two years.
To be able to test H3a and H3b, I created two multiplicative measures referred to as RRF_PATGEN*MMC andRRF_TMDIV*MMC. RRF_PATGEN andRRF_TMDIV stand for resource-richfirms in the breadth of patents and trademarks, respectively. Both are dummy variables and display 1 if the firm’spatentgenerality ortrademarkdiversification value belongs to the top 33%, respectively. For robustness checks, I also created these two dummy variables considering top 10, 15% and 25% values. Results in Tables 6 and 7 involve RRF variables on 10% and 33%. MMC is the abbreviation for multimarket contact, and demonstrates how many common SSI niches are shared by the two firms in a givenfirm dyad. The value of MMC for afirm can vary between 1 and 6, as any product launched by a security software producer can be classified into one of the six
product niches: authentication digital signature, antivirus, data and hardware protection, firewalls, utility software, and network security and management (Giarratana 2004;
Giarratana and Fosfuri 2007). Portfolio broadening built upon active presence in these niches is a notable product strategy in SSI (Fosfuri, Giarratana, and Sebrek2018).
4.5. Controls
I introduce a set of controls that may be an alternate explanation for firms’ external technology search behaviour. Experience in the market is captured by the number of years a firm is competing in SSI (Age in market) where it enhances firm survival (Giarratana and Fosfuri 2007). This variable is the difference between a firm’s entry year and the current year. I account for any possible distortion of a firm’s scale through the variable Sales in software business which is the logarithm of the share of LIVE software trademarks on the total LIVE trademarks multiplied by the firm sales (the source of this latter: Bureau Van Dijk’s Osiris). To grasp its possible impact on the dependent variable, I inserted a subsidiary control constructed at country level that is one minus Herfindhal index on the geographic extension of sampledfirms’subsidiary locations. Higher extent of industry competition atfirm entry was found to deteriorate survival options for security software makers (Giarratana and Fosfuri2007). To control for different industry conditions at the time of entry I employ a measure of organisa- tional population density at the time afirm enters the market (Density delay), as initial competition conditions can exert lasting effects on the extent of overlap in technology search locations.
Firms’core business can influence the way ETS is spatially distanced or converged from competitors because a firm’s core sector could exhibit common patterns in searching external knowledge and technology. Moreover, SSI can also host de alio companies as implied by Giarratana (2008). Hence, I employ three dummies that address the core business of the sampled organisations:Hardware(SIC code 357),Software(SIC 737), or Electronics(SIC 359-370). Data onfirm core business was taken from Bureau Van Dijk’s Osiris and Hoover’s. In addition, I implement in the QAP regressions a geographical dummy that takes the value of 1 if the headquarter of afirm is situated inNorth America (0 otherwise). Dummies onfirms’technological background and place of origin were also introduced by Alcácer (2006) in his study on subsidiary location choices.
Given that I employ a dyadic dataset, all independent and control variables similarly to the dependent variable are also dyadic: either differences from the focal firm’s perspective, or dummies with a value of 1 if both firms in a given dyad share the same feature described in the discussion of the proxy variable. To construct the database, I applied a pairing algorithm using the statistical software package R.
According to the number of firms involved, the data table on which I perform the QAP regressions consist of 3192 (2550) lines for strategic technology alliances (acquisi- tions). To alleviate potential endogeneity problems between firm resources and loca- tions choices of ETS, a two-year lag of independent and control variables with the location index is applied. Table 5 provides the basic descriptive statistics for the independent variables and controls.
5. Results and discussion
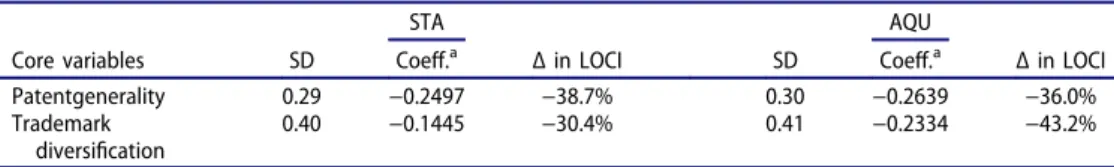
I run regressions using Multiple Regression Quadratic Assignment Procedure with the above covariates. The dependent variable is the location index (LOCI) of external technology search whose construction varies either by ETS type or geographic unit. Models 1 and 2 ofTable 6 present the results of QAP estimation for strategic technology alliances on cluster and country levels. Taking into consideration the conceptualisation of the hypotheses, one must expect negative signs for the IPR-based variables of theoretical interest. The results indicate that a more general preexisting stock of industry-specific patents (patentgenerality) expands the geographic isolation of strategic technology alliances vis-à-vis rivals.Trademarkdiversification also enjoys explanatory power at strategic technology alliances causing less intensity of spatial overlap compared to rivals. Independently of the geographic units, both core variables take the expected signs, therefore corroborate H1 and H2 for strategic technology alliances.
In Model 1 and 2, the level of the resource-richfirm (RRF) dummy variables is on 33%.
The multiplicative variable between resource-richfirms in the generality of patent stock and multimarket contact (RRF_PATGEN*MMC) is positive and significant both at cluster (Model 1 ofTable 6) and country level (Model 2 ofTable 6), confirming H3a for STA. Thisfinding suggests that a high spatial overlap vis-à-vis similar resource-rich competitors in the general- ity of patent assets is achieved, only if bothfirms exhibit a high rate of multimarket contact in SSI niches. TheRRF_TMDIV*MMCmultiplicative variable is positive, significant at cluster but not country level which does not fully buttress H3b. Therefore, theflocking strategy of resource-rich rivals in the diversification of their trademark assets, with vast common market scope, is sensitive based on the level of geographic gradation applied. Perhaps diversification of trademarks of multipoint competitors only spurs more ETS overlap within smaller districts of a greater economic unit that result in some sort of scope economies benefits from a commercialisation point of view. These may not be obtained or may be too expensive or cost-inefficient if the range of ETS is extended. As robustness checks, Models 3 and 4 apply the 10% level for the construction of RRF variables, thus influencing the values of the multiplicative variables. Results of core variables are qualitatively unchanged.
Table 5.Simple statistics of variables for QAP estimations.
STA AQU
Independent variables Mean SD Min Max Mean SD Min Max
Core variables
Patentgenerality 0.13 0.21 0 0.83 0.14 0.21 0 0.83
Trademarkdiversification 0.26 0.28 0 0.84 0.29 0.29 0 0.84
Controls
Age in market 1.23 2.22 0 8 1.29 2.28 0 8
Sales in software business 4.55 2.31 0 7.69 4.49 2.40 0 7.69
Subsidiary 0.73 0.34 0 0.98 0.75 0.33 0 0.98
Density delay 127.23 46.61 12 256 126.12 47.76 12 256
Hardwarea 0.07 0.26 0 1 0.12 0.33 0 1
Softwarea 0.82 0.38 0 1 0.80 0.40 0 1
Electronicsa 0.05 0.23 0 1 0.08 0.27 0 1
North Americaa 0.91 0.29 0 1 0.96 0.20 0 1
Niche widthb 2.91 1.98 1 6 3.14 1.83 1 6
Source. My elaborations spawn from the use of various data sources that embrace Infotrac’s General Business File ASAP and PROMPT, US Patent and Trademark Office, NBER/Case Western, Compustat and Osiris databases.
Notes. adenotes dummy variables.bThe niche width variable serves as the basis for the calculation of the dyadic multimarket contact variable.