E U ? Dzenita Siljak
1, Sándor Gyula Nagy
2Abstract
The objective of the article is to investigate the effects of the stage of integration on convergence in the European Union. The relationships between the selected macro- economic variables and per capita GDP growth rate are econometrically tested for the period 2004–2018 and three sub-periods: the pre-crisis period 2004–2008, the crisis period 2009–2013, and the post-crisis period 2014–2018. Convergence is estimated using ordinary least squares (OLS) semi-log regression based on cross-sectional data. The findings show that convergence rates range between 1.9 percent and 4.8 percent. The positive effects of deeper integration are identified, as well as the negative effects of the 2008/2009 crisis. The empirical results suggest that the selected variables have an impact on the per capita GDP growth rate in at least one analyzed period.
Keywords
Beta Convergence, Monetary Union, European Union, Optimum Currency Area Theory, Financial Crisis
I. Introduction
In this paper, we analyze the effects of monetary union membership on the convergence process in the European Union (EU), that is, whether the new Member States that have already joined the Eurozone converge faster towards the EU core, compared to the non- Eurozone new Member States. The research is focused onβconvergence during the period 2004–2018, therefore the United Kingdom is included in this analysis. In order to test the effects of the 2008/2009 financial crisis on the convergence process, we include three sub-periods in the analysis: the pre-crisis period 2004–2008, the crisis period 2009–2013, and the post-crisis period 2014–2018.
1International University of Sarajevo, Hrasnička cesta 15, 71210 Ilidža – Sarajevo, Bosnia and Herzegovina.
E-mail: dzsiljak@ius.edu.ba.
2Corvinus University of Budapest, F˝ovám tér 8, 1093 Budapest, Hungary. E-mail: sandorgyula.nagy@uni-cor- vinus.hu.
According to the Balassa classification of integration (1961), the EU is at the highest stage of integration in the world economy. The twenty-seven EU Member States form a common market, while nineteen countries share the same currency, the Euro, and are members of a monetary union, the Eurozone; they have one monetary policy. In order to join Europe’s Economic and Monetary Union (EMU), each country has to fulfill the Maastricht (convergence) criteria on price stability, public finances, exchange rate stability, and long-term interest rates. The criteria were derived from the optimum currency area (OCA) theory. It is important for a monetary union to achieve real, nominal, and structural convergence because if countries differ in their structures and development levels, they can experience asymmetric shocks and one monetary policy will not fit them all. Convergence is defined as the assimilation of development levels and a necessary condition for successful and efficient integration (Palánkai, 2010). It is also a tendency of less developed countries to grow faster than more developed ones (Barro and Sala-i-Martin, 1992). Ever since the Treaty of Rome, the EU has focused on decreasing dispersion among the Member States.
For example, the European Regional Development Fund (ERDF) was created in 1975, with the objective to assist underdeveloped regions in the catching-up process (Berend, 2016).
The new Member States had to go through the transition process from a centrally planned to a market economy. The centrally planned system was characterized by a closed economy with no foreign trade, low investment, the state ownership of companies, artificially low prices, no unemployment, and low general government debt. The transition process started with the fall of the Berlin Wall in 1989 and the dissolution of the Union of Soviet Socialist Republics (USSR), Czechoslovakia, and Yugoslavia. In this process, more than twenty new countries were created and for most of them, EU membership was the ultimate goal. Eleven former transition countries joined the EU in 20043, 20074, and 20135. In the accession process, the countries had to fulfill the Copenhagen criteria, which include economic, political, and institutional criteria. The gist of the criteria fulfillment is that new Member States (the periphery) are as similar as the old Member States of the EU (the core), so that they are able to function in the EU market and as EU Member States. The new Member States had support from the EU in this process, as they had access to the EU pre-accession funds and to the cohesion funds, once they joined the Union. The financial assistance from the EU, increased trade, investment, and job opportunities are some of the factors why the new Member States’ per capita GDP increased from 48.3 percent of the EU-14+1 average in 2004 to 61.4 percent in 2018.
In 2002, twelve EU Member States6 introduced the euro as their currency; Denmark is the country with an opt-out clause7, while Sweden is staying outside the Eurozone on its own decision. Seven new Member States have introduced the Euro as their currency.
3The Czech Republic, Estonia, Hungary, Latvia, Lithuania, Poland, Slovakia, and Slovenia joined the EU in 2004, together with Cyprus and Malta.
4Bulgaria and Romania.
5Croatia.
6Austria, Belgium, Finland, France, Germany, Greece, Ireland, Italy, Luxembourg, the Netherlands, Portugal, and Spain.
7The United Kingdom also had an opt-out clause.
Slovenia was the first new Member State to adopt the Euro in 2007, followed by Cyprus and Malta in 2008, Slovakia in 2009, Estonia in 2011, Latvia in 2014, and Lithuania in 2015. Bulgaria and Croatia are expected to be the next countries to join the Eurozone, as they participate in the Exchange Rate Mechanism II (ERM II). Czechia, Hungary, Poland and Romania do not participate in the ERM II, nor do they plan to in the near future, which means that they have decided to stay outside the Eurozone for now. The countries are obligated to adopt the Euro as their currency, just like all new member states. However, they have not fulfilled at least one convergence criterion (the one on price stability).
The economic, political, and institutional differences among the EU Member States still exist. Some of the EU members (such as France) are proponents of even deeper integration, that is, political union. On the other hand, countries that have decided to stay outside the Eurozone have been perceived as Eurosceptic states that might want to follow the path of the United Kingdom someday and leave the EU.
Economic growth accelerated in the CEE countries after the accession (Rapacki and Pró- chniak, 2019), but the new Member States are still less efficient in some areas that the old Member States (such as inflation and institutions). Joining a monetary union involves costs and benefits. A country will lose its monetary policy, which can be used in stabilizing output and employment, especially during a crisis. However, a high degree of economic integration between the country and the fixed exchange rate area that it joins reduces the resulting economic stability loss (Krugman and Obstfeld, 2003: 621–622). Therefore, we investigate whether deeper integration, assimilation, and tighter rules have had an effect on the economic performance in the analyzed groups of countries. The 2008/2009 and the Eurozone debt crisis have shown the shortcoming of a single currency in Europe and that one monetary policy does not fit all. In this study, we will also analyze if deeper integration leads to faster economic growth and a faster convergence process.
Several studies (presented in the following section) have investigated the convergence process in the EU and in different groups within the Union, such as the old Member States (EU14+1), the new Member States (EU-13), CEE countries, or the Eurozone, during different time periods. They also investigated the effects of the 2008/2009 financial crisis on the convergence process. However, these studies typically consider the period after 2009 as the crisis or post-crisis period, even though EU economies started recovering after 2013. Therefore, we analyze the 2009–2013 period as the crisis period, which is one of the novelties of our research.
While most studies on monetary union have focused on the analysis of the business cycle correlation or asymmetric shocks in the Eurozone, the main objective of this paper is to analyze the effects of monetary union membership on the convergence process in the EU or whether the new Member States that share the common currency converge faster towards the “core” than those that do not. It is important to emphasize that we do not investigate the effects of a single monetary policy on the convergence process, but the effects of the depth of integration. Other objectives are: to analyze the convergence process between different time periods, because it could evidence whether the 2008/2009 financial crisis had a negative impact on the convergence process, and to determine which policies the countries should pursue in order to catch up with the core countries faster.
The research hypotheses, which are based on earlier own research (Siljak, 2018; Siljak and Nagy, 2019) and the following literature review, are tested in the paper:
H1: Monetary union membership has had a positive impact on the convergence process in the EU;
H2: The absolute convergence process of the Eurozone new Member States towards the core countries (EU-14+1) is faster, compared to the non-Eurozone Member States;
H3: The absolute and conditional convergence rates are the lowest during the crisis period for both groups of countries.
The sub-hypotheses are that the new Member States form clusters and that the selected macroeconomic variables are determinants of growth in at least one analyzed period.
The paper is organized as follows: the literature review is presented in Section II, followed by the methodology and data used in this research in Section III. Section IV discusses the empirical findings on absolute and conditional βconvergence. Section V concludes the paper.
II. Literature Review
The optimum currency area theory has contributed to the theory of monetary integration and has been fundamental in the design of EMU (Horvath, 2003: 7). An optimum currency area is defined as a domain within which the exchange rates are fixed (Mundell, 1961: 657).
In order to be an OCA, a monetary union has to fulfill eight factors, most of which were defined in the period 1961–1971: labour mobility (Mundell, 1961), economic openness (McKinnon, 1963), diversification in production and consumption (Kenen, 1969), financial market integration (Ingram, 1969), similarities in inflation rates (Fleming, 1971), wage and price flexibility, fiscal integration, and political integration.
Increased or decreased demand for products from different countries can lead to asym- metric shocks that could be adjusted if countries had an independent monetary policy.
According to De Grauwe (2009), the European Commission’s view is that the shocks will less frequently occur in a monetary union because there is a large degree of intra-industry trade in the EU and most demand shocks will affect the countries in a similar way. On the other hand, Krugman (1991) finds that trade integration will lead to regional concentration of industrial activities (De Grauwe, 2009).
In 1992, Bayoumi and Eichengreen concluded that asymmetric shocks in the European Community (EC) countries had been more evident than among the U.S. states, which might indicate that the EC countries would find it more difficult to operate a monetary union.
In the period 1996–2015, three distinct groups of countries existed in the Eurozone;
the “core”, the “semi-core”, and the “periphery”. While the first two groups displayed a high degree of structural convergence with no or few “strong” shocks, the frequency of asymmetric shocks was much higher in the “periphery” group (Rosati, 2017). Less developed countries will bear more pronouncedly the effects of asymmetric shocks that may occur in an integration zone (Neculita and Micu, 2020) and further integration might generate more symmetric shocks across Europe (Copaciu, 2004). The common currency significantly increased trade among the Eurozone Member States (Berger and Nitsch,
2008). There has been a significant convergence process and political shocks influenced less domestic markets, while foreign markets have become more relevant (Fratzscher and Stacca, 2009). The Eurozone Member States converge and there are signs of increased integration, even though the Eurozone does not fulfill most of the OCA theory criteria (Barbosa and Alves, 2011).
The convergence process in the EU has been confirmed by different studies (Jelnikar and Murmayer, 2006; Matkowski and Prochniak, 2004, 2007; Szeles and Marinescu, 2010;
Staniši´c et al., 2018; Rapacki and Próchniak, 2019; Stoica et al., 2019; Bisciari et al., 2020). However, economic convergence of the analyzed countries does not seem to be a homogeneous process (Cavenaile and Dubois, 2011; Grzelak and Kujaczinska, 2013;
Benczes and Szent-Ivanyi, 2015) because the countries belong to different convergence clubs. The process is slower at the regional level, compared to the national level (Mikuli´c et al., 2013; Głodowska, 2015; Alcidi et al., 2018). The EU, especially the Eurozone Member States, was negatively affected by the 2008/2009 financial crisis. The negative effects of the crisis have been confirmed by several studies (Grela et al., 2017; ˙Zuk and Savelin, 2018; Marelli et al., 2019; Díaz Dapena et al., 2019; Rapacki and Próchniak, 2019; Bisciari et al., 2020), as the countries converged at a slower rate, compared to the pre-crisis period, or did not converge at all.
III. Research Methodology
The analysis of convergence was pioneered by Barro and Sala-i-Martin (1992). Based on the Solow neoclassical growth model (1956), they analyzed the convergence process in the U.S. in the period 1840–1988. The research showed that the states converged at the rate of 2 percent per year, regardless of the time period. Today, the rate of 2 percent is considered a benchmark in the convergence analysis. Convergence occurs when there is a negative relationship between the per capita GDP growth rate and the initial level of per capita GDP. If the relationship is positive, countries diverge. In the literature on economic growth, two concepts of convergence are captured: sigma and beta convergence.
Sigma (σ) convergence measures the dispersion in per capita GDP across countries. Beta (β) convergence is a tendency of poorer countries to grow faster than rich countries, in other words, the poorer countries catch up with the richer ones. There are two types of βconvergence; absolute (unconditional) and conditional convergence. In this research, we focus on the analysis of absolute and conditionalβconvergence.
When it is assumed that countries do not differ in their structures, they converge to the same steady state and convergence is absolute. The β coefficient captures the speed of convergence, the speed at which a country approaches the steady state during one year and it must be negative (β <0). If the coefficient is positive, it indicates divergence. The
βcoefficient is obtained through regression analysis.
In this paper, the classical approach to the convergence analysis presented by Sala-i-Martin (1996) is followed. The absolute and conditional convergence process is analyzed using ordinary least square (OLS) regression based on cross-sectional data. The absolute con- vergence rate is obtained through a simple linear regression model (Equation 1), which
includes one dependent and one independent variable. The dependent variable is per capita GDP growth rate and the independent variable is per capita GDP in purchasing power parity terms (PPP) at the beginning of the analyzed period. Because per capita GDP is expressed in PPP, it is computed in the natural logarithm. In order to test absolute convergence, the following linear-log model is estimated:
Υi.0,T =αi +βlog(Y i,0)+εi (1) where:
β – the convergence coefficient;
Υi.0,T – the average annual growth rate of per capita GDP for countryi;
Yi,0 – per capita GDP at PPP for countryiat the beginning of the analyzed period 0;
αi – a constant;
εi – the stochastic error of the equation;
T – the end of the time interval.
When countries have different structures, they converge towards a different steady state and convergence is conditional. The βcoefficient is obtained through a multiple-regression analysis (Equation 2), which is the augmented absolute convergence model. The dependent variable is the same, the average per capita GDP growth rate, while there are various eco- nomic, socio-political, or institutional independent variables, next to the initial per capita GDP. This research includes four economic and institutional variables: economic openness, the inflation rate, gross fixed capital formation, and the Government Integrity Index:
Υi.0,T =αi +β1log(Yi,0)+β2EOi.0,T +β3Infi,0.T+ (2) +β4GFCFi,0.T+β5GIi,0.T+εi
where:
EO – the economic openness rate;
Inf – the inflation rate;
GFCF – gross fixed capital formation;
GI – the Government Integrity Index.
Theoretically, it is expected that economic openness, gross fixed capital formation, and government integrity will have a positive impact on per capita growth, while the inflation rate is expected to have a negative impact.
Based on the βcoefficient, the half-life of convergence, or the number of years to reduce by half the distance to a common hypothetical steady-state (Rapacki and Próchniak, 2019:
12), is calculates using the following formula (Ibid: 8):
t∗=−log 0.5
β =−0.6931
β (3)
The literature on economic growth and transition is followed (Carmeci and Mauro, 2002;
Yin et al., 2003; Borys et al., 2008; Vojinovi´c et al., 2009; Marelli and Signorelli, 2010;
Szeles and Marinescu, 2010; Ulas¸an, 2012; Dobrinsky and Havlik, 2014; Masuch et al., 2017; ˙Zuk and Savelin, 2018; Rapacki and Próchniak, 2019; Stoica et al., 2019) and the selected macroeconomic variables are related to the transition process and generally used in the convergence analysis.
Sixteen models are estimated in this research; eight absolute and eight conditional conver- gence models. The convergence process is tested for the Eurozone and non-Eurozone new Member States towards the EU-14+1. Table 1 shows the analyzed groups of countries.
Table 1: Analyzed Groups of Countries
Group Member States
Eurozone new Member States Cyprus, Estonia, Malta, Latvia, Lithuania, Slovakia, Slovenia
Non-Eurozone new Member States Bulgaria, Croatia, The Czech Republic, Hungary, Poland, Romania
EU-14+1 (the core) Austria, Belgium, Denmark, Finland, France, Germany, Greece, Ireland, Italy, Luxembourg, The Netherlands, Portugal, Spain, Sweden, The United Kingdom
The analyzed period is 2004 to 2018, with three sub-periods; the pre-crisis period 2004 to 2008, the crisis period 2009 to 2013, and the post-crisis period. The sub-periods are included in the analysis so that it is possible to test whether the recent financial crisis had a negative effect on the convergence process in the analyzed countries. Five-year periods are used because Islam (1995) suggests that shorter periods are feasible, but should not be used because short-term disturbances may appear larger in brief intervals.
We follow the classical approach to the convergence analysis introduced by Sala-i-Martin (1996) and use the cross-sectional data to estimate the convergence rates. In order to investi- gate the relevant model diagnostics, two tests are conducted with all estimated models;
the Breusch-Pagan test, which tests the null hypothesis that the variance of residuals is constant; the Ramsey RESET test, which tests the null hypothesis that a model has no omitted variables. The variance inflation factor (VIF) is used to test for multicollinearity (correlation among independent variables) in the conditional convergence models.
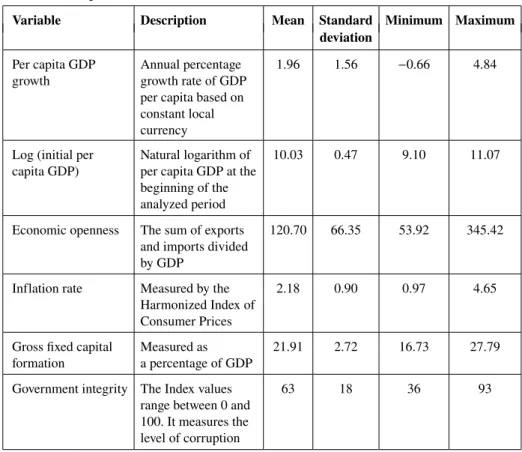
This analysis is based on annual data. Table 2 presents the descriptive statistics of the variables used in the estimation of convergence models in the period 2004–2018. The data set includes twenty-eight countries.
The Eurostat, World Bank, and Heritage Foundation data sets are the main source of data for this research. Data for the per capita GDP growth rate, per capita GDP (in PPP) in 2004 and 2009, and 2014, economic openness, and gross fixed capital formation are obtained from the World Bank database. Data for the inflation rate are derived from the Eurostat database and for the Government Integrity Index from the Heritage Foundation website.
Table 2: Descriptive Statistics
Variable Description Mean Standard Minimum Maximum
deviation Per capita GDP
growth
Annual percentage growth rate of GDP per capita based on constant local currency
1.96 1.56 −0.66 4.84
Log (initial per capita GDP)
Natural logarithm of per capita GDP at the beginning of the analyzed period
10.03 0.47 9.10 11.07
Economic openness The sum of exports and imports divided by GDP
120.70 66.35 53.92 345.42
Inflation rate Measured by the Harmonized Index of Consumer Prices
2.18 0.90 0.97 4.65
Gross fixed capital formation
Measured as a percentage of GDP
21.91 2.72 16.73 27.79
Government integrity The Index values range between 0 and 100. It measures the level of corruption
63 18 36 93
Source: Author’s calculations based on World Bank, Eurostat, and Heritage Foundation data
IV. Results and Discussion
This paper analyzes if monetary union membership affects the convergence process in the EU, that is if countries that are at a higher stage of integration (economic union) converge faster toward the EU core than those at a lower stage (common market). The analyzed period is 2004–2018 with three sub-periods; 2004–2008, 2009–2013, and 2014–2018.
Sixteen convergence models are estimated: eight absolute convergence models (Models 1–8) and eight conditional convergence models (Models 9–16). If countries have similar structures, they will converge towards the same steady state and their convergence will be absolute. To join the Eurozone, the Member States had to fulfill the convergence criteria, therefore it is expected that the absolute convergence process of the Eurozone new Member States will be faster than the process on the non-Eurozone Member States.
Tables 3 and 4 present the regression results for absolute convergence for both groups of countries in the analyzed periods.
Table 3: Absolute convergence of the Eurozone new Member States towards the EU-14+1 Model 1 Model 2 Model 3 Model 4 2004–2018 2004–2008 2009–2013 2014–2018
β β β β
(t) (t) (t) (t)
Log of initial per capita GDP at PPP −2.43*** −4.84*** −1.02 −1.15 (−3.78) (−5.66) (−0.94) (−0.84)
Half-life 28 14 – –
Number of observations 22 22 22 21
Number of panel observations 330 110 110 110
Fstatistics (p-value) 14.31 32.07 0.89 0.95
(0.0012) (0.0000) (0.3562) (0.3410)
R2 0.4170 0.5967 0.0427 0.0338
Breusch-Pagan test 0.5757 0.6745 0.5147 0.0692
Significance codes: *** p<0.01, ** p<0.05, * p<0.1 Source: Authors’ calculations based on World Bank data
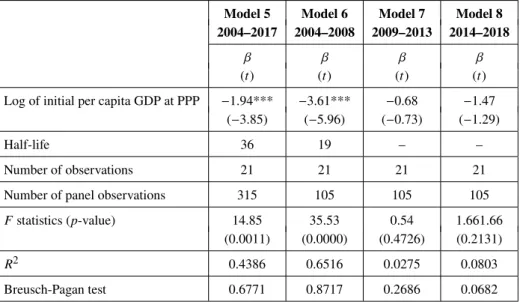
Table 4: Absolute convergence of the non-Eurozone new Member States towards the EU-14+1 Model 5 Model 6 Model 7 Model 8 2004–2017 2004–2008 2009–2013 2014–2018
β β β β
(t) (t) (t) (t)
Log of initial per capita GDP at PPP −1.94*** −3.61*** −0.68 −1.47 (−3.85) (−5.96) (−0.73) (−1.29)
Half-life 36 19 – –
Number of observations 21 21 21 21
Number of panel observations 315 105 105 105
Fstatistics (p-value) 14.85 35.53 0.54 1.661.66
(0.0011) (0.0000) (0.4726) (0.2131)
R2 0.4386 0.6516 0.0275 0.0803
Breusch-Pagan test 0.6771 0.8717 0.2686 0.0682
Significance codes: *** p<0.01, ** p<0.05, * p<0.1 Source: Authors’ calculations based on World Bank data
The regression results show that both groups of countries converge towards the EU-14+1 Member States in the entire and pre-crisis period. Even though the βcoefficients for the crisis and post-crisis periods are negative, they are not statistically significant.
The βcoefficients for both groups of countries for the period 2004–2018 are negative,
−2.43 and −1.89, respectively, and statistically significant at the p-value= 0.0000. In this period, the Eurozone Member States converged towards the EU-14+1 at a rate of 2.43 percent per year. The absolute convergence process in the group is faster than the process of the non-Eurozone Member States (1.94 percent). The half-life of convergence is by 8 years shorter for the Eurozone Member States, indicating that it will take them less time to reduce by half the distance to a common steady-state, compared to the non- Eurozone Member States. Based on the results, it can be inferred that the Eurozone new Member States and the EU-14+1 countries are more similar in their structures than the non-Eurozone Member States.
The enlargement had a positive effect on the economies of the new Member States. Open- ness to trade and investment, improvement in the institutional environment, access to foreign finance from EU cohesion funds, and structural reforms accelerated per capita growth in the countries (Rapacki and Próchniak, 2019). The convergence rates for the pre- crisis period are higher than for the entire analyzed period; 4.84 percent for the Eurozone Member States and 3.61 percent for the non-Eurozone Member States. Based on the rates, we can estimate that the half-life of convergence was 14 and 19 years for the two groups of countries, respectively. Comparing the pre-crisis and crisis convergence rates, it can be concluded that the 2008/2009 financial crisis had a negative impact on the convergence process in both groups because the countries do not converge in the period 2009–2013, nor did they start to catch up in the post-crisis period. The negative effects of the crisis on the convergence process are confirmed by Staniši´c (2012), Stoica et al. (2019), Marelli et al. (2019), and Novac and Moroianu-Dumitrescu (2020). The financial crisis brought a reduction in per capita GDP growth and, as a result, the convergence process was slower (Cabral and Castellanos-Sosa, 2019) or the countries even started diverging (Merler, 2016;
Bisciari et al., 2020). The Eurozone Member States converge faster towards the EU-14+1 than the non-Eurozone Member States in both analyzed periods. Therefore, there is not sufficient evidence to reject the second research hypothesis.
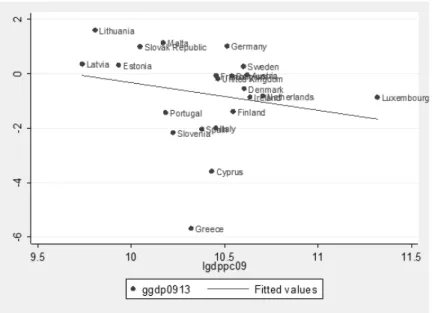
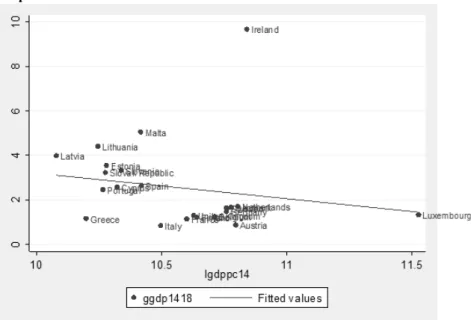
Even though the problem of heteroscedasticity is not detected in any of the estimated models, there is a relatively weak fit of Models 3, 4, 7, and 8 to data. The coefficients of determination in these models have low values. Figures 3–6 (Appendix) show a high degree of heterogeneity in the analyzed groups in the crisis and post-crisis period, as the countries are more scattered around the line of fitted values, which is consistent with low R-squared values.
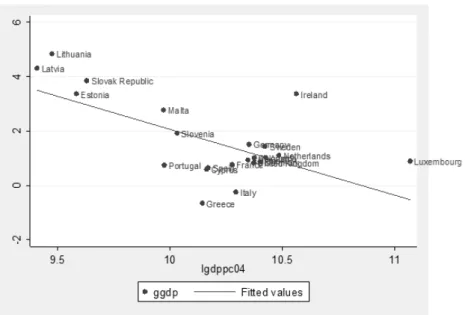
Figures 1 and 2 plot per capita GDP at the beginning of the analyzed time period (X-axis) and the average per capita GDP growth rate in the period 2004–2018 (Y-axis). The Figures indicate convergence for both groups of countries because the regression lines have down- ward slopes and show a negative relationship between the variables.
Figure 1: Absolute convergence of the Eurozone new Member States towards the EU-14+1 in the period 2004–2018
Source: Authors’ calculations based on World Bank data
Figure 2: Absolute convergence of the non-Eurozone Member States towards the EU-15 in the period 2004–2018
Source: Authors’ calculations based on World Bank data
Figure 1 indicates that there is a high degree of heterogeneity and that the Eurozone new Member States do not form a cluster. Estonia, Latvia, Lithuania and Slovakia form the best performing club. These countries had the lowest per capita GDPs in 2004, but they achieved the highest average growth rates in the analyzed period (4.1 percent). Malta and Slovenia are mid-way between the best performing club and the EU-14+1 Member States.
Cyprus converges with the EU-14+1 countries that had the lowest growth rates; France, Greece, Italy, Portugal, and Spain. The cluster’s average per capita growth rate in the analyzed period was 0.3 percent. The remaining EU-14+1 countries form a cluster, while Ireland and Luxembourg are outliers. Luxembourg’s per capita GDP is 2.5 times higher than the EU-28 average and Ireland’s per capita growth rate is close to the best performing club’s average, 3.4 percent.
Figure 2 shows that the non-Eurozone Member States form two clusters. The best perform- ing cluster is formed by Bulgaria, Poland, and Romania, with the average per capita growth rate of 4.3 percent in the period 2004–2018. Croatia, the Czech Republic, and Hungary are positioned between the poorer new Member States and the EU-14+1 Member States.
Their average growth rate is 2.2 percent in the analyzed period.
If countries differ in their structures; if they have different trade patterns, investment levels, inflation rates, quality of institutions, levels of unemployment, general government debt, etc., they will converge towards different steady states and their convergence process will be conditional. Tables 5 and 6 present the conditional convergence rates and determinants of per capita growth in the analyzed groups of countries.
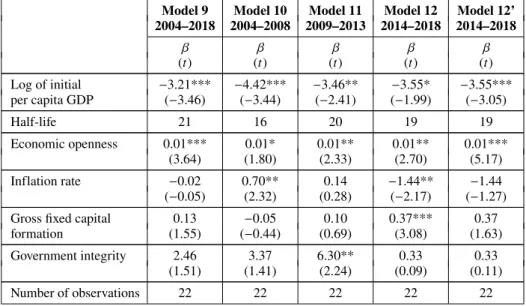
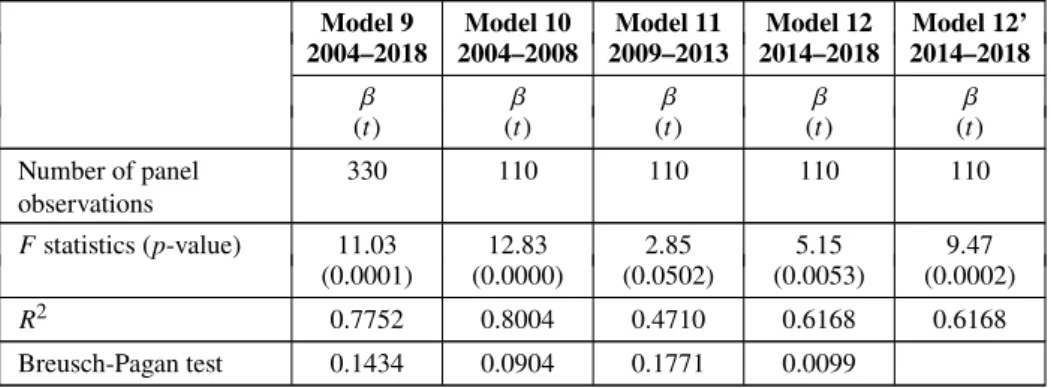
Table 5: Conditional convergence process of the Eurozone new Member States towards the EU-14+1
Model 9 Model 10 Model 11 Model 12 Model 12’
2004–2018 2004–2008 2009–2013 2014–2018 2014–2018
β β β β β
(t) (t) (t) (t) (t)
Log of initial −3.21*** −4.42*** −3.46** −3.55* −3.55***
per capita GDP (−3.46) (−3.44) (−2.41) (−1.99) (−3.05)
Half-life 21 16 20 19 19
Economic openness 0.01*** 0.01* 0.01** 0.01** 0.01***
(3.64) (1.80) (2.33) (2.70) (5.17)
Inflation rate −0.02 0.70** 0.14 −1.44** −1.44
(−0.05) (2.32) (0.28) (−2.17) (−1.27)
Gross fixed capital 0.13 −0.05 0.10 0.37*** 0.37
formation (1.55) (−0.44) (0.69) (3.08) (1.63)
Government integrity 2.46 3.37 6.30** 0.33 0.33
(1.51) (1.41) (2.24) (0.09) (0.11)
Number of observations 22 22 22 22 22
Continued on next page
Model 9 Model 10 Model 11 Model 12 Model 12’
2004–2018 2004–2008 2009–2013 2014–2018 2014–2018
β β β β β
(t) (t) (t) (t) (t)
Number of panel observations
330 110 110 110 110
Fstatistics (p-value) 11.03 12.83 2.85 5.15 9.47
(0.0001) (0.0000) (0.0502) (0.0053) (0.0002)
R2 0.7752 0.8004 0.4710 0.6168 0.6168
Breusch-Pagan test 0.1434 0.0904 0.1771 0.0099
Significance codes: *** p<0.01, ** p<0.05, * p<0.1
Source: Authors’ calculations based on World Bank, Eurostat, and Heritage Foundation data
Table 6: Conditional convergence process of the non-Eurozone new Member States towards the EU-14+1
Model 13 Model 14 Model 14’ Model 15 Model 16 Model 16’
2004–2018 2004–2008 2004–2008 2009–2013 2014–2018 2014–2018
β β β β β β
(t) (t) (t) (t) (t) (t)
Log of initial −3.45*** −4.39*** −4.39*** −3.73** −1.91 −1.91 per capita GDP (−3.87) (−3.12) (−3.88) (−2.28) (−0.97) (−0.95)
Half-life 20 16 16 18 – –
Economic 0.01*** 0.01* 0.01** 0.01 0.01 0.01**
openness (3.02) (1.93) (2.26) (1.43) (1.53) (2.31)
Inflation rate −0.18 0.16 0.16 0.14 −1.84** −1.84
(−0.53) (0.56) (0.51) (0.39) (−2.22) (−1.29)
Gross fixed 0.14* 0.04 0.04 0.12 0.36*** 0.36*
capital formation (1.82) (0.39) (0.45) (1.02) (3.19) (1.83)
Government 2.99* 2.04 2.04 7.25** −0.51 −0.51
integrity (1.99) (0.98) (1.29) (2.76) (−0.14) (−0.17)
Number of observations
21 21 21 21 21 21
Number of panel observations
315 105 105 105 105 105
Fstatistics 10.03 11.04 10.90 2.54 4.90 4.64
(p-value) (0.0002) (0.0001) (0.0001) (0.0744) (0.0074) (0.0093)
R2 0.7716 0.7863 0.7863 0.4581 0.6203 0.6203
Breusch-Pagan test
0.3560 0.0.324 0.3780 0.0327
Significance codes: *** p<0.01, ** p<0.05, * p<0.1
Source: Authors’ calculations based on World Bank, Eurostat, and Heritage Foundation data
The regression results show that the Eurozone new Member States converge towards the EU-14+1 group in every analyzed period. The non-Eurozone Member States do not converge on in the post-crisis period. The absolute convergence process is faster for the Eurozone new Member States, as well as the conditional convergence process in the pre- crisis period, compared to the non-Eurozone Member States. The Eurozone new Member States converge in the post-crisis period faster compared to the crisis period, indicating that they started catching up after the 2008/2009. Therefore it can be concluded that the Eurozone new Member States have more similar structures as the EU-14+1 group and that the OCA criteria fulfillment will lead to similar structural levels and structural convergence.
The problem of herteroscedasticity occurs in three models, Models 12, 14, and 16. When the models with the heteroscedasticity robust standard error (Models 12’, 14’, and 16’) are estimated, the determinants of growth change, but the convergence rates remain unchanged.
The included macroeconomic variables are determinants of growth in at least one analyzed period. The problem of multicollinearity has not been detected.
Economic openness is the second criterion of the OCA theory and it was suggested by McKinnon (1963) because the policy of completely fixed exchange rates would be optimal for an open economy. He defines economic openness as the ratio of tradable to non-tradable goods (McKinnon, 1963: 719), while in this analysis we calculated the economic openness rate as the sum of exports and imports, as a percentage of GDP.
One of the main benefits of joining the EU is access to the single market and free trade.
As mentioned, trade was restricted in socialism. After the transition process started, the countries found themselves in a situation where they were not competitive enough to sell the products in the Western market, as they were of low quality. However, with the help from the EU pre-accession funds and foreign direct investment, the countries started producing capital-intensive instead of labour-intensive products and there was trade creation instead of trade diversion after they joined the EU (European Commission, 2009). Economic openness had a positive effect on the conditional convergence process in both groups of countries. The results of this research are confirmed by Rapacki and Próchniak (2009), Szeles and Marinescu (2010), Popovic et al. (2020). The EU Member States are open economies, with the economic openness rates ranging from 53.9 percent in Italy to 345.4 percent in Luxembourg. On average, the non-Eurozone new Member States are less open than the Eurozone new Member States (110 percent and 139 percent, respectively), but their economic openness rate increased between the pre-crisis and post- crisis periods by 22 percentage points and 24 percentage points, respectively. According to the European Commission (2020c), both groups of new Member States mostly export to other EU countries. Germany is among the top three trade partners for all countries, except Estonia. Intra-EU exports, which has doubled in the period 2002–2020, comprises more than 60 percent of total exports for all CEE countries. The lowest growth rate of intra-EU exports was in Hungary, 6.5 percent, while the highest was in Latvia, 10.7 percent. In the EU, the rate ranged between 1.8 percent in France and 11.7 percent in Cyprus (even though Cyprus’ extra-EU exceeds intra-EU exports). There is no distinct trend between the two groups of countries. The countries with the highest intra-EU exports growth rates
are Bulgaria, Cyprus, Latvia, Lithuania, and Poland, both Eurozone and non-Eurozone Member States.
Similarities in inflation rates are another OCA criterion. When inflation rates between countries are similar over time, then terms of trade will remain fairly stable (Fleming, 1971). In order to join the Eurozone, a country has to fulfill the convergence criterion on price stability that its inflation rate must not exceed 1.5 percentage points of the average of the three EU Member States with the lowest inflation rates (European Commission, 2020a). During socialism, all prices were artificially fixed and determined by the central government. After the transition process started, the CEE countries faced hyperinflation because the prices were liberalized and determined according to the law of supply and demand. The prices started stabilizing in the mid-1990s. The new Member States still have a higher average inflation rate, compared to the EU14+1 group, therefore the fulfillment of the convergence criterion on price stability is of extreme importance for the functioning of the Eurozone. This research has shown that the inflation rate can have both positive and negative effects on per capita GDP growth. Theoretically, it should have a negative effect, as confirmed by Yin et al. (2003), Vojinovi´c et al. (2009), Stoica et al. (2019), and Siljak and Nagy (2019), but low, stable inflation is always desirable. Its positive effects on growth are found by Hasanov (2010) and Kryeziu and Durguti (2019). The two groups of new CEE countries have almost identical average inflation rates in the analyzed period (2.95 percent and 2.96 percent) and they are almost twice as high as the rate in the EU-14+1 (1.7 percent). The rates decreased from 5.2 percent in the non-Eurozone new Member States and 5.5 percent in the Eurozone new Member States in the pre-crisis period to 0.6 percent and 1.1 percent in the post-crisis period, respectively. In 2019, the only two new Member States that did not exceed the reference value of the convergence criterion on price stability (2 percent) were Slovenia and Croatia.
Gross fixed capital formation or “investment” consists of resident producers’ acquisitions, less disposals, of fixed assets during a given period plus certain additions to the value of non-produced assets (European Commission, 2021). Theoretically, investment has a posi- tive effect on growth, which is confirmed by Borys et al. (2008), Vojinovi´c et al. (2009), and Siljak (2018). It should increase during the expansion and decrease during a crisis.
This research has shown that investment is a determinant of growth only for the non- Eurozone Member States. The two groups of the new Member States have very similar investment rates (23.4 percent for the non-Eurozone and 23.8 percent for the Eurozone Member States), while the rate for the EU-14+1 group is lower, 20.9 percent. Between the pre-crisis and post-crisis periods, the investment decreased in the EU. The biggest drop was in the Eurozone new Member States, 7.8 percentage points, followed by a drop of 4.4 percentage points in the non-Eurozone Member States. The investment decreased by 2.5 percentage points in the EU14+1 group. The United Kingdom is the country with the lowest average investment rate in the analyzed period, 16.7 percent, and the highest rate is in Estonia, 27.8 percent.
A lack of institutional framework during socialism led to a higher corruption level in the new Member States, compared to the old Member States. In this analysis, we use the Government Integrity Index to analyze corruption. The lower values of the Index
indicate a more corrupt country. The Government integrity Index can be used as a proxy to measure political integration, one of the OCA criteria. It is expected that government integrity will have a positive effect on economic growth because the quality of institutions is more important than geography or trade when it comes to explaining the difference in income among countries (Rodrik et al., 2004). A higher level of institutional development is associated with higher levels of per capita GDP the new Member States of the EU (Buterin et al., 2017: 1590). Former socialist countries that joined the EU have benefited from strong institutional change and performance compared to transition countries (Aralica et al., 2018). Countries that were in socialism longer have worse property rights institutions and more corruption (Uberti, 2018), which has been confirmed in the case of the Western Balkan countries where institutions have a negative impact on GDP growth, indicating that the quality of institutions is not sufficient to stimulate economic growth, but it slows it down (Popovic et al., 2020: 173). This research has confirmed that government integrity has a positive effect on economic growth in the analyzed groups of countries. The non- Eurozone new Member States have a lower average Index value (43), compared to the Eurozone new Member States (53.2) and the EU-14+1 group (74.5). However, they have recorded the largest increase between the pre-crisis and post-crisis period, 7.8 percentage points, compared to an increase of 5.6 percentage points in the Eurozone new Member States. The Index value decreased by 4.6 percentage points in the EU-14+1 group.
The convergence rates in both groups of countries were lower during the crisis period and it can be concluded that the 2008/2009 crisis had a negative effect on the process. Therefore, we cannot reject the third research hypothesis. This research has shown that monetary union membership, namely deeper integration, has a positive effect on the convergence process, as the Eurozone new Member States converged faster the EU-14+1 group in almost all analyzed periods, compared to the non-Eurozone new Member States. They started catching up in conditional terms in the post-crisis period. Based on the results, there is no sufficient evidence to reject the first research hypothesis.
V. Conclusion
This paper investigates the convergence process of two groups of the EU new Member States, the countries that have adopted the euro as their currency and the countries that have not, towards the fifteen old Member States (EU-14+1). The analyzed period is 2004–2018 with three sub-periods; the pre-crisis period, 2004–2008, the crisis period, 2009–2013, and the post-crisis period. Two types of βconvergence are analyzed, absolute (unconditional) and conditional convergence.
The empirical results suggest that the absolute convergence process of the Eurozone new Member States towards the EU-14+1 is faster compared to the non-Eurozone countries in the entire analyzed period and the pre-crisis period, indicating that the Eurozone new Member States and the EU-14+1 countries are more similar in their structures and that monetary union membership, hence deeper integration, has a positive effect on the convergence process. The βcoefficients for the crisis and post-crisis periods are negative for both groups of countries, but they are not statistically significant, indicating that the 2008/2009 crisis had a negative effect on the convergence process.
The negative effects of the 2008/2009 crisis on the conditional convergence process in the two analyzed groups have been identified. According to the regression results, the conditional convergence rates were the highest during the pre-crisis period, but they decreased during the crisis period. The Eurozone new Member States is the only analyzed group that started catching up with the EU-14+1 group in the post-crisis period, again indicating the benefits of deeper integration. Based on the results, there is not sufficient evidence to reject neither research hypothesis.
All selected macroeconomic variable affect per capita growth in at least one analyzed period. Economic openness, investment, and government integrity have a positive impact on per capita growth, which is as expected, while inflation has both positive and negative impact.
This research could have been extended to the analysis of political integration, which is the last stage of integration. We attempted to do so and we included the other two components of the Heritage Foundation’s Rule of Law Index, Property Rights Index and Judicial Effectiveness Index. However, the problem of multicollinearity occurred and we had to exclude the variables from the analysis. This is the main limitation of this study.
In the future, the effects of the Covid-19 crisis on the convergence process should be investigated and compared to the effects of the 2008/2009 crisis.
Empirical results can serve as a useful recommendation for policymakers when they are deciding on strategies that should promote economic growth. The new Member States did not start to catch up on their own. Their transition process was more successful with the EU’s help and access to the single market, increased trade, investment, and institutional and structural changes led to higher economic growth in the years after the enlargement.
As this research has shown, the more integrated group of countries converges faster. The results also imply that both groups of countries should maintain or improve the level of economic openness, investment, and institutional effectiveness, while the Eurozone new Member States should stabilize the inflation rate.
References
Alcidi, C., Nú˜nez Ferrer, J., Di Salvo, M., Pilati, M. and Musmeci, R. (2018). Income Convergence in the EU: A tale of two speeds. CEPS Commentary, 9 January 2018.
Aralica, Z, Svilokos, T. and Bacic, K. (2018). Institutions and Firms’ Performance in Transition Countries: The Case of Selected CESEE Countries. South East European Journal of Economics and Business, 13(1), 68–80.
Balassa, B. (1961). The purchasing-power parity doctrine: a reappraisal.Journal of polit- ical Economy, 72(6), 584–596.
Barbosa, J. R. and Alves, R. H. (2011).Divergent competitiveness in the Eurozone and the optimum currency area theory. FEP Working Papers No 436.
Barro, R. J. and Sala-i-Martin, X. X. (1992). Convergence.Journal of political Economy, 100(2), 223–251.
Bayoumi, T. and Eichengreen, B. (1992).Shocking aspects of European monetary unifi- cation. National Bureau of Economic Research.
Benczes, I. and Szent-Ivanyi, B. (2015). The European economy in 2014: Fragile recovery and convergence.Journal of Common Market Studies, 53, 162–181.
Berend, I. T. (2016).An economic history of twentieth-century Europe: Economic regimes from laissez-faire to globalization. Cambridge University Press.
Berger, H. and Nitsch, V. (2008). Zooming out: The trade effect of the euro in historical perspective.Journal of International Money and Finance, 27(8), 1244–1260.
Bisciari, P., Essers, D. and Vincent, E. (2020). Does the EU convergence machine still work?.National Bank of Belgium, NBB Economic Review. June 2020.
Borys, M. M., Polgár, É. K. and Zlate, A. (2008). Real convergence and the determinants of growth in EU candidate and potential candidate countries-a panel data approach.ECB Occasional PaperNo. 86.
Buterin, V., Škare, M. and Buterin, D. (2017). Macroeconomic model of institutional reforms’ influence on economic growth of the new EU members and the Republic of Croatia.Economic research – Ekonomska istraživanja, 30(1), 1572–1593.
Cabral, R. and Castellanos-Sosa, F. A. (2019). Europe’s income convergence and the latest global financial crisis.Research in Economics, 73(1), 23–34.
Carmeci, G. and Mauro, L. (2002). The Convergence of the Italian Regions and Unem- ployment: Theory and Evidence.Journal of Regional Science, 42(3), 509–532.
Cavenaile, L. and Dubois, D. (2011). An empirical analysis of income convergence in the European Union.Applied Economics Letters, 18(17), 1705–1708.
Copaciu, M. (2004). Asymmetric Shocks Across European Monetary Union: Can Labor Mobility Act as an Adjustment Mechanism?.Central European University.
De Grauwe, P. (2009).Economics of the monetary union. Oxford University Press.
Díaz Dapena, A., Rubiera-Morollon, F. and Paredes, D. (2019). New approach to eco- nomic convergence in the EU: a multilevel analysis from the spatial effects perspective.
International Regional Science Review, 42(3–4), 335–367.
Dobrinsky, R. and Havlik, P. (2014).Economic convergence and structural change: The role of transition and EU accession. Wiener Institut für Internationale Wirtschaftsverglei- ched.
European Commission (2009).Five Years of an Enlarged EU. Economic Achievements and Challenges. European Economy. Luxembourg.
European Commission (2020a).Convergence Report. Institutional Paper 129. June 2020.
Retrieved from https://ec.europa.eu/info/sites/info/files/economy-finance/ip129 en.pdf.
European Commission (2020b).Eurostat Database. Retrieved from www.ec.europa/Euro- stat.
European Commission (2020c).Intra-EU Trade in Goods – Main Features. April 2020.
Retrieved from https://ec.europa.eu/eurostat/statistics-explained/index.php?title=Intra-EU trade in goods - main features.
European Commission (2021). Gross fixed capital formation, volumes. Retrieved from https://ec.europa.eu/eurostat/web/products-datasets/-/teina041.
Fleming, J. M. (1971). On exchange rate unification. The Economic Journal, 81(323), 467–488.
Fratzscher, M. and Stracca, L. (2009). The political economy under monetary union: Has the euro made a difference?.Economic Policy, 24(58), 307–348.
Głodowska, A. (2015). Beta and Sigma Convergence within the European Union Countries and Regions. Paper presented at the6th Global Conference on Management in Recovering Markets, Maribor.
Grela, M., Majchrowska, A., Michałek, T., Mu´ck, J., Stą˙zka-Gawrysiak, A., Tchorek, G.
and Wagner, M. (2017).Is Central and Eastern Europe converging towards the EU-15?.
Narodowy Bank Polski, Education & Publishing Department.
Grzelak, A. and Kujaczy´nska, M. (2013). Real convergence of the European Union mem- bers states – evaluation attempt.Management, 17(1), 393–404.
Hasanov, F. (2010). Relationship between Inflation and Economic Growth in Azerbaijani Economy: Is there any Threshold Effect?.Asian Journal of Business and Management Sciences, 1(1), 1–11.
Heritage Foundation (2020).Index of Economic Freedom. Retrieved from https://www.her- itage.org/index/explore.
Horvath, J. (2003). Optimum currency area theory: A selective review.BOFIT Discussion Papers, No. 15/2003, Helsinki.
Ingram, J. (1969). Comment: The Currency Area Problem. InMonetary Problems in the International Economy, University of Chicago Press.
Islam, N. (1995). Growth empirics: a panel data approach.The quarterly journal of eco- nomics, 110(4), 1127–1170.
Jelnikar, E. and Murmayer, U. (2006). Convergence in Europe Empirical Analysis on Two Groups of Countries of the European Union. Paper presented at the International Conference on Human and Economic Resources Proceedings Book, Izmir.
Kenen, P. (1969). The theory of optimum currency areas: an eclectic view. Monetary problems of the international economy, 45(3), 41–60.
Krugman, P. R. (1991).Geography and trade. MIT press.
Krugman, P. and Obstfeld, M. (2003). International Economics: Theory and Policy.
Addison Wesley.
Kryeziu, N. and Durguti, E. A. (2019). The Impact of Inflation on Economic Growth.
International Journal of Finance & Banking Studies, 8(1), 01–09.
Marelli, E. and Signorelli, M. (2010). Institutional, nominal and real convergence in Europe.Banks and bank systems, 5(2), 140–155.
Marelli, E., Parisi, M. L. and Signorelli, M. (2019). Economic convergence in the EU and Eurozone.Journal of Economic Studies, 46(7), 1332–1344.
Masuch, K., Moshammer, E. and Pierluigi, B. (2017). Institutions, public debt and growth in Europe.Public sector economics, 41(2), 159–205.
Matkowski, Z. and Próchniak, M. (2004). Real economic convergence in the EU accession countries.International Journal of Applied Econometric and Quantitative Studies, 1(3), 5–38.
Matkowski, Z. and Próchniak, M. (2007). Economic convergence between the CEE-8 and the European Union.Eastern European Economics, 45(1), 59–76.
McKinnon, R. I. (1963). Optimum currency areas.The American economic review, 53(4), 717–725.
Merler, S. (2016).Income convergence during the crisis: did EU funds provide a buffer?.
Bruegel Working Paper No. 2016/06, Bruegel, Brussels.
Mikuli´c, D., Lovrinčevi´c, Ž. and Nagyszombaty, A. G. (2013). Regional convergence in the European Union, new member states and Croatia. South East European Journal of Economics and Business, 8(1), 9–21.
Mundell, R. A. (1961). A theory of optimum currency areas. The American economic review, 51(4), 657–665.
Neculita, M. and Micu, A. (2020). European Monetary Union. Convergences and Diver- gences in an Optimum Currency Area.Annals of the University Dunarea de Jos of Galati:
Fascicle: I, Economics & Applied Informatics, 26(1), 177–184.
Novac, A. and Moroianu-Dumitrescu, N. (2020). Convergence of the two intra-EU regional markets.Revista Rom ˆan˘a de Statistic˘a-Supliment, 5, 203–216.
Palánkai, T. (2010). Evaluation of the EU membership of the new member states.Köz- gazdaság, 5(3), 9–23.
Popovic, G., Eric, O. and Stanic, S. (2020). Trade Openness, Institutions and Economic Growth of the Western Balkans Countries. Montenegrin Journal of Economics, 16(3), 173–184.
Rapacki, R. and Próchniak, M. (2009). Real beta and sigma convergence in 27 transition countries, 1990–2005.Post-Communist Economies, 21(3), 307–326.
Rapacki, R. and Prochniak, M. (2019). EU membership and economic growth: empirical evidence for the CEE countries.The European journal of comparative economics, 16(1), 3–40.
Rodrik, D., Subramanian, A. and Trebbi, F. (2004). Institutions rule: the primacy of insti- tutions over geography and integration in economic development.Journal of economic growth, 9(2), 131–165.
Rosati, D. K. (2017). Asymmetric Shocks in the Euro Area: Convergence or Divergence?.
International Journal of Management and Economics, 53(3), 7–25.
Sala-i-Martin, X. X. (1996). The classical approach to convergence analysis.The economic journal, 106(437), 1019–1036.
Siljak, D. (2018). Beta Convergence among Former Socialist Countries.South East Euro- pean Journal of Economics and Business, 13(2), 72–83.
Siljak, D. and Nagy, S. Gy. (2019). Do transition countries converge towards the European union?.Baltic Journal of European Studies, 9(1), 115–139.
Staniši´c, N. (2012). The effects of the economic crisis on income convergence in the European Union.Acta Oeconomica, 62(2), 161–182.
Staniši´c, N., Makojevi´c, N. and ´Curči´c Milutinovi´c, M. (2018). The EU Enlargement and Income Convergence: Central and Eastern European Countries vs. Western Balkan Countries.Entrepreneurial Business and Economics Review, 6(3), 29–41.
Solow, R. M. (1956). A contribution to the theory of economic growth. The quarterly journal of economics, 70(1), 65–94.
Stoica, O., Roman, A. and Diaconas¸u, D. E. (2019). Real Convergence and European Integration with Focus on the New Member States.Scientific Annals of Economics and Business, 66, 215–228.
Szeles, M. R. and Marinescu, N. (2010). Real convergence in the CEECs, euro area acces- sion and the role of Romania.The European Journal of Comparative Economics, 7(1), 181–202.
Uberti, L. J. (2018). Corruption in transition economies: Socialist, Ottoman or structural?.
Economic Systems, 42(4), 533–555.
Ulas¸an, B. (2012).Openness to international trade and economic growth: a cross-country empirical investigation. Economics Discussion Paper, No. 2012–25, Kiel Institute for the World Economy (IfW), Kiel.
Vojinovi´c, B., Acharya, S. and Próchniak, M. (2009). Convergence analysis among the ten European transition economies.Hitotsubashi Journal of Economics, 50(2), 123–141.
Yin, L., Zestos, G. K. and Michelis, L. (2003). Economic convergence in the European Union.Journal of Economic Integration, 18(1), 188–213.
World Bank (2020).World Development Indicators Database. Retrieved from www.data- bank.worldbank.org.
Zuk, P. and Savelin, L. (2018).˙ Real convergence in central, eastern and south-eastern Europe. European Central Bank Occasional Paper Series No 212.
Appendix
Figure 3: Absolute convergence of the Eurozone new Member States towards the EU-14+1 in the period 2009–2013
Source: Authors’ calculations based on World Bank data
Figure 4: Absolute convergence of the non-Eurozone new Member States towards the EU-14+1 in the period 2009–2013
Source: Authors’ calculations based on World Bank data
Figure 5: Absolute convergence of the Eurozone new Member States towards the EU-14+1 in the period 2014–2018
Source: Authors’ calculations based on World Bank data
Figure 6: Absolute convergence of the non-Eurozone new Member States towards the EU-14+1 in the period 2014–2018
Source: Authors’ calculations based on World Bank data