E X P L O R A T I O N O F THE A T M O S P H E R E O F VENUS W I T H A S M A L L P A Y L O A D
Robert L. Sax Hughes Aircraft Company-
Space Systems Division Culver City, California
Abstract
Data is acquired by a proposed small payload dropping through the atmosphere at subsonic velocity after total r e entry deceleration. Transducers which are presently avail
able a r e used to measure physical parameters during the fifteen minute to one-half hour time of descent to the surface of the planet. The observations, and derived meteorological and physical information, are related to elevation above the surface of the planet.
Introduction
The mission capability of a one-pound meteorological sounding rocket, launched from space and dropped through the atmosphere at subsonic velocity after total re-entry de
celeration, is discussed in detail. The instrument capsule is designed to be aerodynamic ally stable, to be rotated at a period less than the sampling period for each sensor, to be carried through the re-entry phase in a nose cone with a W / C j } A of about ten, and to be launched from a Venus probe which is on a n e a r - m i s s hyperbolic trajectory. The mission of directly sampling the atmosphere of Venus would be coordi
nated with observations in the terrestrial space of Venus, although this important phase is beyond the scope of this paper.
A prior analysis of Venus entry disclosed that a one- pound payload could be landed on Venus with a total system weight of approximately ten pounds. The engineering design requirements for performance of an injection into the planet of such an entry vehicle, allowing for transmission of the measurements back to the mother vehicle, w e r e found to be easily within the present state of the art for designing nose cones, missile launching mechanisms, and communication sys
tems, and for utilizing the guidance and control system of a
SIXTH SYMPOSIUM ON BALLISTIC MISSILE AND AEROSPACE TECHNOLOGY
planetary probe. These engineering aspects of the problem are discussed in another paper (1).
The purpose of this paper is to show that the data ob
tained, using presently developed sensors, is sufficient to support a nearly complete analysis of the physical and chemi
cal structure of the atmosphere of Venus below the cloud layer, so that one or more of such probes launched from a space vehicle on a near-miss mission could be used for a complete analysis of the lower atmosphere of Venus.
Choice of Instrumentation
The instrumentation to be included in the capsule must meet several criteria. F i r s t , the measurement must be sig
nificant scientifically; second, the transducers and signal conditioning circuitry must be within present day state of the art; and third, the instrument must weigh less than several ounces. Within this framework, various measurements w e r e considered as tentative payload components, and the follow
ing profiles will be directly observed:
ο P r e s s u r e ο Speed of sound ο Temperature
ο Drag deceleration of the vehicle ο Light intensity
ο Collimated light intensity
ο Change in physical parameters of selected materi
als due to the effect of an atmospheric constituent.
Using thermodynamic relationships and basic physical formu
lae, additional quantities are derived which are useful in in
terpreting the physical structure of the atmosphere. These quantities are:
ο Average molecular weight of the gas ο Average specific heat of the gas
ο Elevation change between measurements ο Sea level p r e s s u r e and temperature ο Density - elevation profile
ο Temperature - elevation profile ο P r e s s u r e - elevation profile
ο Relative humidity - elevation profile ο Wind magnitude - elevation profile ο Wind direction - elevation profile
ο Attenuation of light passing through the clouds and atmosphere
ο Dependence of intensity of forward scattered light on the angle of a collimator axis from an axis pointing toward the sun
ο Vertical distribution of clouds, haze, or dust ο Zenith distance
ο Entry angle ·
Some of the important implications of the observations relate to the gas composition of the atmosphere, existence of moisture, weather, heat balance, wind circulation, climate, and conditions at the surface of the planet.
Quantity and Accuracy of Measurements
The telemetry system will sample each sensor at equal intervals of approximately 13 seconds. The instantaneous sensor output will be subject to considerable variation due to possible turbulant air mass movements. Consequently, quan
tities such as vehicle deceleration, air p r e s s u r e , and air temperature may be averaged over all or part of the sampling interval in order to remove random fluctuations, and to insure that the transmitted sample is representative of conditions during the sampling interval. In some cases, i . e . , p r e s s u r e , it is necessary to use several transducers to accurately cover the probable range of values to be measured. By switching from the low maximum pressure sensor to the high maximum pressure sensor at the appropriate time, only one channel is required to transmit the information of both sensors.
A pulse position modulation scheme is used to transmit the data. For a given uncertainty in position of an information pulse (and hence system bandwidth) the accuracy of data is inversely proportional to the frame time; i. e., the lower the sampling rate the more accurately each sample can be deter
mined. At least two percent accuracy can be obtained by the telemetry system.
The descent time is expected to be approximately fifteen to twenty minutes during which time approximately one hundred measurements per sensor are transmitted. The geo
metric spacing of the data points depends on the velocity of the vehicle, which may vary between several hundred fps at high altitude to about 20 fps near the surface. If each instru
ment is sampled every ten seconds, the displacement of the vehicle between samples decreases to approximately 400 feet.
By increasing the sampling interval to 20 sec, up to 1 percent measurement accuracy can be attained. The data can be used to determine parameters by curve fitting to considerably less e r r o r . By doubling the sampling period, the sampling rate of a sensor is reduced to one-half. The number of measurements transmitted to the fly-by vehicle is reduced or more channels are sampled at the expense of a larger commutator.
SIXTH SYMPOSIUM ON BALLISTIC MISSILE AND AEROSPACE TECHNOLOGY
Transducers
Since a commutated data system is being considered, the number of transducers sampled is limited not only by size and weight restrictions but by the amount of time between samples of a given transducer. Analysis of the communi- cation system indicates that 11 channels appear reasonable at this time, although a small increase or decrease in this
number would have little effect on the o v e r - a l l system (1). The transducers under consideration are briefly described Êëlow.
Linear Accelerometers. A linear accelerometer is used with a range of + 5 g. The instrument has full scale out- put of about 25 mv, an accuracy of one percent of full scale, and weighs approximately one ounce. Modest development is required to enable it to survive the entry deceleration of up to 450 g. The peak acceleration is integrated so that an average peak acceleration over each frame period is obtained.
Light Intensity. Light intensity can be measured by measuring the output of phototransistors. The cells are insu- lated from the atmosphere so that high atmospheric temper- atures will not inactivate them. The weight is only a few grams and measurements of light intensity can be made to better than one percent.
Temperature. Temperature is measured from -50°to + 300 C using a resistance-type element weighing about one oz.
Static P r e s s u r e . The static atmospheric pressure must be measured over a dynamic range possibly as great as four orders of magnitude with a maximum of 150 psi. Two transducers are required, a low-range instrument and a high- range instrument, and both would be of the diaphragm, strain- gage bridge type. These instruments would be capable of operating in the high ambient temperature.
Sound Velocity. Sound velocity is measured by driving a diaphragm at one end of a short tube with positive feedback from a receiver at the other end of the tube. At this point the load on the driver increases and the driver current increases, indicating resonance. The resonant frequency is detected in the audio range using a discriminator. At resonance both the wavelength and frequency are known, and the velocity is deter- mined. The device is readily developed for this project as the accuracy requirement is modest for obtaining significant information.
Humidity
Relative humidity can be measured by means of a hum- istor, a device for measuring the electric dipole moment of gases, e. g. , water vapor, ozone, etc. A change in resist
ance of the semi-conducting sensing element is obtained which is proportional to the concentration and magnitude of the di
pole moment of the ambient gas or vapor. The response is approximately 30 seconds in free air and is nearly tempera
ture insensitive from 0°C to 100°C. The instrument can sur
vive at 300°C with temperature correction and special cali
bration. The nominal resistance in air at 25oC and 25 percent humidity is 1 to 2 megohms.
Data Interpretation Determination of Vehicle Elevation
In order to determine the atmospheric profile, some means of determining the capsules altitude relative to the planetary surface is required. The change in elevation b e tween two successive samples can be obtained as follows:
Hydrostatic pressure is given by
dp = ρ g dz (1) where ρ is the local density, and g the gravitational acceler
ation. The equation of state at the atmospheric gas is
Ρ = {-τ Ρ Τ (2)
where Μ is the average molecular weight.
Inserting E q . 2 into E q . 1, the expression for the change in altitude is obtained, ρ
R
Γ
T(p) ,Z * Zo = - M g ^ ~
J
p ρ d p <3 )ο
The right-hand side of Eq. 3 is obtained by plotting measured values of ρ against measured values of Τ and obtain
ing a best fit for Τ (ρ). The method for obtaining M is shown in the next section. Measurements of Τ and ρ should have full- scale accuracy of at least 1 percent resulting in an accuracy in ζ of the same order.
One further step is necessary to determine absolute altitude, since the curve resulting from the above procedure
SIXTH SYMPOSIUM ON BALLISTIC MISSILE AND AEROSPACE TECHNOLOGY
is indeterminate with a constant. That constant is obtained by- knowing the p r e s s u r e and temperature when surface impact is achieved (surface impact indicated by an accelerometer read
ing, for example). This establishes the point of zero altitude, and the measurements can be referred to elevation above the surface of the planet. The top of the cloud layer is another possible reference level.
Molecular Composition
Using the ideal gas law and formula for the velocity of sound, a parameter is derived that depends only on the com
position of the gas.
The velocity of sound is given by Eq. 4.
Vs ρ2 = (γ i w ^ p' vs the ratio of specific heats C / C ) (4) 7 v ' Substituting Eq. 2 into Eq. 4 for ρ
V2
_5_ - JL (5)
RT ~ M
If the planet has a zone similar to the earth's tropo
sphere, where the gas is well mixed and of uniform compo
sition, the value of the parameter γ / Μ determined from Eq.
5 is a constant. In the troposphere, the parameter γ / Μ can be used to estimate M , the average molecular weight of the gas molecule. Assuming that the gas is composed of two principal constituents, and CO^, γ / Μ is used to determine the relative abundance of the two molecules in the gas. F o r this calculation, the temperature required for (5) should be measured inside the resonator. The ambient temperature can be derived from this measurement using (6).
For a monatomic gas, yis 1. 67; diatomic gas is 1.40;
and for a gas with three to five atoms 1. 30. The molecular weight of CO^ is 44 grams; and of N ^ , 28 g r a m s . γ / Μ can be derived for each of these homogeneous gases. F o r C O?/ y / M C Oz = 0. 03 and for N ^ , γ / Μ N2 = 0. 05. The average gas can be considered as a mixture of the two ideal gases with the p e r centage by weight or volume of one of the gases as an unknown quantity to be determined by experimental measurements of γ / Μ . It is possible to estimate the relative abundance of CO^ and N ^ , assuming these are the major constituents. If γ / Μ falls outside of the range of 0. 03 to 0. 05, then some other major constituent is indicated, thus rejecting the initial hypothesis that the only principal constituents are nitrogen and carbon dioxide, or that the instruments are w o r k ing properly.
Assume that 25 independent determinations of Eq. 5 can be made during passage through a troposphere, each accurate to at least
percent.
If Vg is measured with only 10 percent accuracy, an average value of Y / M has an expected e r r o r of about 4 percent. In that case, ·γ/Μ can be used to determine the relative abun
dances of CO^ and with about 8 percent expected e r r o r , assuming they are the only major constituents.
Dipole Moment Concentration
It is proposed to include a humistor in the payload in order to determine relative humidity (if water is present).
The results obtained are used to obtain a relative humidity profile. The virtual or equivalent dry air temperature can be computed and used in the equation of state for the previous calculations. The dipole moment of the ambient gas or vapor is measured with a response time of about 30 sec for an instantaneous increase in the dipole moment concentration.
Experimental tests of the humistor have been carried out in order to evaluate its application to the mission. Relative humidities at standard conditions as low as several percent are detectable. Other vapors with a significant dipole m o ment could also be detected on Venus.
A i r Density Profile
Since both the pressure and temperature are measured quantities, the density is readily obtained directly from the ideal gas law.
_ M P
" RT a
Y / M is obtained from Eq. 5 utilizing measurements of the velocity of sound. The relative abundance of and CO-> are deducted from Y / M using Dalton's law for the mix
ture of ideal gases. M , so obtained, is used. T^, the ambi
ent temperature, is derived from (6) in the following section.
The pressure transducer is designed to measure the ambient pressure approximately.
100 Δ VS Δ Τ
SIXTH SYMPOSIUM ON BALLISTIC MISSILE AND AEROSPACE TECHNOLOGY
Ambient Temperature from Measurements of the Total Temperature Inside a Moving Vehicle Containing Active Elements
The temperature measuring device will measure the total temperature Τ of the stagnant air in the immediate vicinity of the instrument. In addition to the ambient temper
ature, additional increments in the temperature are caused by aerodynamic heating, and heat generated by active ele
ments operating in the instrument capsule. Letting Τ be the ambient temperature; M^ is the mach number of the vehicle's air speed, γ is the ratio of specific heats Cn/ C ,r, Δ Q is the
Jr V
heat added by active elements to the mass of air surrounding the instrument, and M is the mass of the stagnant air sur
rounding the instrument, is the drag accelerometer,
m/Cj^A is an aerodynamic parameter obtained in the design of the capsule, ρ is the p r e s s u r e , and Τ is the total temperature which is measured. (2)
Τ
Τ - C Δ Q M a . , ,τ Ρ Υ- 1 . 2
1 + (—2 ) Μ χ
Using the aerodynamic drag equation and the formula for the velocity of sound:
Τ
Τ - C Δ Q M7
= τ Ρ
A 1 + Ύ ' 1 ( _ M \ l Ώ ~ \
1 +
-γ-
Τ ^ Χ 'Δ Q is obtained by laboratory calibration of the instrument capsule. C^ can be derived, if the composition of the atmosphere is known. The number of moles of gas is ob
tained from ( density/mol. wt) χ (enclosure volume). Using P V
the ideal gas law, this reduces to , where V is the enclosure volume.
1 + — R - {- c ^ x) ( — )
also depends on the composition of the atmosphere and can be obtained by approximation or laboratory experi
ment.
Dynamic P r e s s u r e and Direction of the Wind
If the vehicle is falling through a stationary homogene
ous atmosphere, the vehicle would descend in equilibrium after total re-entry deceleration, that is the drag acceleration equals the acceleration of gravity and the body falls at a con
stant velocity. The dynamic p r e s s u r e exerted on the falling vehicle by the displaced air mass is approximately m g / C ^ A ; where m is the mass of the vehicle, and A a r e obtained from experimental measurements and A depends on the angle of attack (angular distance between the chord axis and drag force acting through the center of p r e s s u r e ) .
F o r a stationary atmosphere, the drag acceleration on the vehicle will slightly exceed g because the density of the medium increases as the surface of the planet is approached.
F o r the case of dropping through a moving air m a s s , l a r g e departures of the drag acceleration f r o m g are sensed indi
cating that the drag force is much l a r g e r than that obtained by descent through a stationary medium. In such a case the drag force can be assumed to be caused by the dynamic pressure of the wind.
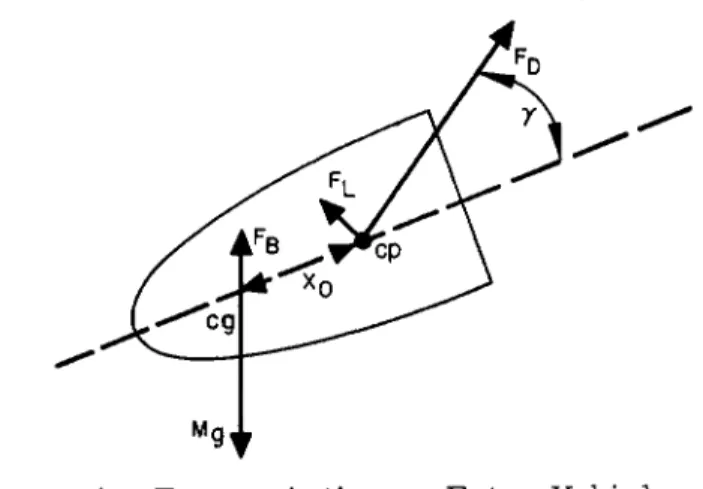
The instrument payload is designed to descend through the atmosphere without control surfaces; the eg is located sufficiently below the cp that the vehicle will remain stable for the largest drag forces anticipated, that the cp and eg are located along the symmetry axis of the capsule, and that the acceleration is measured along the symmetry axis of the vehicle. With these rules in mind, F i g . 1 illustrates what happens when the drag force F n is applied at a given initial angle of attack. The principle l o r ce s are mg acting through the eg and aerodynamic drag force, F ^ , acting through the cp. F ^ , the aerodynamic lift, and F g , the force of buoyancy, are considered negligible in the analysis. The rotation about the eg caused by F ^ is such that the angle of attack is reduced by a restoring force. m D is the component of F ^ measured
a υ along the symmetry axis of the vehicle, X is the distance
between eg and cp, and I is the radius of gyration of the vehicle about an axis through the eg perpendicular to the plane of F-p. and the vehicular axis.
2 d2Y
m I r-i- + (mD X ) tan Υ = Ο - (damping, lift, and a o
SIXTH SYMPOSIUM ON BALLISTIC MISSILE ANO AEROSPACE TECHNOLOGY
buoyancy are neglected in this first order approximation).
For small initial angle of attack V the resulting Y is given by 2
I and X ο depend on the design of the capsule so that any estimate of f before the capsule is designed and the instruments are pack
aged is a gross estimate. Such an estimate is 2 cps Z_f zi_
10 cps. In practice, the oscillation is damped due to friction with F ^ induced oscillations maintaining the vibration. If the body is as described by the given rules, the nominal angle of attack of the vehicle is zero. In order to obtain the average acceleration when the angle of attack is zero, the peak accel
erometer outputs occuring during the sampling period are averaged.
As the vehicle descends toward the surface of the planet through a moving air m a s s , it has a lateral and vertical com
ponent due to the combined effect of aerodynamic drag and the weight of the falling vehicle (lift and buoyancy neglected). The vertical and horizontal (radial) component of the vehicular acceleration can be expressed in terms of known quantities.
Refer to Fig. 2.
Initial velocity conditions for the atmospheric descent of the instrument capsule can be derived from the analysis of atmospheric entry and the time elapsed between maximum acceleration and ejection of the instrument capsule. Before atmospheric entry, the angle between the trajectory path and the local vertical is obtained from subsequent analysis of light sensors (discussed in a following section). There is sufficient information to analyze the dynamics of entry up to the time that the instrument capsule is separated. Given the initial velocities, the derived accelerations can be integrated to obtain the radial and vertical component of velocity of the vehicle. In terms of known quantities, the following p a r a meters can be derived: 1) the angle of the axis of the vehicle relative to the vertical, 2) the magnitude of the air velocity relative to the vehicle (zero angle of attack), 3) the angle b e tween the flight path and the vertical, 4) the magnitude of the vehicle velocity relative to an inertial axis. In the plane deter
mined by the two above described vectors ( refer to Fig. 3), the velocity of the air relative to the vehicle is obtained and the velocity of the vehicle relative to an inertial velocity of vehicle, the inertial air velocity is obtained. F r o m this, the dynamic pressure of the wind and the elevation angle of the wind are derived as functions of the elevation above the planet.
Equation (7) is obtained by taking the derivative of such sides of equation (3).
ί2π fot
where f = ο 2 π
D Χ a ο
~η—
Figure i. Forces Acting on Entry Vehicle.
Figure 2. Dynamics of Flight Through the Atmosphere.
I
Figure 3. Vector D i a g r a m for Determining the Wind Inertial Velocity.
SIXTH SYMPOSIUM ON BALLISTIC MISSILE AND AEROSPACE TECHNOLOGY
Let α = angle of the vehicle axis to the vertical
ag = vertical component of vehicle acceleration rel
ative to an inertial axis
a^ = radial component of vehicle acceleration in a horizontal plane relative to an inertial axis V = velocity of the vehicle relative to an inertial axis θ = angle of velocity vector, V , relative to the 8
vertical 8 V = wind velocity relative to an inertial axis
_ w g y
V = wind velocity relative to the vehicle we m = mass of the vehicle
Da = drag acceleration component along the axis at zero angle of attack
If the surface of the planet is rotating very slowly, as is probably the case with Venus, the above inertial acceler
ations and velocities reduce to ground accelerations and ve
locities. On earth, however, the ground accelerations and velocities would be determined from dynamic equations r e f e r red to an axis rotating on the surface of the planet.
The horizontal and vertical acceleration of the vehicle is given by
a = D cos α - g = ~ ( ? ΐζ a 6 dt x M G ρP ) (8) x
a = D sin α (9) r a
cos • 1 I r g+ d , R T ρ
D (10)
Equations 8 and 9 may be used to integrate the velocity and displacement of the vehicle relative to the ground. Equation 10 is the vehicle axis angle relative to the vertical. Assuming the vehicle is stable and the angle of attack of the vehicle axis with the relative wind velocity vector is zero; then Eq. 10 yields the angle of the wind relative to the vehicle with respect to the vertical. E q s . 8 and 9 are integrated to obtain the χ and ζ components of the velocity of the vehicle relative to an
inertial axis, and the angle of the velocity vector with respect to the vertical are obtained. The derivation of initial con
ditions for the integration of equation (9) is not sensitive in determining wind velocity near the surface of the planet.
The accelerometer measures the magnitude of the wind drag relative to the vehicle.
D 1 C D A
m we
2 ^ 1 CDA M ρ
" 1 mR Τ we (11) Since Vg, Vw e, θ , and α can be obtained in integrating equations 8 and 9; and from equations 10 and 11; the vector, VWg , can be derived graphically or analytically as shown by Fig. 3. Thus, the magnitude of the wind velocity vector and its elevation angle are obtained.
The equations of motion provide a method for obtaining the dynamic wind pressure from measurements of p r e s s u r e , temperature, and linear axial acceleration. Consider the degenerate case where the body moves along with the wind and cannot sense inertial velocity of the wind. This is the case of a body for which the average density is the same as that of the air displaced (eg, a balloon at its maximum height). The ac
celerometer reads zero, the axis of the vehicle is in an inde
terminable orientation, the accelerations on the vehicle are zero, and the airspeed of the vehicle is zero. For this case, the wind inertial velocity cannot be detected. The initial con
dition for the velocity required for a single integration of the equations of motion of the vehicle is in the wind velocity. The solution is a degenerate case of the equations of motion, and is consistant with them.
The equations can be used to determine the dynamic pressure of the wind utilizing the output of a + 5 g acceler
ometer (1 percent accuracy) with a maximurrf~accuracy of + 30 millibar which corresponds to a wind velocity of + 6 crrT" / sec at the surface of the earth. The requirement ofthe drag coefficient C j ) , the average molecular weight M , assumption of planar motion during the sampling period, drift e r r o r s due to integration of accelerations derived from measured quanti
ties, are factors which limit the accuracy of the inertial dy
namic wind velocity determination. The vertical derivative of the wind dynamic pressure yields the wind shear, which is not subject to the drift e r r o r s obtained by integrating the acceler
ation components.
The vertical and radial accelerations of the vehicle are derived from measurements of Da, the drag acceleration along the axis of the vehicle, p, and T. The vertical component of the acceleration is obtained by taking the derivatives of both sides of equation 3.
The direction of the wind, measured from an axis in the horizontal plane directed toward the sun, is given by θ derived from equations 18, 19, and 20. ζ , the zenith distance, will remain fixed and thus be determined from the average of solutions of 18, 19, and 20 for each set of measurements. Q may vary considerably, in a turbulent atmosphere, as the vehicle descends to the surface.
SIXTH SYMPOSIUM ON BALLISTIC MISSILE AND AEROSPACE TECHNOLOGY
Equations 18» 19* and 20 appear in the following discussion of light sensors. The next section discusses the derivation of the entry angle from measurements of the change in zenith distance between launch and entry.
Entry Angle
The zenith distance from an origin located in the mother vehicle is obtained by measuring the angular displace
ment between the sun center axis and planet center axis. The zenith distance at the point of entry is obtained from m e a s u r e ments inside the entry vehicle; as shown in equations 18, 19»
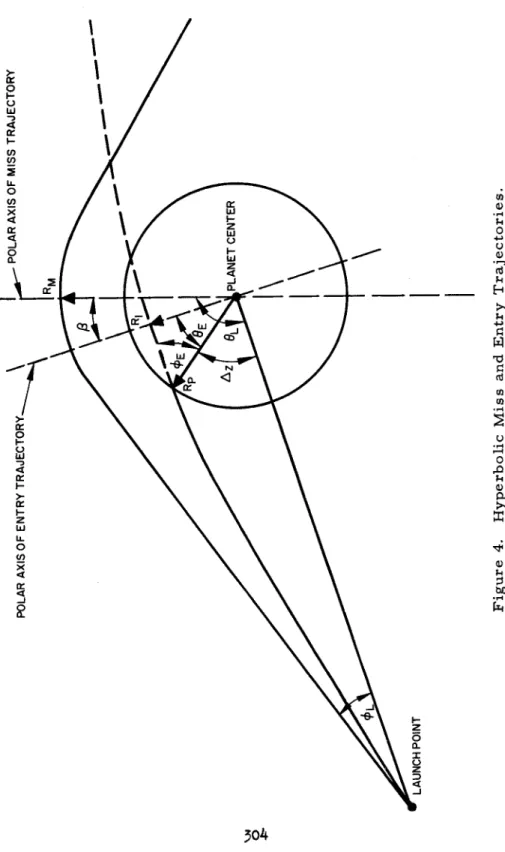
and 20. The quantities which are assumed to be known from trajectory analysis of the mother vehicle are R m , the mini
mum miss distance; s 0 0 , the excess hyperbolic velocity of the entry vehicle. In order to determine the entry angle (ί)^, it is necessary to obtain R j , the miss distance of the entry orbit; and β, the angle between the symmetry axes of the two orbits. Refer to Fig. 4.
The equations of motion for a hyperbolic orbit follow.
Trajectory equation. (0 measured from the symmetry axes of the fly by trajectory. ) R M (e + 1)
1 + e cos θ
R M 'S o °2
= 1 + - 4
(12)
R P g0
Conservation of momentum.
ρ s sin 0 = R g s ( R ^ is distance from origin to
0 0 an asymptote) (13)
RB - R M
e + 1 e - 1
1 1
Conservation of energy.
? 2 8 r 2 ?
s = ° P + s ^ ( Rp is planet's (14) radius; gQ, gravity on the surface) The equation for <t> f r o m θ is obtained by substituting s oo from (14) and ρ from (12) into (13). 2
2 /-L 1 Jl ^ e2 -1
c s c 0 = 1 + e cos θ < 2 + 1 + e cos θ > { 15 ) The angular displacement γ, of the planetary disc is measured by horizon scanners and used to determine the dis
tance from the planet at the launch point.
Rp csc Y L
At the launch point ρ ^ is obtained from m e a s u r e d V ^ and substituted into equation (12). 0j can be obtained from (15); where 0 ^ - ~ is a possible angular perturbation of the flyby orbit u s e d to generate the orbit for the entry body.
" t a n "1 I ^(S P) 0L - ^ = tan~A m im 5, 1
[2 goRp s i n V + 'so o2] 2
I mv p / is the component of specific impulse oriented 0 ^ - ~ from the axis centered in the flyby vehicle and direct
ed toward the center of the planet.
The trajectory of the miss vehicle with respect to a polar axis centered at the planet center and passing through the apex is known. At launch, the entry vehicle and flyby vehicle have the same radius ρ ^ given by R csc Y ^
RT (e + 1)
R csc Ύ = — (16)
p L j 1 + e' cos ( ©L - β)
/ R I s oo /
where e = 1 4- — - and s & is the excess hyperbole go velocity
of the entry vehicle.
At the entry point, the change in the polar angle θ from launch is measured by the difference in the zenith distance at launch and the zenith distance at entry. Since the sun axis is parallel in the two measurements of the zenith distance, the change in zenith distance is equal to the change in the polar angle with origin at the center of the planet. At the entry point, the trajectory equation is
R _ RI <« + 1 ] (17)
Ρ 1 + e ' cos ( © L - ^ ζ - β )
Figure 4. Hyperbolic Miss and Entry Trajectories.
SIXTH SYMPOSIUM ON BALLISTIC MISSILE AND AEROSPACE TECHNOLOGY
where Δ ζ is the change is zenith distance from point of launch to point of entry. (16) and (17) contain β and R j as the only unknowns, and are two equations for two unknowns.
Let θρ, be the polar angle at the entry point, measured from the axis through the focii of the entry body's trajectory.
Θ Ε
= ©
L-Δι
-βd) j£ is explicity obtained from (15) (where e is the eccentricity of the entry body's trajectory). <t)„ is obtained from m e a s u r e - ments as shown above, and is used to analyze the dynamics of entry. 0^, and g max (which is the peak axial accelerometer output during entry) can be used to specify entry conditions.
For launching an entry body into the entry orbit from a launch point close to the asymptote, it may not be feasible to measure y I*1 s u c n a case, the direction cosines of the asymptote and the sun axis are known. Measurement of the zenith distance then determines 0^· is computed from R R esc 0T in equation (16).
Vehicle Orientation from Light Intensity Data
In order to obtain a more general interpretation of light intensity data, the zenith distance of the sun and orienta
tion of the vehicle are derived from measurements of light through vertical and side looking apertures. The light intensi
ty is measured through an aperture along an axis oriented at right angles to the vehicle axis and through an aperture located along the vehicle axis. The vehicle axis is tilted α from the vertical in the direction of the wind, α is determined from independent measurements; but the direction of the wind is presently unknown. The vehicle is rotating with a period much less than the sampling period, so that maximum light intensi
ties are sensed during the sampling period. Measurements of the sun intensity along the axis of the vehicle, z axis, and at right angles to the vehicle axis, r axis, are made when the maximum light intensity is sensed along the r axis. T r a n s formation equations are derived expressing Ir and Iz, the light intensities along the r and z axis, respectively; in terms of IQ, the resultant light intensity along the axis pointing toward the sun. θ is the angle between the horizontal projections of the axes pointing in the direction of the sun and direction of the wind, ζ is the zenith distance of the sun, and α is the angle that the vehicle is tilted in the direction of the wind.
SIXTH SYMPOSIUM ON BALLISTIC MISSILE AND AEROSPACE TECHNOLOGY
Iz = IQ (cos ζ cos α - sin ζ sin α cos 0) (18) 2 2 2
Ir = IQ (cos ζ sin α + sin ζ cos Θ) + sin ζ sin 0(19) 2 2 2
I = I * + I * (20)
ο r z v '
Since I and I are measured, and α is derived inde-z r pendently, Iq, ζ , and 0 are derived from equations 18, 19 and 20. I is the light intensity along the axis pointing toward the sun.
Measurements of F o r w a r d Scattered Light
The requirements for energy balance given the high visual albedo, and observed high apparent surface temper
ature suggest that the scattering on Venus is highly directional in order that most of the incident light reaches the surface to be absorbed, radiated as heat, and trapped with high efficiency in the atmosphere.
In order to interpret light intensities through apertures and collimators located on the vehicle, it is only necessary to know the angular displacement of the area receiving light and the axis pointing toward the sun. The necessary information is obtained by having an aperture oriented the side of the vehicle (90° from the vehicle axis), an aperture along the vehicle axis, and a collimator in the plane of and at 45° from each of the two aperture orientations. A s the side looking aperture rotates toward the sun, a maximum intensity is obtained. A peak intensity or average of peak intensities is then measured during the sampling interval. At the same time, the light intensity along the vehicle axis is measured. These two measurements, I , the axial component, and Ir the radial component, are sufficient to determine the angular displace
ment, 0, of the collimation axis from the sun axis. The angular displacement of the collimator from the axis pointing toward the sun is given by 0.
0 + = T a n "1 (21)
z
The wind will tilt the vehicle, resulting in the modulation of 0, so that a number orientations, 0, will be derived using (21).
These are correlated with 1^ , the observed intensity of light scattered in that direction and the elevation of the vehicle derived from equation (3).
Lambert's law of absorption states that the transmitted 306
intensity is attenuated exponentially. The decay constant is due either to absorption or backscattering. Iq, the trans
mitted light intensity consists of incident and forward scatter
ed light. The nominal direction of Γ is considered to be
° ο along the axis pointing toward the sun.
d IQ ( Ζ ) = - α ( Ζ ) Io ( Ζ ) sec ζ d z (22) is the forward scattered light which is observed through
the collimator axis at several orientations, 0.
d lf g ( 0 , Ζ) = β ( 0 , Ζ ) Io ( Ζ ) sec ί d Ζ (23) Both α and β can be solved for explicitly from
equations (22) and (23) in terms of measured and previously derived quantities. I and ζ are obtained from equations (18), (19) and (20); Ζ from equation (3); 1^ is the light intensity observed through the collimator; and (f) is obtained from equation (21).
Conclusion
In view of the divergence of opinion concerning the interpretation of astronomical and astrophysical data r e g a r d ing the Venusian atmosphere, it was of interest to examine means whereby the information necessary to uniquely resolve
some of the questions could be obtained. In all likelihood, the answers will come from a combination of improved o b s e r vations from observatories on earth, data gathered from probes in the near vicinity of the planet, and from data return
ed by planetary entry packages. The three sources are view
ed as complementary, rather than competing, approaches.
The entry package can make measurements directly, and hence the returned data is subject to less variation in scientific interpretation.
In addition to the scientific value of an atmospheric measurement capsule, consideration must also be given to the value of engineering data obtained which will be pertinent to the design of more sophisticated exploration systems. With accurate information on entry conditions and surface environ
mental conditions available, the spacecraft could be optimally designed, resulting in a more efficient and reliable explora
tory program.
The value in determining the payload weight and power requirements and in selecting well matched sets of
S I X T H S Y M P O S I U M O N B A L L I S T I C M I S S I L E A N D A E R O S P A C E T E C H N O L O G Y
observations are apparent when considering the design r e quirements for building the delivery system and programming of possible future missions. The following are a few sugges
tions of the advantages:
1. Savings in total weight required for the system c a r r y ing out this phase of the planetary exploration mission.
2. Greater reliability due to the modest requirements for the design of the launch mechanism, heat shield, instrument capsule, and telemetry system. This will result in simpler mechanization, less development time and more time for testing and evaluation.
3. Greater flexibility in programming missions due to the coordinated accessibility of planetary space, upper atmosphere, lower atmosphere, and the surface, with the appropriate payload selected for each sphere.
4. Greater scientific value of the mission and more confi
dence in the interpretations by properly selecting and coordinating the measurements. The interdependence existing between the variâtes measured results in more information derived from the sets of m e a s u r e ments, or more redundancy and crosschecking if
some of the measurements are questionable.
Acknowledgments
A. T. Owens provided the description of transducers included in this paper, and R. W. Clapp edited and revised portions of the original manuscript. The project was funded by Hughes Aircraft Company. These contributions are greatly appreciated.
References
1. Clapp, R. W. , A . T. Owens, and R. L. Sax, "Planetary Landing and Observation Package," Proceedings of the Sixth Symposium on Ballistic Missile and Aerospace Technology, Vol. Ill, Academic P r e s s , 1961.
2. Shapiro, Α . Η. , The Dynamics and Thermodynamics of Compressible Fluid Flow, Vol. I, Ronald P r e s s , 1953, p. 80.
Jenkins, F. A . and H. E. White, Fundamentals of Optics, Chap. 22, M c G r a w Hill, 1950.
Planck, Max, Treatise on Thermodynamics, 3rd Eng.
ed. , Chap. I and II, Dover, 1925.
Kuiper, G. P. , ed. , "The Earth as a Planet," Vol. II of Solar System, Chap. 7, 12, and 13, Univ. of Chicago P r e s s , 1954.
Brueschke, Ε. Ε. , Hughes Aircraft Company; report pending on the tests on and calibration of the Humistor.
Edson, J. Β. , Proceedings of the Lunar and Planetary Exploration Colloquium, Vol. I, No. 5, March 1959·