An Approach of Clustering Features for Ranked Nations of E-government 2012
Yu-Chien Ko, Hamido Fujita*
Department of Information Management, Chung Hua University, 30012, ShinChu, Taiwan, e-mail: eugene@chu.edu.tw
*Software and Information Science, Iwate Prefectural University, 020-0173, Takizawa, Japan, e-mail: issam@iwate-pu.ac.jp
Abstract: E-government is important for national development. However, the significant features for E-government stages have not been analyzed intelligently. This research proposes a method, clustering features for rankings (CFR), to find stages and features for E-government. The results show that the adult literacy is significant for the beginning stage and the gross enrollment in education for the mature stage. Technically, dominance-based rough set approach is used to generate criteria’s evidential weights of nations’ rankings and rough set is then used to identify the clustering features composed of dependency rules.
The rules comprise the most relevant and important criteria and the ranking intervals as the intelligent knowledge.
Keywords: E-government; clustering features; rankings; dominance-based rough set approach (DRSA); rough set (RS)
1 Introduction
Clustering [1, 2, 3] and Classification [1, 2, 3, 4, 5, 6, 7, 8, 9, 10] of the roughness theory have successfully presented features knowledge (in terms of indiscernbility realations) as intelligent knowledge since 1982. Techniqcally, the roughness classification can partition a given set of objects and the roughness clustering can identify natual grouping of objects. The features can be obtained by choosing either classification or clustering technique. However, neither of them alone, can provide information needed for decision making. For instance, classification only provides the local information restricted by the given set of objects and the natural grouping is short of expert’s opinions. A complementary view between classification and clustering evolves an integration to give intelligent features [11, 12]. This research aims to propose an integration method for E-government Development Database of United Nations (UN-EGDD) 2012 [13] in analyzing stages (clustering features composed of continuously ranking intervals). Under the
consideration of rankings these stages signify the development of E-government in terms of dependency rules which are presented in Section 2.3, 3.2 and 4.
E-government seems natural due to the arrival of the information age [14]. It can improve government performance, enhance business efficiency, provide online service to people, and so forth [15, 16]. So far, there is no mathematical model which can quantitatively and naturally identify stages for E-government.
According to the characteristics of UN-EGDD, the natural stages could guide the development of E-government [16]. The difficulties of solving the natural stages are summarized below.
UN-EGDD assumes fixed weights for criteria. This assumption negates the existence of stages. The reason is that stages, at different levels, have different focuses, i.e., weights vary with stages.
The stages based on rankings are hard to identify. The interval rankings from nation to nation are not easy to define.
1.1 The Objectives
Under considerations of the research background and the problems above, this research aims to identify clustering features with criteria relevance and importance to rankings. The natural clusters will be explained with continuous stages in terms of the dependency rules. The ranking intervals depending on the criteria will imply the features of E-government stages.
1.2 The Conceptual Methodology
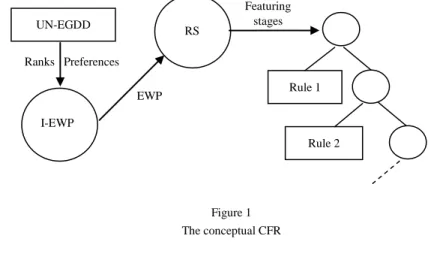
Figure 1 The conceptual CFR
UN-EGDD RS
Rule 1
Rule 2 I-EWP
EWP
Featuring stages Ranks Preferences
To achieve the objective and solve the research concerns above, our methodology named clustering features for rankings (CFR) is designed and implemented in two phases. First the classification postoris by I-EWP (induction of preferences based on preferences) for nations’ ranks [17]. These postoris are evidential weights based on preferences (EWP). In the second phase, EWP replace the preferences in the information systems to discover clustering features by Rough Sets (RS). The resulted clusters are presented as a hierarchical tree shown in Fig. 1.
1.3 The Organization of This Paper
This paper has two parts. The first is about the implementation of CFR. The second is about applying CFR on UN-EGDD. The remainder of this paper is organized as follows: Section 2 reviews UN-EGDD, I-EWP, and RS. Section 3 presents the propositions for CFR, Section 4 addresses the application results, Section 5 presents discussion on CFR and finally Conclusions provides the concluding remarks to close the paper.
2 Literature Review
This section contains three parts, first is about UN-EGDD, second is about I-EWP to provide criteria’s relevance and importance information to rankings, and third is about clustering of RS.
2.1 UN-EGDD
E-government originates in 1993 when US President, William Clinton, announced a six-month review of the federal government, named as National Partnership for Reinventing Government (NPR), and asked Vice President, Al Gore to identify problems and find out solutions for reorganizing the federal bureaucracy, analyzing job performance of federal employees, reviewing each administrative agency and report recommendations to Congress on government reforms [18]. In the autumn of 1993, Vice President Gore presented a report to Clinton and the public about “Reengineering Through Information Technology” [19]. In early 1997 various initiatives of E-government started to enable anyone who wants to transact business with the government electronically [20].
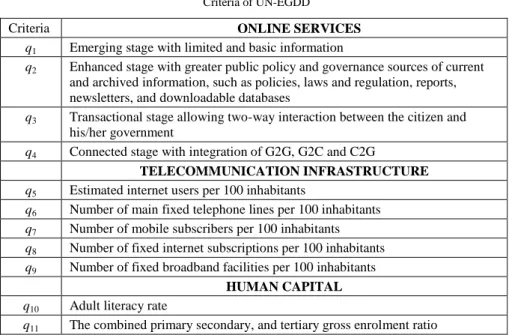
UN-EGDD publication was undertaken by a group of senior E-government researchers and advisors at the United Nations Department of Economic and Social Affairs. The Division for Public Administration and Development Management plays the core to manage the data collection [13]. The criteria of E- government are described in the Table 1 which has preference dataset.
Table 1 Criteria of UN-EGDD
Criteria ONLINE SERVICES
q1 Emerging stage with limited and basic information
q2 Enhanced stage with greater public policy and governance sources of current and archived information, such as policies, laws and regulation, reports, newsletters, and downloadable databases
q3 Transactional stage allowing two-way interaction between the citizen and his/her government
q4 Connected stage with integration of G2G, G2C and C2G
TELECOMMUNICATION INFRASTRUCTURE q5 Estimated internet users per 100 inhabitants
q6 Number of main fixed telephone lines per 100 inhabitants q7 Number of mobile subscribers per 100 inhabitants q8 Number of fixed internet subscriptions per 100 inhabitants q9 Number of fixed broadband facilities per 100 inhabitants
HUMAN CAPITAL q10 Adult literacy rate
q11 The combined primary secondary, and tertiary gross enrolment ratio
2.2 I-EWP
The evidential weight proposed by Keynes in 1921 is based on the probability relations to express the rational belief about the importance and relevance between a primary proposition (premise) and a secondary proposition (conclusion) [21, 22]
The main idea claims that the doubtful arguments relevant to decision should be considered quantitatively, instead of by logic only. Its application requires considering not only the knowledge of decision makers but also circumstances for induction [23], thus can estimate the evidential relevance like goodness and risk [3, 24]. Recently, the evidential weight is further extended to EWP [17] which is summarized below.
EWP is implemented from the induction rule, qj t, 'Clt , as presented in Property 2. Four properties of [17] are used in this research. Property 1 presents the information system of I-EWP. Property 2 explains the induction rules of I- EWP. Property 3 talks about the induction evidence. Property 4 is about the reliability measures for EWP.
Property 1: The information system of I-EWP ( , , , , t )
IEWP U Q f R Cl , where each object y has a rank assigned by decision makers, U { |y y1,..., },n Q{ ,q q1 2,...,qm}, f U: Q R, Ris a
ranking set calculated from preferences, R{1 , 2 ..,th th nth}, Clt is a ranking union having nations at least t, t is a rank place like 10th, and Cltis a dominance class defined by decision makers.
Property 2: An induction rule of I-EWP
, '
j t t
q Cl represents how a criterion qjsupports nations to achieve the top t positions where qj t,, j t, j s, ),
s t
q q
( is also a ranking union containing the top t
positions with respect toqj. This rule associates the ranking evidence within criterion qjto the ranking union Clt. The association is independent to addition or removal of other criteria thus the rules are independent each other. Our design can be conceptualized as in Fig. 2.
Property 3: The induction evidence
Under the induction rule qj t, 'Clt, there are two approximations defined with boundaries x and x where xClt, xClt, and the rank of x is always higher than or equal to that of x . x is assumed as the boundary of the important evidence and x as the boundary of the relevant evidence. These two types of evidence are defined as:
Important evidence: DP( )x located in the area above x in Fig. 2 Relevant evidence: DP( )x located in the area above x in Fig. 2 The important evidence belong to the upper part of the relevant evidence in Fig. 2.
The approximations based on the induction evidence are defined as:
Important approximation: P Cl( t)DP( )x Clt; Relevant approximation: P Cl( t)DP( );x Doubtful region: DP( )x DP( )x .
Important approximation contains the important evidence belonging to the ranking interval above, i.e., Clt. It is same as the lower approximation of DRSA.
Relevant approximation contains the evidence above the boundary x and requires that x belongs to the ranking interval of Clt. Doubtful region contains the evidence that are relevant but not important. The noise in this area is dissimilar to the important evidence, and is called distinguished noise. Therefore, the noise within approximations is defined as: Undistinguished noise: DP( )x P Cl( t)and Distinguished noises: D xP( )DP( )x P Cl( t).
The distinguished noises are objects away from the important evidence, and normally located in the doubtful region. The undistinguished noises mixing with the important evidence within the Important approximation and cannot be separated each other by objective methods. Obviously, the more evidence in
( t )
P Cl the more importantPis; the more noise in P Cl( t) the less relevant Pis.
Due to the impact of noises, x and x are non-deterministic priori. Therefore, x and x are presented as slash lines in Fig. 2. They can be obtained by approximating the optimal classification with the minimum distinguished noises.
Property 4: Measures of EWP
Three measures related to EWP of Fig. 4 are defined below.
Evidence-accuracy rate () [3, 24]
An accuracy rate presents the ratio of ‘Important approximation’ to ‘Relevant approximation,’ i.e., the degree of the properly classified evidence relative to the possibly relevant evidence, and is defined as:
| ( ) |
| ( ) |
t t
P Cl
P Cl
where for a logical implication represents the degree of necessary condition of ‘Important approximation’ in the relevant evidence.
Evidence-coverage rates (CR) [8, 24 ]
A coverage rate expresses the ratio of ‘Important approximation’ relatively belonging to the ranking union, and is defined as:
| ( ) |
| |
t
t
CR P Cl Cl
where CRfor a logical implication represents the degree of
sufficient condition that ‘Important approximation’ influences the ranking union.
Evidence-certainty rate (Cer) [8]
A certainty rate expresses the ratio of objects in ‘Important approximation’
relatively belonging to Important evidence:
Cer | ( ) |
| ( ) |
t P
P Cl D x
where |.| means the number of evidence in a set. Cer represents the degree of reliability of P Cl( t).
The values of EWP
The classification rate for qj t, 'Clt needs to consider both, the sufficient and necessary conditions. The product of CRandwill be a unique value on an indifference curve, which originates from the product of sufficient and necessary ratios for the indifferent induction rules. The induction measures are independent to addition or removal of other criteria. The product values thus can be used for preference orders. Further, the quality of classification needs address the reliability concern. According to the logical implication, a quality classification can be formulated as:
Quality classification Minimum uncertainty
‘Quality classification if and only if minimum uncertainty’ can be processed by mathematics to get a unique value on an indifference curve. Therefore, the value of EWP, gj , for criterion qj is the quality classification rate considering the minimum uncertainty, i.e., gj =Max {CRCer}.
2.3 Rough Sets (RS)
Rough sets proposes an approximation space based on equivalence relations. The objects within an equivalence classes have the same characteristics. The criteria dependency represents a measure about the association degree between the partitions based on criteria. The complicate dependency has the association between two set of criteria. The basic dependency [5] related to the clustering features, is described next.
An approximation space presented by a mathematical model is formulated as:
( , )
A U R where U is a set of objects not necessary with preference data and R U Urepresents an equivalence relation on U .
Important approximation
( t ) P Cl
The downward union of classes Beyond Relevant
approximation Doubtful region
, t
qj tCl
x x
The upward union of classes
(Clt)
t
Figure 2
Approximations based on the induction evidences
The equivalence classes of R are denoted as: R*{X X1, 2,...,Xi,...} where i is an index for a relation. For any subset XUthe lower and upper approximation of Xis defined as:
( )
i i
X X
A X X
and ( )
i i
X X
A X X
where A X( ) is the union of all those elementary sets in A, which are individually contained by X, whereas A X( ) is the union of all those Xi of which has a non-empty intersection with X.
A knowledge presentation for the dependence relationship between criteria is built as:
( , , , , )
KRS U C D V where C is the set of attributes, D is the set of action attributes, Vrepresents the value set which does not require preferences within the same attribute, :U(CD)Vis an information function, a
C D
V V , Vais a domain of a attribute (attribute is same as a criterion in this research due to numerical values only), and a C D. The dependency measure between two sets of attributes, Aand B, based on KRSis presented as:
A( )B
where ( )
( ) | |
A A
POS B
B U
,0A( )B 1, AC, BD,
( ) * ( )
A Yi B i
POS B A Y
where POSA( )B is the positive region of B*in A, and
*
1 2
/ { , ,..., i,...}
B U B Y Y Y represent a set of U partitions constructed from equivalence relations based on B.
3 CFR
This section presents definitions of CFR with two phases. First is about replacing preferences with EWP, presented in Definition 1. Second is the clustering features generated by RS, presented in Definition 2 to 6.
3.1 Replacing preferences with EWP
The quality classification rates generated from I-EWP are expressed as {gij} where i is an index for a nation, i[1,..., ]n , j is an index for a criterion,
[1,..., ]
j m . {gij}is abbreviated as EWP in this paper. gij only performs locally and the natural clusters of EWP cannot be clear at a glance of gj only. The reason for the local performance of gij is that its effectiveness exists only on a part of
nations. To give a natural clusters on all collections of gij, gij are used to replace the values corresponding to nations and criteria in Property 1.
Definition 1: Replacement
{1,..., } and {1,..., } ij ij
i n j m r g
where rijRand f U: Q R in Property 1
3.2 Generation of Clustering Features
The analysis of clustering features needs to globally consider the topology of dataset. There are three definitions to present the design and implementation.
Definition 2 for the information system CFR. The domain values corresponding to nations and criteria are formed by transforming EWP into orders row by row.
Users can see which criterion is the most relevant and important to some rank assigned by decision makers. Definition 3 presents how the roughness relations are formed. Definition 4 presents the dependency rules.
Definition 2: The information system of CFR
The information system of CFR, containing n tuples of (ri1,ri2,…, rim ), is defined as CFR( , ,U Q Cl Rt, , ) where
1 2
1 =max{ , ,..., }
0 otherwise
ij i i im
r r r r
R
and :U Q R. Definition 3: Approximation space of CFR
The approximation of CFR is defined as A( , )U where ( ,x xi i) means xi and xi have a relation on a criterion which is of the most significant;
( ,x xi i) iff ( ,x ri ik)( ,1)xi and (x ri, i k )(xi,1), i and i are indexes of nations. Therefore, the equivalence class, having the same relevant and important criterion, is formulated as: A*{X1,...,Xk,...} where kis an index of clusters, km, and AQ. The number of clusters equal to or less than the number of criteria in Q makes operation simple and easy.
Definition 4: Ranking intervals
The ranking intervals are defined as 1
1
* { ,..., k,...}
k H H
L L
Cl Cl Cl where
{ | }.
k k H
L t k k
Cl Cl L t H For the class k
k H
ClL , Hk is the high boundary and Lkis the low boundary. These intervals will map to the equivalence classes of Definition 2. Through the mapping, nations in an interval have the same features
as the corresponding approximation. In our design, Cl*is an assumption in the beginning. The size of Cl*counts on the dependency measure and approximation operation next.
Definition 5: Dependency measure for CFR A ranking interval ( k
k H
ClL ) depending on an equivalence class (Xk) is presented
as a rule k
k H
k L
X Cl . The dependency measure is defined as:
{ }
{ }( ) max
| |
k
k k
k
k k
H
q L
H
q L
k
POS Cl
Cl U
where { }qk is a set criteria for the equivalence class Xk ,Xk (Uk,k),and k ( ,x xi i) means xi and xihave a relation on the same criterion qk. Therefore, nations having the most relevant and important on criterion qkare grouped together to support the rule, k
k H
k L
X Cl . Under this definition, at most mstages can be available.
Definition 6: Approximation operations
Considering to have a bigger cluster provides a disjunctive operation on approximations, Xkand Xk, an is defined to expand the ranking interval. The larger approximation will have more criteria in the relational condition, i.e., Ahas more criteria in Pand fewer partitions in U P/ .
( k k) ( k) ( k)
A X X A X A X if kand kbelong to the same stages ( k) ( k)
A X A X if kand kbelong to different stages
4 The Application Results
The application results of CFR have three parts in Table 2. The first, shows two clusters. The second, presents the maximum evidential weight of r ri1, ,...,i2 rim in EWP column. The third, presents EWP orders of Definition 2 in R column. The cells having values lower than the maximum weight are presented as empty.
Table 2
EWP orders for E-government stages
EWP R
Ranks Nations Stage
g3 …
g11 ri,3 ri,11
1 Liechtenstein 1 1.00 1
2 Monaco 1 1.00 1
3 Switzerland 1 1.00 1
4 Iceland 1 0.75 1
5 Luxembourg 1 0.80 1
6 Denmark 1 0.67 1
7 Republic of Korea 1 0.77 1
8 Netherlands 1 0.67 1
9 Sweden 1 0.67 1
10 United Kingdom 1 0.69 1
11 France 1 0.84 1
12 Norway 1 0.85 1
13 Germany 1 1.00 1
14 Belgium 1 1.00 1
15 New Zealand 1 0.93 1
16 Andorra 1 0.88 1
17 Finland 1 0.82 1
18 Malta 1 0.78 1
19 Antigua and Barbuda
1 0.77 1
20 Canada 1 0.73 1
21 Austria 1 0.79 1
22 Croatia 1 0.84 1
23 Singapore 2 0.87 1
24 States 2 0.83 1
25 Israel 2 0.80 1
26 San Marino 2 0.85 1
27 Barbados 2 0.82 1
28 Italy 2 0.80 1
29 Estonia 2 0.77 1
30 Russian Federation
2 0.84 1
31 Ireland 2 0.83 1
32 Australia 2 0.81 1
The clustering features are named as stages for illustration in Fig. 3. Their dependency rules are presented below.
Rule 1: If a nation’s q11 is the most relevant and important then the nation belongs to Sage 1 where the dependency rule as X11Cl123,
1
11 23
{q}(Cl LH ) 1,
11 { ( ,i i) | ( ,i i) ( ,i i,11) ( i, i,11), i,11 1, and i, 11 1}
X A x x x x iff x r x r r r Rule 2: If a nation’s q3 is the most relevant and important then the nation
belongs to Stage 2 where the dependency rule as X3Cl3323,
23
3 33
{q}(Cl LH ) 1,
3 { ( ,i i) | ( ,i i) ( ,i i,3) ( i, i,3), i,3 1, and i, 3 1}
X A x x x x iff x r x r r r Rule 3: If a nation’s q5, q6, q7, q8, or q9 is the most relevant and important then
the nation belongs to Stage 3, where the dependency rule as
33
5689 130,
X Cl X5689X5X6X8X9,
5 6 8 9
33
{q q q q, , , }(Cl130) 0.88,
5689 ,5 ,5 ,5 , 5
,6 ,6 ,6 , 6 ,8 ,8 ,8 , 8
,9 ,9 ,9 , 9
{ ( , ) | ( , ) ( , ) ( , ), 1 and 1,
( , ) ( , ), 1 and 1, ( , ) ( , ), 1 and 1,
( , ) ( , ), 1 and
i i i i i i i i i i
i i i i i i i i i i i i
i i i i i i
X A x x x x iff x r x r r r
x r x r r r x r x r r r
x r x r r r
1}
Rule 4: If a nation’s q10 is the most relevant and important then the nation belongs to Stage 4 where the dependency rule as 130
10 LH191 ,
X Cl
130
10 191
{q }(Cl LH ) 0.94,
and
10 { ( ,i i) | i, i ( ,i i,10) ( i, i,10), i,10 1, and i, 10 1}
X A x x x xiff x r x r r r Figure 3
The stages of UN-EGDD
Ranks 131~190, {q10} Ranks 33~130, {q5, q6, q8, q9}
q5~ q9
Ranks 23~32, {q3} q3
Ranks 1~22, {q11} Stage 1
Stage 2
Stage 3 Stage 4
CFR has two merits. The first, is to integrate classification and clustering together through the characteristics of the information system. One is the characteristic of preferences and the other is EWP. Even DRSA and RS function differently, they can complement each other to discover unknown information. The second, is to simply and easily find the number of clusters. The resulting clusters are featured with the equivalence relations, composed of the most relevant and important characteristic.
5 Discussions
This section has two parts. One is about the technique discussion. The other is a case study for the clustering stages of E-government.
5.1 Technique Discussion
The technique discussion section has four parts. They are goals, methodology, applications and comparison. This research aims to transform the local information from classification to discover a global topology for E-government.
The topological clusters map to the ranking intervals thus providing users a global view for E-government stages.
The methodology of CFR takes top relevance and importance as the requirement for the “indiscernability” relationship. EWP contain the characteristics related to a nation’s rank. The dependency rules based on EWP thus can present the clustering stages and features, leading to a view for the ranking levels of E-government. The application of CFR on UN-EGDD successfully discovers the topology of E- government has four stages, such as, Adult literacy, Infrastructure development, Online transaction, and expanding e-service through enrollment.
The functions comparison of CFR with DRSA and RS is processed with fair benchmarking, i.e., information system of preferences. The comparison in clustering features and ranks classification are listed in Table 3. The ranks classification is able to separate nations according to the ranking intervals and the clustering features can give natural groups with the dependency rules. The result shows that CFR has both functions of DRSA and RS, and provides an extension beyond DRSA or RS individually.
Table 3
The functions comparison of DRSA, RS, and CFR
DRSA RS CFR
Clustering features 0 1 1
Ranks classification 1 0 1
Total functions 1 1 2
5.2 The Case Study
These dependency rules show that the rankings of UN-EGDD depend on four stages. These stages can be explained by the clustering features such as:
Stage 1, the educational enrollment plays a critical role to sustain e- government at the top. United Nations E-government Survey 2012 reports a big challenge in development, i.e., low e-service usage. Generally, citizens still use government website much more for information than for transactions. Enrollment, grant application, and so on in education can achieve two merits [25].
Closing existing gap of e-service availability and usage;
Significantly moving usage beyond the realm of information to more complex transactions and services such as e-consultation.
This stage reveals that the expanding usage of e-service can advance the full benefit of E-governments.
Stage 2, the transactional interactions between government and citizens is the key to fulfilling online service. United Nations E-government Survey 2012 specifies that the sustainable development of the use of Information and Communication Technology (ICT) requires e-participation to contribute the socio-economic uplift of the people. E-government will play a role of proactive facilitator to treat people as active partners, by promoting user uptake, addressing the needs and concerns of the citizenry, especially the vulnerable. Furthermore, greater efficacy and effectiveness in the sustainable development can achieve solving the digital divide [26].
Stage 3, the telecommunication infrastructure plays the most significant role in developing the fundamentals of E-government. The infrastructure relates to investment, maintenance, needs of cooperative and shared resources, telephone density, Internet penetration, existing speeding of technology change, allowance for convergence, etc [27]. As the evolution of increasingly powerful and user-friendly technologies, E-government can take the advantages, to provide more effective and integral participation thus generate more opportunities of interaction with citizens [28].
Stage 4, the adult literacy, is the more significant in influencing the least developed nations. United Nations E-government Survey 2012 points out that lack of infrastructure and functional literacy are two difficulties of the least developed nations, such as, some of the African nations. These two factors illustrate low service provision and user uptake for the majority of the populations such as India, Bangladesh, Bhutan, Pakistan and Nepal [29].
Conclusions
This research proposes the CFR method to integrate DRSA and RS. The result shows four clustering features of the E-government stages. Technically, CFR generates evidential weights of criteria for nations’ ranks by DRSA then, partitions nations into the equivalence classes by RS. The tree structure of clustering stages shows how UN-EGDD rankings depend on criteria. In the case study, enhancing adult literacy, building telecommunication infrastructures, providing online transactional interactions and expanding usage of e-service through education enrollments are critical points from the birth of E-government to the later mature stages.
References
[1] Pawlak, Z., Skowron, A. (2007) Rough Sets: Some Extensions, Information Sciences 177(1): 28-40
[2] Pawlak, Z., Skowron, A. (2007) Rough Sets and Boolean Reasoning, Information Sciences 177(1): 41-73
[3] Pawlak, Z. (1997) Rough Set Approach to Knowledge-based Decision Support, European Journal of Operational Research 99(1): 48-57
[4] Pawlak, Z. (1982) Rough Sets, International Journal of Information and Computer Sciences 11: 341- 356
[5] Pawlak, Z., Wong, S. K. M., Ziarko, W. (1988) Rough Sets: Probabilistic versus Deterministic Approach, International Journal of Man-Machine Studies 29(1): 81-95
[6] Słowiński, R., Stefanowski, J. (1989) Rough Classification in Incomplete Information Systems, Mathematical and Computer Modelling 12(10–11):
1347-1357
[7] Pawlak, Z., Grzymala-Busse, J., Slowinski, R., Ziarko, W. (1995) Rough Sets, Commun. ACM 38(11): 88-95
[8] Pawlak, Z. (2002) Rough Sets and Intelligent Data Analysis, Information Sciences 147(1–4): 1-12
[9] Pawlak, Z. (2004) Flow Graphs and Intelligent Data Analysis. Fundamenta Informaticae 64(1-4): 369-377
[10] Pattaraintakorn, P., Cercone, N., Naruedomkul, K. (2006) Rule Learning:
Ordinal Prediction based on Rough Sets and Soft-Computing, Applied Mathematics Letters 19(12): 1300-1307
[11] Liu, H., Yu, L. (2005) Toward Integrating Feature Selection Algorithms for Classification and Clustering, IEEE Transactions on Knowledge and Data Engineering 17(4): 491-502
[12] Dy, J. G., Brodley, C. E. (2000) Feature Subset Selection and Order Identification for Unsupervised Learning, In Proc. 17th International Conf.
on Machine Learning, Morgan Kaufmann, 247-254
[13] United Nations E-Government Development Database, http://unpan3.un.org/egovkb/
[14] Howard, M. (2001) e-Government across the Globe: How Will “e” Change Government? Government Financial Review 17(4): 6-9
[15] Yildiz, M. (2007) E-government Research: Reviewing the Literature, Limitations, and Ways, Government Information Quarterly 24(3): 646-665 [16] United Nations, United nations E-government survey 2012: E-government
for the people, United Nations Department of Economic and Social Affairs,
United Nations, New York, 2012. http://
http://unpan3.un.org/egovkb/global_reports/index.htm /
[17] Ko, Y.-C., Fujita, H., Tzeng, G.-H.: A Simple Utility Function with the Rules-verified Weights for Analyzing the Top Competitiveness of WCY 2012, Knowledge-Based Systems, 58: 58-65 (2014)
[18] http://govinfo.library.unt.edu/npr/whoweare/historyofnpr.html [19] http://govinfo.library.unt.edu/npr/library/papers/bkgrd/brief.html [20] http://govinfo.library.unt.edu/npr/whoweare/historypart4.html
[21] Keynes, J. M. (1921) The Weight of Argumens, A Treatise on Probability, Macmillan, London
[22] Keynes, J. M. (1921) The Meaning of Probability, A Treatise on Probability, Macmillan, London
[23] Keynes, J. M. (1921) The Foundations of Statistical Inference, A Treatise on Probability, Macmillan, London
[24] Greco, S., Matarazzo, B., Slowinski, R. (2001) Rough Set Theory for Multicriteria Decision Analysis, European Journal of Operational Research 129(1): 1-47
[25] United Nations (2012) Chapter 6 - Expanding Usage to Realize the Full Benefits of E-government, United Nations E-government Survey 2012: E- government for the People, United Nations Department of Economic and Social Affairs, United Nations, New York
[26] United Nations (2012) Chapter 2 - Progress in Online Service Delivery, United Nations E-government Survey 2012: E-government for the People, United Nations Department of Economic and Social Affairs, United Nations, New York
[27] United Nations (2012) Chapter 3 - Taking a Whole-of-government Approach, United Nations E-government Survey 2012: E-government for
the People, United Nations Department of Economic and Social Affairs, United Nations, New York
[28] United Nations (2012) Chapter 4 - Supporting Multichannel Service Delivery, United Nations E-government Survey 2012: E-government for the People, United Nations Department of Economic and Social Affairs, United Nations, New York
[29] United Nations (2012) Chapter 1 - World e-government Rankings, United Nations E-government Survey 2012: E-government for the People, United Nations Department of Economic and Social Affairs, United Nations, New York