This is the accepted version of the following article: Weise, A., Schröger, E., & Horváth, J.
(2018). The detection of higher-order acoustic transitions is reflected in the N1 ERP.
Psychophysiology, 55(7), e13063. https://doi.org/10.1111/psyp.13063, which has been published in final form at onlinelibrary.wiley.com/doi/10.1111/psyp.13063. This article may be used for non-commercial purposes in accordance with Wiley Terms and Conditions for Use of Self-Archived Versions.
Running head: The DETECTION OF HIGHER ORDER ACOUSTIC TRANSITIONS
The detection of higher-order acoustic transitions is reflected in the N1 ERP Annekathrin Weisea, b Erich Schrögera, János Horváthc
Annekathrin Weisea
aInstitut für Psychologie, Universität Leipzig, Neumarkt 9-19,
04109 Leipzig, Germany
bParis-Lodron Universität Salzburg Division of Physiological Psychology Hellbrunnerstraße 34
5020 Salzburg, Austria
e-mail: annekathrin.weise@sbg.ac.at; Tel.: +43 (0) 662 / 8044 - 5161
Erich Schrögera
schroger@uni-leipzig.de
János Horváthb
cResearch Centre for Natural Sciences, Hungarian Academy of Sciences,
Institute of Cognitive Neuroscience and Psychology, P.O.B. 286, 1519, Budapest, Hungary
e-mail: horvath.janos@ttk.mta.hu
Abstract
The auditory system features various types of dedicated change detectors enabling the rapid parsing of auditory stimulation into distinct events. The activity of such detectors is reflected by the N1 event- related potential (ERP). Interestingly, certain acoustic transitions show an asymmetric N1-elicitation pattern: whereas first-order transitions (e.g. a change from a segment of constant frequency to a frequency glide [c-to-g change]) elicit N1, higher-order transitions (e.g. glide-to-constant [g-to-c]
changes) do not. The general consensus attributes this asymmetry to the absence of any available sensory mechanism that is able to rapidly detect higher-order changes. In contrast, our study provides compelling evidence for such a mechanism. We collected electrophysiological and behavioral data in a transient-detection paradigm. In each condition a random (50-50%) sequence of two types of tones occurred, which did or did not contain a transition (e.g. c-to-g and constant stimuli or g-to-c and glide tones). Additionally, the rate of pitch change of the glide varied (i.e. 10 vs. 40 semitones per second) in order to increase the number of responding neural assemblies. The rate manipulation modulated transient ERPs and behavioral detection performance for g-to-c transitions much stronger than for c- to-g transitions. The topographic and tomographic analyses suggest that the N1 response to c-to-g and also to g-to-c transitions emerged from the superior temporal gyrus. This strongly supports a low-level mechanism that allows the fast detection of higher-order changes.
Keywords: attention, change detection, event-related potentials, N1, source localization, transition
1. Introduction
Changes in the auditory input bear information about events that may be potentially relevant for the ongoing behavior. Change detection is therefore an essential function of the auditory system, which is supported by several processes with different contextual scopes. Whereas memory-based processes allow the detection of change in reference to a comprehensive auditory context (Chait, Poeppel, de Cheveigné, & Simon, 2007; Näätänen, Gaillard, & Mäntysalo, 1978; Näätänen, Astikainen, Ruusuvirta, & Huotilainen, 2010), sensory processes (for a review see e.g. Fishbach, Nelken, & Yeshurun, 2001; Phillips, Hall, & Boehnke, 2002) provide precise timing information on brief auditory transitions (e.g. spectral or intensity changes Moore, 2003), which enable, for example, the rapid parsing of the auditory input into distinct events via sound-onset or auditory edge detection (Phillips et al., 2002; Schwartze, Tavano, Schröger, & Kotz, 2012; Winkler, Denham, & Nelken, 2009). Relying on the analysis of event-related potentials (ERPs) and behavioral responses, the goal of the present study was to better characterize the range of auditory transitions detectable by such sensory change detection mechanisms.
Abrupt sound parameter changes (e.g. spectral change, Dimitrijevic, Michalewski, Zeng, Pratt,
& Starr, 2008; Harris, Mills, He, & Dubno, 2008; Jones & Perez, 2001, 2002; Pratt et al., 2009; or intensity change, Dimitrijevic, Lolli, Michalewski, Pratt, Zeng, & Starr, 2009; Harris, Mills, & Dubno, 2007) elicit brief, transient ERP responses. The most prominent transient auditory ERP reflecting change detection is the N1 (Näätanen & Winkler, 1999). This brain wave of negative polarity peaks over frontocentral sites with a latency between 100 to 150 ms following the acoustic change. When the acoustic change occurs within a long, ongoing sound, N1 may be superimposed on a slow negative going waveform, the so called sustained potential, which accompanies the stimulus for its entire duration (Picton, Woods, & Proulx, 1978a, 1978b). N1 often exhibits a polarity inversion at electrodes placed below the plane of the Sylvian fissure (most prominently at the mastoid leads) when the electroencephalogram (EEG) is recorded with a reference electrode placed at the tip of the nose. This polarity inversion suggests a supratemporal generator structure (Vaughan & Ritter, 1970; for a review see Cone-Wesson & Wunderlich, 2003; Hyde, 1997; Martin, Tremblay, & Korczak, 2008; Näätänen &
Picton, 1987). Often, N1 is preceded by a positivity (P1, peaking ~50 ms earlier) and followed by
another positivity (P2, peaking ~100 ms later Näätänen & Picton, 1987). Each of these ERPs is mainly exogenous, that is, they reflect the physical characteristics of the eliciting acoustic event. For example, their latency and amplitude vary as a function of rate of frequency change (Arlinger, Jerlvall, Ahrén,
& Holmgren, 1976; Arlinger et al., 1982; Noda, et al., 1999; Ruhm, 1970, 1971; Yingling &
Nethercut, 1983), and spectral complexity (Maiste & Picton, 1989; Seither-Preisler, Krumbholz, &
Lütkenhöner, 2003; Shahin, Roberts, Miller, McDonald, & Alain, 2007; Shahin, Roberts, Pantev, Trainor, & Ross, 2005). Given that the P1, N1, and P2 are affected differentially by stimulus parameters (e.g. Shahin et al., 2005; Shahin et al., 2007), stimulus expectancy (Viswanathan & Jansen, 2010), as well as various participant characteristics (e.g., age, arousal state, etc., for a review see Crowley & Colrain, 2004), the individual components most likely reflect functionally different processes (e.g. Chait, Poeppel, & Simon, 2008; Ross & Tremblay, 2009; for a review see Crowley &
Colrain, 2004). This notion receives further support from the fact that they originate from spatially distinct generators (Chait et al., 2008; Meyer, Baumann, & Jancke, 2006; Pantev, Eulitz, Hampson, Ross, & Roberts, 1996).
Interestingly, early reports suggested that not all types of acoustic changes elicited transient auditory ERPs (Clynes, 1969; Kohn, Lifshitz, & Litchfield, 1978). Whereas a change in an initially constant (temporally invariant) sound parameter (e.g. frequency) of a continuous tone - here referred to as first-order transition - lead to the elicitation of transient ERP responses, a transition from nonconstant parameters (i.e. parameters which continually change in time)- here termed higher-order transition - did not elicit such ERPs. For example, it has been shown that a transition from a constant- frequency segment to a gradually rising- or falling-frequency segment (in the following referred to as glide segment) in a continuous tone elicited a transient ERP response (see also e.g. Noda et al., 1999).
In contrast, a transition from the identical glide segment to a constant-frequency segment did not (Clynes, 1969; Kohn et al., 1978). The ERP results (recorded in a passive listening setup) were paralleled by that of the response times collected in a separate detection task setting: g-to-c transitions (for which N1 was absent) lead to numerically larger response time dispersion (i.e. within subject variability of single-trial reaction times) than (N1-eliciting) c-to-g transitions (Kohn et al., 1978).
Similar results were found in paradigms administering analogous changes in intensity (Clynes, 1969;
Kohn, Lifshitz, & Litchfield, 1980). It is important to note that despite the lack of a transition-related ERP, the g-to-c transition was still perceivable. That is, it was evident that a transition took place, but its onset could not be precisely detected (as reflected by the numerically larger RT dispersion (Clynes, 1969; Kohn et al., 1978, 1980).
One may suggest that the lack of auditory ERPs to higher-order transitions reflects the absence of auditory functions dedicated to the detection of such changes, and that the successful detection of such transients is made possible by other (memory-based) functions which are not directly reflected in the ERPs. That is, there might be a qualitative processing difference between first- and higher order transitions. To put it another way, there might be neural structures dedicated to the fast detection of first-order changes while no such structures exist for detecting higher-order transitions. In a recent study administering a passive listening paradigm, however, we found first indices arguing against this view (Weise, Schröger,
Fehér
, Folyi, &Horváth
, 2012). We found well identifiable N1s to higher- order changes when a sufficiently fast rate of pitch change was utilized (i.e. 40 semitones / s [ST/s] in contrast to the 10 ST/s rate utilized by Clynes, 1969; Kohn et al., 1978, 1980), especially when spectrally rich tones were used (Weise et al., 2012).The goal of the present study was to further investigate higher-order auditory change detection by means of ERPs and behavioral responses. The present study superseded the previous one in three ways. First, it allowed for a direct assessment of the transient waveform independently from the overlapping continuous tone-related sustained ERP activity. In order to separate the transient-related ERP from the sustained activity, the present experiment contrasted ERPs elicited by tones with and without a transition. Specifically, ERPs to g-to-c transitions were derived as the difference of ERPs elicited by tones with a g-to-c transition and ERPs elicited by glide-only tones; similarly, ERPs to c- to-g transitions were derived as the difference of ERPs to tones with c-to-g transitions and ERPs elicited by tones with a constant frequency. Second, we applied multi-channel EEG-recording and variable resolution electromagnetic tomography (VARETA; Bosch-Bayard et al., 2001) to localize the N1 generators, with the hypothesis that the transient-related ERPs, especially those elicited by g-to-c transitions, reflected auditory processing rather than postsensory evaluation processes.Third, we tested whether the pattern of behavioral detection performance as a function of the pitch change rate and the
type of transition resembled that of the ERPs. We administered a go/no-go transient-detection task (Pfefferbaum, Ford, Weller, & Kopell, 1985). Participants responded to tones with transitions (go, p = 50%); while withholding the response to tones without transitions (no-go, p = 50%). Based on
previous data on auditory change detection (e.g. Clynes, 1969; Kohn et al., 1978, 1980; Weise et al., 2012) we hypothesized that the 10 vs. 40 ST/s pitch change rate should strongly influence change detection for g-to-c transitions as indicated via a strong modulation of N1 and behavioral measures (sensitivity index, reaction times) but much less so for c-to-g transitions.
2. Method
2.1 Participants: Thirteen young adult volunteers (4 males; all right-handed) with self-reported normal hearing (20-36 years, mean age: 26 years) participated in the experiment either for course credit or payment. Participants’ hearing was not tested. Data from four additional participants were excluded from data analysis due to a strong decrease in behavioural performance with increasing experimental time, or technical problems, respectively. Prior to the beginning of the measurements all participants gave written informed consent after information about the experimental procedures had been provided. The study was approved by the local ethics committee of the Medical Faculty of the University of Leipzig. The experimental protocol conformed to the Declaration of Helsinki and the ethics guidelines of the German Association of Psychology (ethics board of the Deutsche Gesellschaft für Psychologie, DGPs: http://www.dgps.de/dgps/aufgaben/ethikrl2004.pdf). During EEG recording the participants were sitting in a chair in an acoustically attenuated and electrically shielded booth and performed a go/no-go task related to the tones (see below for details). Their task was to attend the stimuli and respond as fast as possible whenever they perceived a transition within a tone (see below for details on the stimuli). Participants responded by pressing a button with the thumb of their dominant (i.e. right) hand. The participants were additionally asked to fixate a cross on the screen (located in front of them) throughout the auditory stimulation in order to reduce (eye) movement artefacts.
2.2 Stimuli and procedure: We utilized seven types of tones (see Figure 1). Each of them was 1300 ms in duration (including 5 ms attack and decay ramps) and consisted of five equally weighted harmonics (1 × f0, 2 × f0, 3 × f0, 4 × f0, 5 × f0) with the base frequency (f0) of the constant segment being 440 Hz. Four of the seven tone types served as targets (i.e. ‘go’ trials). They can be described by two attributes with different levels: 1) transition type (g-to-c or c-to-g, described below), 2) rate of pitch change (10 or 40 ST/s; see below).
1) Transition type: Each target tone consisted of two segments: a frequency glide, and a constant-frequency segment. The duration of the first segment was 900 ms, the second one 400 ms.
Tones with g-to-c transitions started with a frequency glide with exponentially decreasing frequency, which was followed by a constant-frequency segment. Tones with c-to-g transitions started with a constant-frequency segment, which was followed by a frequency glide with exponentially increasing frequency. The segment preceding the transition was chosen to be of 900 ms duration, because for c- to-g transitions the transient ERP amplitude is known to increase with the duration of the constant segment (Clynes, 1969; Maiste & Picton, 1989).
2) The rate of pitch change was 10 or 40 ST/s for the frequency glide. Note that the rate of change was exponential in frequency (as measured in Hz units), and it was linear in pitch (as measured in semitones).
Each target tone was paired with a nontarget tone (‘no-go’ trial) in each condition. The nontarget tone started to differ from the corresponding target tone 900 ms after tone onset. The nontarget tone continued the initial segment without a transition. That is, two of the no-go tones were glide-only tones (with 10 or 40 ST/s pitch change rates corresponding to that of the initial segment of the respective target tones). In the other two conditions, no-go tones were constant-frequency tones (corresponding to the initial segment of the respective target tones, see Figure 1).
The tones were offline generated via CSOUND (version 5.17.3, http://www.csounds.com/).
Stimuli were presented binaurally via headphones with an intensity of 60 dB(A) (measured for the constant-frequency segments by an HMS III artificial head; HEAD acoustics, Herzogenrath,
Germany) with a mean stimulus onset asynchrony of 2000 ms. The SOA was jittered (1800 to 2200 ms in 100 ms steps) to attenuate the anticipation of stimulus occurrence. SOA and stimulus type were pseudorandomized so that each SOA and stimulus type occurred with equal probabilities. The stimulation was split into 16 experimental blocks (i.e. 4 blocks per condition), each block lasting about 3.5 min. The block order was counterbalanced across participants such that each of the conditions occurred equally often at all of the possible 16 positions within the block order across participants.
Overall, each of the test stimulus types was presented 200 times. The stimulation was run via MATLAB (The MathWorks, Natick, Massachusetts, U.S.A) using the Psychophysics toolbox (Brainard, 1997). The experiment lasted about 3 to 4 hours, including the time for electrode attachment and removal as well as individual breaks as needed.
INSERT FIGURE 1 ABOUT HERE
2.3 Behavioral data analysis:
Reaction times (RTs) were measured exclusively for the correct responses within the 100 to 850 ms time window relative to the onset of the transition. Trials with responses outside the predefined RT window were rejected from further (behavioral and ERP) analysis. Individual reaction times were calculated as the median of the reaction times for hits. (As reaction time distributions are often skewed, the median provides a better estimate of the typical reaction time than the mean.) To measure the dispersion of response speed we calculated the interquartile range of (single trial) reaction times, i.e. the distance between the first quartile (25th percentile) and the third quartile (75th percentile). A smaller interquartile range indicates that values are less dispersed around the median.
Individual sensitivity indices (d’ values, Macmillan & Creelman, 2005) were calculated separately for each condition. In order to avoid infinite d’ values in case of perfect accuracy, 0.5 was added to the number of hits (responses to tones with transitions) and to the number of false alarms (responses to tones without transition), and 1 was added to both the number of targets and to the number of nontargets, before calculating hit- and false alarm rates (Hautus, 1995). By using this adjustment, the highest d’ value a participant could reach by responding 100% correct and 0% false was 5.62 (given
that all trials were included in the analysis). Data from one participant was excluded from the analysis of the d’ values, because the useable number of trials was 25% less in one condition compared to the others (i.e. 150/200), thus, making the analysis of sensitivity indices not comparable across conditions.
d’s, median reaction times, and the dispersion of reaction times were submitted to two-way repeated measures analyses of variances (ANOVAs) with the two-level factors Transition type (g-to-c, c-to-g) and Rate of pitch change (10ST/s, 40ST/s). One might argue that nonparametric statistics would be a better choice here. However, we are interested in the interaction, which could be tested (nonparametrically) by contrasting the respective behavioral measure of (g10-to-c - g40-to-c) - (c- tog10 - c-to-g40) against zero. Given that the Shapiro-Wilk tests for the critical differences do not suggest any violation of the normality assumption (d prime: W = 0.96343, p = 0.8315; RTs: W = 0.92807, p = 0.3215; interquartile range of RTs: W=0.99011, p = 0.99969), the ANOVA seems to be a valid choice.
2.4 EEG data recording and analysis: Using a BIOSEMI Active-Two amplifier, electroencephalographic (EEG) activity was recorded with Ag/AgCl electrodes from 64 standard channel locations according to the 10% system (Nuwer et al., 1998) and from the left and right mastoids. Two electrodes specific to the BioSemi (http://www.biosemi.com/) acquisition montage (Common Mode Sense and Driven Right Leg) served for reference and ground purposes during the recording. An electrode placed on the tip of the nose served as offline-reference. Additionally, the electrooculogram (EOG) was measured with one electrode placed above the nasion and two electrodes below the outer canthi of the eyes (Schlögl et al., 2007). EEG and EOG signals were sampled at 512 Hz.
2.4.1 Preprocessing for ERP analysis: Data were first preprocessed and analyzed offline using EEGLAB (version 10.2.2.4b), an open source toolbox for MATLAB: After offline filtering with a 0.1 to 100 Hz finite impulse response (FIR) band-pass filter (Kaiser window, order 9274), automatic eye- movement correction was applied on the data (Schlögl et al., 2007). Subsequently, EEG data were filtered with a 30 Hz low-pass filter (FIR, Kaiser window, order 188). Thereafter, preprocessing was undertaken via Fieldtrip (revision 31199ed; Oostenveld, Fries, Maris, & Schoffelen, 2011).
For the ERP analysis, the first two trials of each stimulation block were excluded from further data processing and analysis. For the remaining trials, two different types of epochs were formed: one time-locked to tone onset and one time-locked to the time point when a transition could occur (see below for details). This procedure was also applied for trials in which a tone did not contain a transition. For both epoch types (tone onset and transition-related) single-trial epochs were averaged separately for each stimulus type. Epochs with a signal range exceeding 150 µV on any channel were discarded from further processing.
Epochs time-locked to tone onsets (Figure 3, left): For each trial a 1600-ms long epoch was extracted from the continuous EEG data, including a 100 ms prestimulus baseline interval. The analysis of these epochs allowed the assessment of the sustained responses and their development preceding the transition, including justifying the conclusion that the ERP responses elicited by the transitions in the posttransition period were plausibly separable from the on-going activity related to the preceding tone segment.
Transition-time-locked epochs (Figure 3, right): For each trial an epoch of 700 ms duration including a 100 ms pretransition baseline interval (i.e. the 800-1500 ms following tone-onset) was extracted. The short epoch length used in this approach resulted in the inclusion of more artefact-free epochs in the individual average ERPs, and consequently a higher signal-to-noise ratio for the between-condition comparison of transition-related ERPs. The number of single epochs for each individual stimulus type entering the analysis was higher than 140. In more detail, on average <4.5%
of 200 trials per stimulus type were rejected (ranging from 0% in each of the condition to 12.5% (g10- to-c), 13% (glide10), 8% (g40-to-c), 10.5% (glide40), 27.5% (c-to-g10), 29% (constant, counterpart of c-to-g10), 5.5% (c-to-g40), or 7% (constant, counterpart of c-to-g40), respectively.
To separate the transient waveform from the overlapping sustained negativity, ERPs elicited by tones without transition were subtracted from the corresponding ERPs to tones with transition.
2.4.2 ERP analysis: Where applicable, the transition-related N1 response was identified by visual inspection of the group-average transition-minus-no transition difference waveform in the 100- 200 ms in the posttransition intervals. Based on this, individual N1 amplitudes were measured in the
Fz and the mastoid (the average of the left and right mastoid) signals as the mean amplitude in the 30- ms window centered at the latency of the group-average difference waveform in all but the g10-to-c condition. As in the g10-to-c condition no group-average peak was identifiable under visual inspection, in this condition the same window was used to assess the mean ERP amplitudes as in the g40-to-c condition. Because the maximal amplitude elicited by different types of transitions may differ between conditions per se, in order to assess the magnitude of modulation by the rate of pitch change factor, the amplitudes measured in the g-to-c and the c-to-g conditions were separately normalized.
That is, the individual mean amplitude values of all g-to-c conditions were divided by the group-mean amplitude of the g40-to-c condition. Similarly, the individual mean amplitude values of all g-to-c conditions were divided by the group-mean amplitude of the c-to-g40 condition. The normalized amplitudes measured at Fz and in the mastoid signals were submitted to Transition type × Rate of pitch change repeated measures ANOVAs.
For c-to-g transitions, clear N1 peaks were identifiable in the group-average ERP both at the Fz and the mastoid sites. A jackknife-based scoring method (Kiesel, Miller, Jolicoeur, & Brisson, 2008) was administered to assess potential peak latency differences between conditions with different rates of pitch change. The latencies were measured from the transition-minus-no transition difference wave in specified time windows (see Table 3) following transient onset at mastoid and frontocentral sites, and were submitted to an Electrode (Fz, M) × Rate of pitch change (10 ST/s vs. 40 ST/s) repeated measures ANOVA. For this calculation, jackknife-adjusted F and p values (Ulrich & Miller, 2001) are reported.
2.4.3 Topographic analysis: To evaluate differences in topographic distribution between N1 across conditions, topographic maps of absolute voltage were calculated for the corresponding transition-minus-no transition difference waves.
2.4.4 Tomographic analysis: To estimate the cortical generator structure underlying N1, a variable resolution electromagnetic tomography (VARETA; Bosch-Bayard et al., 2001) was applied by utilizing MATLAB and the Tomographic Viewer (Neuronic, Version 2.0.4.0). The means of the
amplitudes within the specified N1 time window (see Table 2; for mastoids) of the ERPs to tones with and without transient were entered in the analysis separately for each participant and condition.
VARETA uses a discrete spline distributed inverse model to estimate the spatially smoothest intracranial distribution of primary current densities (PCDs) that correspond to the EEG- signals measured at the scalp. In doing so, VARETA estimates the smoothing parameter voxel-wise, thus allowing for variable amounts of spatial smoothness and localizing discrete and distributed sources with equal accuracy. The regularization parameter lambda, which controls the smoothness of the inverse solution, was automatically calculated for each of the participants. As possible sources of the N1 signal 3244 grid points (‘voxels’) of a 3D grid (7 mm grid spacing) were used. This grid and the arrangement of 64 cephalic electrodes according to the international 10-20 system plus additional two electrodes at the mastoids as well as the reference electrode used for recording the EEG data were placed in registration with the probabilistic brain atlas (developed at the Montreal Neurological Institute: Evans et al., 1993). This atlas provides an average of magnetic resonance imaging scans from 305 brains (‘average brain’). Providing the information on where gray matter is expected in a mature young adult, the probabilistic brain atlas allows reducing artificial ‘ghost sources’ by restricting the PCDs to the gray matter.
The N1-PCDs were determined by subtracting the PCD of the ERP to the sound without transient from the PCD of the ERP to the sound with transient. To localize the N1 sources, statistical parametric maps of the N1-PCD were constructed by utilizing a voxel-by-voxel Hotelling T2-test against zero separately for each condition. To compare the N1 solutions between the g10-to-c and g40- to-c conditions as well as between the c-to-g10 and c-to-g40 conditions, the corresponding PCDs were contrasted by utilizing a voxel-by-voxel Hotelling T2-test. Random field theory (Worsley, Marrett, Neelin, & Evans, 1996) was applied to correct activation thresholds for spatial dependencies between voxels.
3. Results
3.1 Behavioral data
The behavioral results (hit rates, false alarm rates, mean reaction times (RTs) and d’ values) obtained in response to the go-trials (i.e. to the tones with transition) are summarized in Table 1 and Figure 2. In all conditions tones with a transient change were detected with relatively high accuracy.
The two-way repeated measures ANOVA comparing dꞌ values revealed a significant transition type main effect (F(1,11) = 89.27; p < .001; partial eta-squared = .89) as well as a rate of pitch main effect (F(1,11) = 22.36; p = .001; partial eta-squared = .67). This indicates that detection performance was more accurate for c-to-g (vs. g-to-c) transitions as well as for the 4 ST/s (vs. 10 ST/s) rate of pitch change, respectively. Importantly, the Transition type × Rate of pitch change interaction was significant (F(1,11) = 7.17; p = .021; partial eta-squared = .50). This indicates that detection accuracy was more strongly modulated by the rate of pitch change (10 and 40 ST/s) for g-to-c transitions than for c-to-g transitions.
The two-way repeated measures ANOVA of the reaction times revealed a significant transition type main effect (F(1,12) = 86.38; p < .001; partial eta-squared = .88) as well as a rate of pitch change main effect (F(1,12) = 170.00; p < .001; partial eta-squared = .93). This indicates that reaction times were shorter for c-to-g (vs. g-to-c) transitions as well as for the 40 ST/s (vs. 10 ST/s) rate of pitch change, respectively. The interaction between the two factors was significant (F(1,12) = 5.02; p = .045; partial eta-squared = .30). This indicates that reaction times were more strongly modulated by the rate of pitch change (10 and 40 ST/s) for g-to-c transitions than for c-to-g transitions.
The two-way repeated measures ANOVA of the RT dispersion measures (individual interquartile ranges) revealed a significant transition type main effect (F(1,12) = 17.55; p = .001;
partial eta-squared = .59) as well as a rate of pitch change main effect (F(1,12) = 11.72; p = .005;
partial eta-squared = .49). This indicates that the RT dispersion was narrower for c-to-g (vs. g-to-c) transitions as well as for the 40 ST/s (vs. 10 ST/s) rate of pitch change, respectively. The interaction between the two factors was significant (F(1,12) = 9.77; p = .009; partial eta-squared = 0.45). This indicates that RT dispersion was more strongly modulated by the rate of pitch change (10 and 40 ST/s) for g-to-c transitions as compared to c-to-g transitions.
INSERT TABLE 1 ABOUT HERE
INSERT FIGURE 2 ABOUT HERE
3.2 ERP data:
Each stimulus onset elicited a clear P1-N1-P2 waveform (Figure 3, left column), which was followed by a sustained negativity. After the transition at 900 ms, distinct, transient ERP waveforms were observable for the two c-to-g transitions, and for the g40-to-c transition. These transient ERPs were clearly superimposed on the sustained negativity, and were analyzed in epochs time-locked to the onset of the transient change (Figure 3, middle).
3.2.1 N1 amplitudes to transient changes
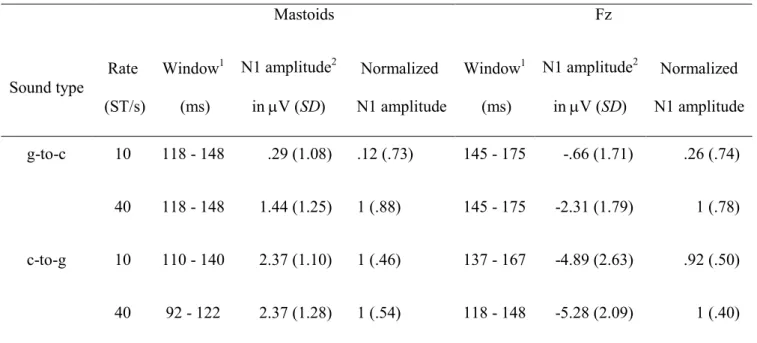
For all but the g10-to-c transition, a clearly identifiable negativity with frontocentral maximum (Figure 3 right) was observable. This negative deflection was accompanied by a positive one at the mastoids, with an earlier peak (Figure 3 left and middle, Figure 4, Table 1). The N1 amplitude to the g40-to-c transition appeared to be smaller in size compared to the amplitudes in the c- to-g transitions.
The two-way repeated measures ANOVA of the normalized N1 amplitudes measured in the mean mastoid signal yielded a significant transient type main effect (F(1,12) = 11.04, p = .006, partial eta-squared = .48) and a rate of pitch change main effect (F(1,12) = 6.08, p = .030, partial eta-squared
= .34). This indicates that N1 amplitudes were larger for c-to-g (vs. g-to-c) transitions as well as for the 40 ST/s (vs. 10 ST/s) rate of pitch change, respectively. The Transient type × Rate of pitch change interaction was significant (F(1,12) = 7.92, p = .016, partial eta-squared = .40). This indicates that the rate of pitch change (10 and 40 ST/s) modulation of the N1 amplitude was larger for g-to-c than for c- to-g transitions.
The two-way repeated measures ANOVA of the normalized N1 amplitudes measured at the frontocentral lead yielded no significant Transient type main effect but a significant rate of pitch change main effect (F(1,12) = 13.20, p = .003, partial eta-squared = .52). The latter indicates that N1 amplitudes measured at the frontocentral lead were larger for the 40 ST/s (vs. 10 ST/s) rate of pitch
change. The Transient type × Rate of pitch change interaction was significant (F(1,12) = 7.17, p = .020, partial eta-squared = .37. Thus, also at Fz, the rate of pitch change (10 and 40 ST/s) modulation of the N1 amplitude was larger for g-to-c than for c-to-g transitions.
INSERT FIGURE 3 ABOUT HERE INSERT TABLE 2 ABOUT HERE
3.2.2 N1 peak latencies to transient c-to-g changes
The two-way repeated measures ANOVA of the N1 peak latencies to c-to-g transitions with the 2-level factors electrode site and rate of pitch change yielded a significant electrode main effect (F(1,12) = 6.81, p = .022). That is, N1 peak latency for c-to-g transitions was significantly shorter at the mastoids than at Fz. Further, the ANOVA revealed a significant rate of pitch change main effect (F(1,12) = 15.96, p = .002), showing that N1 peaked earlier when the rate of pitch change was fast.
There was no significant interaction between the two factors.
INSERT FIGURE 4 ABOUT HERE INSERT TABLE 3 ABOUT HERE
3.2.3 Tomographic data
The ERP data suggest generators in auditory cortical areas for g40-to-c and the two c-to-g transitions. This was confirmed by the statistical results of the source-space reconstruction for the activity in the N1 latency range (Figure 5). The reconstructed generator configurations for all transition types yielded a maximum in superior temporal (i.e. auditory) areas, though differing in the hemisphere and strength (see also Table 4). Further, the contrast between the different rates of pitch change (Figure 5, bottom) suggest that the rate manipulation modulated the N1 source activation in mainly supratemporal areas for both g-to-c and c-to-g transitions.
INSERT FIGURE 5 ABOUT HERE
INSERT TABLE 4 ABOUT HERE 4. Discussion
The goal of the present experiment was to better characterize the brain’s sensory functions for the detection of auditory transitions. In particular, we compared the processing of higher-order acoustic changes (i.e. g-to-c transitions) within spectrally rich, continuous tones with the processing of first-order acoustic changes (i.e. c-to-g transitions) when the rate of pitch change of the glide was either slow or fast. Our behavioral, ERP, and tomographic data clearly speak in favor for sensory change detection mechanisms (as compared to memory mechanisms) that allows detecting higher order acoustic transitions. This is in line with our hypothesis (Weise et al., 2012) and challenges commonly held views (e.g. Clynes, 1979; Kohn et al., 1978; Näätänen & Picton, 1987).
Let us first consider the behavioral outcome in more detail. The go/no-go paradigm allowed us to measure behavioral detection performance by means of reaction times and sensitivity indices for the different types of transitions. The manipulation of the pitch change rate modulated behavioral detection performance (sensitivity index as well as reaction time) for g-to-c transitions much stronger in comparison to that for c-to-g transitions. As expected, detection performance was weakest for g10- to-c transitions as reflected by the lowest sensitivity index, longest reaction time, and widest reaction time dispersion among the four types of transitions (Table 1). Nevertheless, as indicated by high d’
values (>3.5 for all conditions) changes in pitch were relatively easy to detect, irrespective of the type of transitions or the rate of pitch change. That is, g-to-c pitch changes were well-detectable. Related to that, participants refrained from guessing: they responded to all types of change including the g10-to-c transition in almost no cases before transition onset, and often still before the offset of the sound (i.e.
<400 ms following the transient). Similar to the studies by Kohn et al. (1978, 1980) the present study revealed wider reaction time dispersion for g-to-c-, than to c-to-g transitions featuring segments with a low rate of pitch change. In contrast with our findings, however, Kohn and colleagues found that participants often responded in an anticipatory manner (i.e. before or very close to the onset of the g- to-c transition (Kohn et al., 1978, Figure 5d). This suggests that listeners had difficulty ‘in perceiving a clear-cut, distinct stimulus change’. This difference is likely caused by stimulation and task
differences: The present paradigm administered spectrally rich tones in a go/no-go paradigm, whereas Kohn et al, (1978) presented pure tones in the context of a detection task.
Change detection performance in the present study was accompanied by an analogous asymmetry in the N1 elicitation pattern. Increasing the rate of pitch change from 10 to 40 ST/s resulted in a stronger N1 amplitude modulation for g-to-c transitions compared to c-to-g transitions. In particular, a distinct N1 was elicited only for g40-to-c transitions but not for g10-to-c transitions (Clynes, 1969; Kohn et al., 1978), while a clear N1 was evoked to c-to-g transitions irrespective of the pitch change rate (for comparable findings, see Weise et al., 2012). From a more general point of view our current data corroborate previous findings showing that N1 amplitude can be modulated by the manipulation of the rate of pitch change (Arlinger, et al., 1976; Noda et al., 1999; Ruhm, 1970). They also allow conclusions about auditory change detection at cortical level (Näätänen & Picton, 1987;
Näätänen & Winkler, 1999).
Importantly, we localized the N1 generators not only for c-to-g transitions in the supratemporal areas (Noda et al., 1999) but also the N1 generators for g-to-c transitions (Figure 5).
This suggests that the neural assemblies engaged in change detection are localized in auditory regions and N1 can thus be considered to reflect sensory rather than postsensory evaluation mechanisms. This interpretation is also supported by a more conventional analysis of N1 topographies (Figure 3), which showed that the frontocentrally distributed N1 to g40-to-c transition inverted polarity at the mastoids.
The lack of the N1 reversal at mastoids in our previous study (Weise et al., 2012) might be explained by a relatively low signal-to-noise ratio resulting from the fact that participants’ attention was engaged in watching a silent movie with subtitles, while attention was directed towards the sounds in the present study. As attention enhances the auditory N1 (Hillyard, Hink, Schwent, & Picton, 1973), the resulting higher signal/noise ratio in the present study allowed the clear identification of the N1 polarity reversal at the mastoids, which helped to rule out alternative interpretations regarding the nature of the transient-related waveforms.
What is the exact nature of the sensory mechanism that enables the fast detection of higher order changes? In fact, this is less understood so far. Here we suggest two alternatives, both of which can account for the current pattern of results and which are mutually exclusive. In our previous study
(Weise et al., 2012), we suggested that 1) first- and higher-order acoustic transitions (as defined in the introduction) activated different types of change detectors, and 2) that the number of detectors sensitive to higher-order transitions were much lower than those sensitive to first-order transitions.
The idea that different transitions are processed by different parts of the auditory system seems plausible, for example, neural responses to onsets and offsets in the auditory cortex seem to be driven by different synaptic connections (Scholl, Gao, & Wehr, 2010). Similar explanations have also been offered for increasing vs. decreasing frequency glides (Maiste & Picton, 1989), and for ramped vs.
damped sinusoids (Lu, Liang, & Wang, 2001). With respect to the current findings, the hypothesis suggests that high rates of pitch change were necessary to engage a sufficient number of higher order change detectors to evoke a N1 to g-to-c transitions. In contrast, c-to-g transitions with low pitch change rates were appropriate to engage a sufficient number of first-order change detectors to elicit N1 (Weise et al., 2012). Also the finding that the N1 latency to c-to-g transitions decreased with increased rate of pitch change (for comparable results see Noda et al., 1999) can be reconciled with this account.
If this account holds, the related conclusion that the number of the higher-order change detectors is relatively low may also imply that functions relying on the detection of higher-order changes may be affected earlier by the deterioration of the auditory system than those relying on the detection of first- order changes.
2) Instead of assuming the involvement of different types and numbers of detectors, the neural adaptation hypothesis may offer an alternative explanation for the current results based on the frequency-specific adaptation pattern of the N1 response (e.g., Butler, 1968; Näätänen et al. 1988;
May et al. 1999; Lanting, Briley, Sumner, & Krumbholz, 2013; Herrmann et al., 2014). Although N1 generator structures are frequency-specific, the level of specificity is low, that is, for example, a 1000 Hz tone also activates N1 generators that have a “best frequency” at 500 Hz. Furthermore, the activation of the N1 generators results in adaptation: a second presentation of the tone will result in lower N1 amplitude. In the present context, for c-to-g transitions, the neural adaptation hypothesis suggests that the transition-related N1s are elicited with similar amplitude because the speed of frequency change leads to the activation of frequency-specific N1 generators which have not been adapted to the frequency of the initial constant segment. For g-to-c transitions, the neural adaptation
hypothesis suggests that the glide segment tone frequencies also activate N1 generator structures sensitive to the constant segment frequencies. As the difference between the g10 and constant segment frequencies is smaller than the difference between the g40 and the constant segment, the magnitude of N1 adaptation is larger for the g10-to-c transitions than for the g40-to-c ones. This leads to the elicitation of a more distinct N1 to the g40-to-c transitions, which is also reflected in the behavioral response pattern.
Simple as it seems, this general formulation of the neural adaptation hypothesis relies on various assumptions regarding N1 elicitation, and the adaptation of N1 generator structures, especially in explaining the N1 pattern observable for the g-to-c transitions. To highlight these assumptions, in the following, we inspect two specifications of the general hypothesis – one of them being more plausible in explaining the current pattern of results than the other one. The first specification relies on the reasonable assumption that adaptation of the N1 generator structures occurs only when N1 is actually elicited. This means that the N1 elicited by the glide onset of the g10-to-c tone results in strong adaptation which virtually eliminates the N1 that could be elicited by the onset of the constant segment, whereas for the g40-to-c tone, the adaptation is weaker (because the glide starting frequencies are much higher than those of the constant segment). This allows the elicitation of a distinct N1 related to the onset of the constant segment. In this interpretational frame, it seems fair to compare this N1 elicitation pattern to that elicited by discrete stimuli. Such a comparison shows that this particular formulation of the hypothesis is rather implausible. Countless studies in the literature showed that when tones separated by an onset-to-onset interval on the order of 900 ms (equaling the interval between the onset of the glide and the constant segment), the second tone still elicits an N1, even if the tones are identical (e.g. Budd, Barry, Gordon, Rennie, & Michie, 1998; Hari, Kaila, Katila, Tuomisto, & Varpula, 1982; May & Tiitinen, 2010).
The second specification of the neural adaptation hypothesis assumes that adaptation of the N1 generator structures occurs even if no discernible N1 is elicited. That is, because the tone frequencies of the glide segment in a g10-to-c transition are close to the frequencies of the constant segment, the glide results in a continuous activation, and increasing adaptation of N1 generators that would respond to the constant frequency segment. For the g40-to-c transition, the magnitude of such
adaptation is lower due to the larger frequency separation between the glide and constant segments.
Thus, in the g10-to-c transitions, the constant frequency specific N1 generator structures are more adapted than in the g40-to-c transitions when the transition occurs, which leads to the elicitation of a more distinct N1 to the g40-to-c transitions, which is also reflected in the behavioral response pattern.
Although - at first sight – the second specification of the neural adaptation account appears somewhat questionable, empirical data do in fact support its proposition. For example, it has been suggested that the sustained ERP response reflects the activity of N1 generator structures: Individual N1s to rapidly presented tones (< 150 ms) do resemble the sustained response (May & Tiitinen, 2010; Brugge et al., 2009; Nourski & Brugge, 2011). According to our view this second specification of the neural adaptation hypothesis is the more plausible one (compared to the first specification). Still, the exact nature of the sensory mechanism requires further research to better understand whether neural adaptation or the involvement of different types and numbers of change detectors enable higher order change detection.
Taken together, the present results demonstrate that the auditory system has similar processing capabilities for the detection of higher-order acoustic changes as for those of first-order changes, although the exact nature of this sensory mechanism still needs to be clarified. These supratemporal cortical structures may allow precisely identifying changes in acoustic signals like music or speech which cannot be accomplished with comparable precision by memory-based processes.
5. References
Alho, K., Paavilainen, P., Reinikainen, K., Sams, M., & Näätänen, R. (1986). Separability of different negative components of the event-related potential associated with auditory stimulus processing.
Psychophysiology, 23(6), 613–623. https://doi.org/10.1111/j.1469-8986.1986.tb00680.x Arlinger, S. D., Jerlvall, L. B., Ahrén, T., & Holmgren, E. C. (1976). Slow evoked cortical responses
to linear frequency ramps of a continuous pure tone. Acta Physiologica Scandinavica, 98(4), 412–424. https://doi.org/10.1111/j.1748-1716.1976.tb10330.x
Arlinger, S., Elberling, C., Bak, C., Kofoed, B., Lebech, J., & Saermark, K. (1982). Cortical magnetic- fields evoked by frequency glides of a continuous tone. Electroencephalography and Clinical Neurophysiology, 54(6), 642–653. https://doi.org/10.1016/0013-4694(82)90118-3
Bosch-Bayard, J., Valdés-Sosa, P., Virues-Alba, T., Aubert-Vázquez, E., John, E. R., Harmony, T., … Trujillo-Barreto, N. (2001). 3D statistical parametric mapping of EEG source spectra by means of variable resolution electromagnetic tomography (VARETA). Clinical
Eelectroencephalography, 32(2), 47–61. https://doi.org/10.1177/155005940103200203 Brainard, D. H. (1997). The Psychophysics Toolbox. Spatial Vision, 10(4), 433–436.
https://doi.org/10.1163/156856897X00357
Brugge, J. F., Nourski, K. V., Oya, H., Reale, R. A., Kawasaki, H., Steinschneider, M., & Howard, M.
A. (2009). Coding of Repetitive Transients by Auditory Cortex on Heschl’s Gyrus. Journal of Neurophysiology, 102(4), 2358–2374. https://doi.org/10.1152/jn.91346.2008
Budd, T. W., Barry, R. J., Gordon, E., Rennie, C., & Michie, P. T. (1998). Decrement of the N1 auditory event-related potential with stimulus repetition: habituation vs. refractoriness.
International Journal of Psychophysiology, 31(1), 51–68. https://doi.org/10.1016/S0167- 8760(98)00040-3
Butler, R. A. (1968). Effect of changes in stimulus frequency and intensity on habituation of the human vertex potential. The Journal of the Acoustical Society of America, 44(4), 945–950.
https://doi.org/10.1121/1.1911233
Chait, M., Poeppel, D., Cheveigné, A. de, & Simon, J. Z. (2007). Processing Asymmetry of
Transitions between Order and Disorder in Human Auditory Cortex. Journal of Neuroscience, 27(19), 5207–5214. https://doi.org/10.1523/JNEUROSCI.0318-07.2007
Chait, M., Poeppel, D., & Simon, J. Z. (2008). Auditory temporal edge detection in human auditory cortex. Brain Research, 1213, 78–90. https://doi.org/10.1016/j.brainres.2008.03.050
Clynes, M. (1969). Dynamics of vertex evoked potentials: The R-M brain function. In E. Donchin &
L. B. Lindsley (Eds.), Average evoked potentials: Methods, results, evaluation (pp. 363–374).
Washington D.C.: NASA.
Cone-Wesson, B., & Wunderlich, J. (2003). Auditory evoked potentials from the cortex: Audiology applications. Current Opinion in Otolaryngology & Head and Neck Surgery, 11(5), 372–377.
https://doi.org/10.1097/00020840-200310000-00011
Crowley, K. E., & Colrain, I. M. (2004). A review of the evidence for P2 being an independent component process: Age, sleep and modality. Clinical Neurophysiology, 115(4), 732–744.
https://doi.org/10.1016/j.clinph.2003.11.021
Dimitrijevic, A., Lolli, B., Michalewski, H. J., Pratt, H., Zeng, F.-G., & Starr, A. (2009). Intensity changes in a continuous tone: auditory cortical potentials comparison with frequency changes.
Clinical Neurophysiology, 120(2), 374–383. https://doi.org/10.1016/j.clinph.2008.11.009 Evans, A. C., Collins, D. L., Mills, S. R., Brown, E. D., Kelly, R. L., & Peters, T. M. (1993). 3D
statistical neuroanatomical models from 305 MRI volumes. In Nuclear Science Symposium and Medical Imaging Conference, 1993., 1993 IEEE Conference Record. (Vol. 3, pp. 1813–1817).
(San Francisco, CA). https://doi.org/10.1109/NSSMIC.1993.373602
Hari, R., Kaila, K., Katila, T., Tuomisto, T., & Varpula, T. (1982). Interstimulus interval dependence of the auditory vertex response and its magnetic counterpart: Implications for their neural generation. Electroencephalography and Clinical Neurophysiology, 54(5), 561–569.
https://doi.org/10.1016/0013-4694(82)90041-4
Harris, K. C., Mills, J. H., & Dubno, J. R. (2007). Electrophysiologic correlates of intensity discrimination in cortical evoked potentials of younger and older adults. Hearing Research, 228(1–2), 58–68. https://doi.org/10.1016/j.heares.2007.01.021
Harris, K. C., Mills, J. H., He, N.-J., & Dubno, J. R. (2008). Age-related differences in sensitivity to small changes in frequency assessed with cortical evoked potentials. Hearing Research, 243(1–
2), 47–56. https://doi.org/10.1016/j.heares.2008.05.005
Hautus, M. J. (1995). Corrections for extreme proportions and their biasing effects on estimated values ofd′. Behavior Research Methods, Instruments, & Computers, 27(1), 46–51.
https://doi.org/10.3758/BF03203619
Herrmann, B., Schlichting, N., & Obleser, J. (2014). Dynamic Range Adaptation to Spectral Stimulus Statistics in Human Auditory Cortex. The Journal of Neuroscience, 34(1), 327–331.
https://doi.org/10.1523/JNEUROSCI.3974-13.2014
Hillyard, S. A., Hink, R. F., Schwent, V. L., & Picton, T. W. (1973). Electrical signs of selective attention in the human brain. Science, 182(4108), 177–180.
https://doi.org/10.1126/science.182.4108.177
Hyde, M. (1997). The N1 response and its applications. Audiology & Neuro-Otology, 2(5), 281–307.
https://doi.org/10.1159/000259253
Jones, S. J., & Perez, N. (2001). The auditory “C-process”: Analyzing the spectral envelope of complex sounds. Clinical Neurophysiology, 112(6), 965–975. https://doi.org/10.1016/S1388- 2457(01)00515-6
Jones, S. J., & Perez, N. (2002). The auditory C-process of spectral profile analysis. Clinical Neurophysiology, 113(10), 1558–1565. https://doi.org/10.1016/S1388-2457(02)00219-5
Kiesel, A., Miller, J., Jolicoeur, P., & Brisson, B. (2008). Measurement of ERP latency differences: A comparison of single-participant and jackknife-based scoring methods. Psychophysiology, 45(2), 250–274. https://doi.org/10.1111/j.1469-8986.2007.00618.x
Kohn, M., Lifshitz, K., & Litchfield, D. (1978). Averaged evoked potentials and frequency modulation. Electroencephalography and Clinical Neurophysiology, 45(2), 236–243.
https://doi.org/10.1016/0013-4694(78)90007-X
Kohn, M., Lifshitz, K., & Litchfield, D. (1980). Average evoked potentials and amplitude modulation.
Electroencephalography and Clinical Neurophysiology, 50(1–2), 134–140.
https://doi.org/10.1016/0013-4694(80)90330-2
Lanting, C. P., Briley, P. M., Sumner, C. J., & Krumbholz, K. (2013). Mechanisms of adaptation in human auditory cortex. Journal of Neurophysiology, 110(4), 973–983.
https://doi.org/10.1152/jn.00547.2012
Lu, T., Liang, L., & Wang, X. (2001). Neural representations of temporally asymmetric stimuli in the auditory cortex of awake primates. Journal of Neurophysiology, 85(6), 2364–2380.
https://doi.org/10.1152/jn.2001.85.6.2364
Macmillan, N. A., & Creelman, C. D. (2005). Detection Theory: A User’s Guide. Lawrence Erlbaum Associates.
Maiste, A., & Picton, T. (1989). Human auditory evoked potentials to frequency-modulated tones. Ear and Hearing, 10(3), 153–160. https://doi.org/10.1097/00003446-198906000-00003
Martin, B. A., Tremblay, K. L., & Korczak, P. (2008). Speech evoked potentials: from the laboratory to the clinic. Ear and Hearing, 29(3), 285–313. https://doi.org/10.1097/AUD.0b013e3181662c0e May, P. J. C., & Tiitinen, H. (2010). Mismatch negativity (MMN), the deviance-elicited auditory
deflection, explained. Psychophysiology, 47(1), 66–122. https://doi.org/10.1111/j.1469- 8986.2009.00856.x
May, P., Tiitinen, H., Ilmoniemi, R. J., Nyman, G., Taylor, J. G., & Näätänen, R. (1999). Frequency change detection in human auditory cortex. Journal of Computational Neuroscience, 6(2), 99–
120. https://doi.org/10.1023/A:1008896417606
Meyer, M., Baumann, S., & Jancke, L. (2006). Electrical brain imaging reveals spatio-temporal dynamics of timbre perception in humans. NeuroImage, 32(4), 1510–1523.
https://doi.org/10.1016/j.neuroimage.2006.04.193
Moore, B. C. J. (2003). An introduction to the psychology of hearing (5th ed.). San Diego: Academic Press.
Näätänen, R, Gaillard, A. W., & Mäntysalo, S. (1978). Early selective-attention effect on evoked potential reinterpreted. Acta Psychologica, 42(4), 313–329. https://doi.org/10.1016/0301- 0511(79)90053-X
Näätänen, R., & Picton, T. (1987). The N1 wave of the human electric and magnetic response to sound: A review and an analysis of the component structure. Psychophysiology, 24(4), 375–425.
https://10.1111/j.1469-8986.1987.tb00311.x
Näätänen, R., Sams, M., Alho, K., Paavilainen, P., Reinikainen, K., & Sokolov, E. N. (1988).
Frequency and location specificity of the human vertex N1 wave. Electroencephalography and Clinical Neurophysiology, 69(6), 523–531. https://doi.org/10.1016/0013-4694(88)90164-2
Näätänen, R., & Winkler, I. (1999). The concept of auditory stimulus representation in cognitive neuroscience. Psychological Bulletin, 125(6), 826–859. https://doi.org/10.1037/0033- 2909.125.6.826
Näätänen, R., Astikainen, P., Ruusuvirta, T., & Huotilainen, M. (2010). Automatic auditory
intelligence: An expression of the sensory-cognitive core of cognitive processes. Brain Research Reviews, 64(1), 123–136. https://doi.org/10.1016/j.brainresrev.2010.03.001
Noda, K., Tonoike, M., Doi, K., Koizuka, I., Yoshida, H., Yamaguchi, M., … Kubo, T. (1999). A pitch glide activates an intermediate response between auditory N1 and mismatch negativity.
Neuroreport, 10(9), 1909–1912. https://doi.org/10.1097/00001756-199906230-00021 Nourski, K. V., & Brugge, J. F. (2011). Representation of temporal sound features in the human
auditory cortex. Reviews in the Neurosciences, 22(2), 187–203.
https://doi.org/10.1515/RNS.2011.016
Nuwer, M. R., Comi, G., Emerson, R., Fuglsang-Frederiksen, A., Guérit, J. M., Hinrichs, H., … Rappelsburger, P. (1998). IFCN standards for digital recording of clinical EEG. International Federation of Clinical Neurophysiology. Electroencephalography and Clinical Neurophysiology, 106(3), 259–261. https://doi.org/10.1016/S0013-4694(97)00106-5
Oostenveld, R., Fries, P., Maris, E., & Schoffelen, J.-M. (2010). FieldTrip: Open source software for advanced analysis of MEG, EEG, and invasive electrophysiological data. Computational Intelligence and Neuroscience, 2011, e156869. https://doi.org/10.1155/2011/156869 Pantev, C., Eulitz, C., Hampson, S., Ross, B., & Roberts, L. E. (1996). The auditory evoked “off”
response: Sources and comparison with the “on” and the “sustained” responses. Ear and Hearing, 17(3), 255–265. https://doi.org/10.1097/00003446-199606000-00008
Pfefferbaum, A., Ford, J. M., Weller, B. J., & Kopell, B. S. (1985). ERPs to response production and inhibition. Electroencephalography and Clinical Neurophysiology, 60(5), 423–434.
https://doi.org/10.1016/0013-4694(85)91017-X
Phillips, D. P., Hall, S. E., & Boehnke, S. E. (2002). Central auditory onset responses, and temporal asymmetries in auditory perception. Hearing Research, 167(1–2), 192–205.
https://doi.org/10.1016/S0378-5955(02)00393-3
Phillips, D. P., Mendelson, J. R., Cynader, M. S., & Douglas, R. M. (1985). Responses of single neurones in cat auditory cortex to time-varying stimuli: Frequency-modulated tones of narrow excursion. Experimental Brain Research, 58(3), 443–454. https://doi.org/10.1007/BF00235862 Picton, T. W., & Hillyard, S. A. (1974). Human auditory evoked potentials. II. Effects of attention.
Electroencephalography and Clinical Neurophysiology, 36(2), 191–199.
https://doi.org/10.1016/0013-4694(74)90156-4
Picton, T. W., Hillyard, S. A., Krausz, H. I., & Galambos, R. (1974). Human auditory evoked
potentials. I. Evaluation of components. Electroencephalography and Clinical Neurophysiology, 36(2), 179–190. https://doi.org/10.1016/0013-4694(74)90155-2
Picton, T. W., Woods, D. L., & Proulx, G. B. (1978a). Human auditory sustained potentials. I. The nature of the response. Electroencephalography and Clinical Neurophysiology, 45(2), 186–197.
https://doi.org/10.1016/0013-4694(78)90003-2
Picton, T. W., Woods, D. L., & Proulx, G. B. (1978b). Human auditory sustained potentials. II.
Stimulus relationships. Electroencephalography and Clinical Neurophysiology, 45(2), 198–210.
https://doi.org/10.1016/0013-4694(78)90004-4
Ross, B., & Tremblay, K. (2009). Stimulus experience modifies auditory neuromagnetic responses in young and older listeners. Hearing Research, 248(1–2), 48–59.
https://doi.org/10.1016/j.heares.2008.11.012
Ruhm, H. B. (1970). Rate of frequency change and the acoustically evoked response. The Journal of Auditory Research, 10, 29–34.
Ruhm, H. B. (1971). Directional sensitivity and laterality of electroencephalic responses evoked by acoustic sweep frequencies. Journal of Auditory Research, 11(1), 9–16.
Schlögl, A., Keinrath, C., Zimmermann, D., Scherer, R., Leeb, R., & Pfurtscheller, G. (2007). A fully automated correction method of EOG artifacts in EEG recordings. Clinical Neurophysiology, 118(1), 98–104. https://doi.org/10.1016/j.clinph.2006.09.003
Scholl, B., Gao, X., & Wehr, M. (2010). Nonoverlapping sets of synapses drive on responses and fff responses in auditory cortex. Neuron, 65(3), 412–421.
https://doi.org/10.1016/j.neuron.2010.01.020
Schwartze, M., Tavano, A., Schröger, E., & Kotz, S. A. (2012). Temporal aspects of prediction in audition: Cortical and subcortical neural mechanisms. International Journal of
Psychophysiology, 83(2), 200–207. https://doi.org/10.1016/j.ijpsycho.2011.11.003
Seither-Preisler, A., Krumbholz, K., Patterson, R., Seither, S., & Lütkenhöner, B. (2004). Interaction between the neuromagnetic responses to sound energy onset and pitch onset suggests common generators. The European Journal of Neuroscience, 19(11), 3073–3080.
https://doi.org/10.1111/j.0953-816X.2004.03423.x
Shahin, A. J., Roberts, L. E., Miller, L. M., McDonald, K. L., & Alain, C. (2007). Sensitivity of EEG and MEG to the N1 and P2 auditory evoked responses modulated by spectral complexity of sounds. Brain Topography, 20(2), 55–61. https://doi.org/10.1007/s10548-007-0031-4
Shahin, A., Roberts, L. E., Pantev, C., Trainor, L. J., & Ross, B. (2005). Modulation of P2 auditory- evoked responses by the spectral complexity of musical sounds. Neuroreport, 16(16), 1781–
1785. https://doi.org/10.1097/01.wnr.0000185017.29316.63
Ulrich, R., & Miller, J. (2001). Using the jackknife-based scoring method for measuring LRP onset effects in factorial designs. Psychophysiology, 38(5), 816–827. https://doi.org/10.1111/1469- 8986.3850816
Vaughan, H. G., & Ritter, W. (1970). The sources of auditory evoked responses recorded from the human scalp. Electroencephalography and Clinical Neurophysiology, 28(4), 360–367.
https://doi.org/10.1016/0013-4694(70)90228-2
Viswanathan, D., & Jansen, B. H. (2010). The effect of stimulus expectancy on dishabituation of auditory evoked potentials. International Journal of Psychophysiology, 78(3), 251–256.
https://doi.org/10.1016/j.ijpsycho.2010.08.006
Weise, A., Schröger, E., Fehér, B., Folyi, T., & Horváth, J. (2012). Auditory event-related potentials reflect dedicated change detection activity for higher-order acoustic transitions. Biological Psychology, 91(1), 142–149. https://doi.org/10.1016/j.biopsycho.2012.06.001
Whitfield, I. C., & Evans, E. F. (1965). Responses of auditory cortical neurons to stimuli of changing frequency. Journal of Neurophysiology, 28, 655–672. https://doi.org/10.1152/jn.1965.28.4.655
Winkler, I., Denham, S. L., & Nelken, I. (2009). Modeling the auditory scene: Predictive regularity representations and perceptual objects. Trends in Cognitive Sciences, 13(12), 532–540.
https://doi.org/10.1016/j.tics.2009.09.003
Worsley, K. J., Marrett, S., Neelin, P., & Evans, A. C. (1996). Searching scale space for activation in PET images. Human Brain Mapping, 4(1), 74–90. https://doi.org/10.1002/(SICI)1097-
0193(1996)4:1<74::AID-HBM5>3.0.CO;2-M
Yingling, C. D., & Nethercut, G. E. (1983). Evoked responses to frequency shifted tones: Tonotopic and contextual determinants. The International Journal of Neuroscience, 22(1–2), 107–118.
https://doi.org/10.3109/00207459308987389
Author Note
This research was supported by the Hungarian Scientific Research Fund (OTKA 104635).
The authors have no potential conflicts of interest (financial or otherwise) regarding the reported work. The authors thank an anonymous reviewer for pointing our attention to an alternative account (neural adaptation) that may account for the current pattern of results.
Address correspondence to: Annekathrin Weise, Paris-Lodron Universität Salzburg, Division of Physiological Psychology, Hellbrunnerstraße 34, 5020 Salzburg, Austria, e-mail:
annekathrin.weise@sbg.ac.at.
Tables
Table 1: Hit- and false alarm rate, d' sensitivity values, RT and RT dispersion obtained in the go/no- go task for tones with transition as a function of transition type and the rate of pitch change
Transition type
Rate in ST/s
Hits in % (SD)
False alarms in % (SD)
dꞌ values (SD) RTs in ms (SD)
Dispersion of RTs in ms (SD) g-to-c 10 98.29 (1.61) 6.67 (3.97) 3.81 (.65) 313 (22) 78 (23)
40 99.04 (.98) 3.32 (1.63) 4.39 (.49) 278 (18) 62 (16) c-to-g 10 99.29 (.75) .50 (.26) 5.20 (.39) 258 (23) 54 (18) 40 99.54 (.39) .33 (.19) 5.43 (.31) 236 (25) 55 (17)
Standard deviations (SD) are given in parentheses.
Note that data of 12 participants entered the analysis for hits, false alarms and d values, while for the different RT measures data of all 13 participants were used (see methods section for details).
Table 2: Group-mean N1 amplitudes and their normalized values measured in the mastoid and Fz signal in the given time window elicited by g-to-c and c-to-g transitions as a function of rate of pitch change
Mastoids Fz
Sound type
Rate (ST/s)
Window1 (ms)
N1 amplitude2 in V (SD)
Normalized N1 amplitude
Window1 (ms)
N1 amplitude2 in V (SD)
Normalized N1 amplitude g-to-c 10 118 - 148 .29 (1.08) .12 (.73) 145 - 175 -.66 (1.71) .26 (.74)
40 118 - 148 1.44 (1.25) 1 (.88) 145 - 175 -2.31 (1.79) 1 (.78)
c-to-g 10 110 - 140 2.37 (1.10) 1 (.46) 137 - 167 -4.89 (2.63) .92 (.50)
40 92 - 122 2.37 (1.28) 1 (.54) 118 - 148 -5.28 (2.09) 1 (.40)
1The window in which mean amplitudes were measured are related to the onset of the transition.
2N1 amplitudes were measured in the transient-minus-no transient difference wave.
SD - standard deviation, ST - semitones.
Table 3: N1 peak latencies measured in the specified time windows to c-to-g transitions as a function of rate of pitch change and electrode position (mastoids, Fz)
Mastoids Fz
Sound type
Rate (ST/s)
Analysis window
N1 latency (SD) in ms
Analysis window
N1 latency (SD) in ms
c-to-g 10 70 - 170 126 (1) 110 – 210 164 (5)
40 60 - 160 112 (2) 90 - 190 142 (2)
Peak latencies are presented relative to transition onset.
ST semitones, SD standard deviation
Table 4: Location of maximal N1 source activation for the g-to-c and c-to-g transitions as a function of rate of pitch change (10, 40 ST/s) including the corresponding contrast (10 vs. 40 ST/s)
g-to-c c-to-g
Rate (ST/s)
Area Hemis- phere
Talairach coordinates
Hemis- phere
Talairach coordinates
10 STG left X = -57, Y = -41, Z = -12 right X = 57, Y = -11, Z = -2 40 STG left X = -57, Y = -19, Z = 4 left X = -57, Y = -27, Z = 12 10 vs. 40 STG left X = -57, Y = -19, Z = 4 right X = 57, Y = -32, Z = 12 STG Superior temporal gyrus
Figure Captions
Figure 1: Schematic illustration of go and no-go stimulus pairs presented in the four conditions of the experiment (in each row). In go trials (left) tones featuring a transition were presented, which consisted of a constant frequency- and a frequency glide segment. The duration of the first segment was 900 ms, that of the second 400 ms. Transition type was either g-to-c (top, left) or c-to-g (bottom, left). No-go trials (right) featured tones without a transition (glide or constant). The rate of pitch change within a glide segment was either 10 ST/s (red) or 40 ST/s (blue). The base-frequency of the constant segment was the same for all tones. Go and no-go trials were presented randomly with 50%- 50% probabilities in each condition.
Figure 2: Tukey box plots for individual d' sensitivity values (left), RT (middle) and RT dispersion (right) for tones with transition as a function of transition type and the rate of pitch change (cf. Table 1). On each box, the horizontal red line indicates the median, and the bottom and top edges of the blue box indicate the 25th and 75th percentiles, respectively. Whiskers (black solid line) cover data points within 1.5 times of the inter-quartile range above or below the quartiles. Data points not covered by the whiskers are marked by red circles.
Figure 3: Group-average ERP waveforms measured at Fz and the average of left and right mastoid (M) signal, elicited by the different types of tones, arranged in rows according to the type of transition and rate of pitch change. The tone-related waveforms shown in the left column and the transition- related waveforms in the middle columns result from different ERP processing settings. For the tone- related waveforms (left column), tone-onset (0 ms) is at the crossing of the axes; for the transition- related waveforms (middle column), the crossing of the axes (0 ms) indicates the onset of the transition. The 100-ms baseline interval is either before tone onset (left column) or before the transition (middle column). Within each graph three ERPs are shown: Red: tone with transition, blue:
tone without transition, black: the corresponding difference wave. The temporal structure of the tone- segments is represented by gray bars above the time scale at the bottom of the figure. Arrows indicate the transition-related N1 waveforms. Right: Topographical distribution of the corresponding group- averaged transition-related N1 waveforms. Windows were chosen in which N1 mean amplitudes were measured at the mastoids (see Table 2).
Figure 4: Tukey box plots for the group-mean N1 latencies (top) and the normalized N1 amplitudes (bottom) measured in the mastoid (left) and Fz (right) signal (cf. Table 2 and 3). On each box, the horizontal red line indicates the median, and the bottom and top edges of the blue box indicate the 25th and 75th percentiles, respectively. Whiskers (black solid line) cover data points within 1.5 times of the inter-quartile range above or below the quartiles. Data points not covered by the whiskers are marked by red circles.