Int. J. Production Economics 243 (2022) 108316
Available online 30 September 2021
0925-5273/© 2021 The Authors. Published by Elsevier B.V. This is an open access article under the CC BY-NC-ND license
(http://creativecommons.org/licenses/by-nc-nd/4.0/).
Firm competitiveness: A general model and a manufacturing application
Attila Chik ´ an
*, Erzs ´ ebet Czak o, Bence Kiss-Dobronyi, D ´ ´ avid Losonci
Institute of Business Economics, Competitiveness Research Centre, Corvinus University of Budapest, H-1093, Budapest, Hungary
A R T I C L E I N F O Keywords:
Firm competitiveness RBV Production Capabilities
A B S T R A C T
Competitiveness of firms is studied mostly from a strategic management perspective. It is only rarely a subject of analysis from the viewpoint of operations. In this paper, we aim to connect these two approaches using the resource-based view of the firm, popularly called RBV theories.
First, we provide a comprehensive definition of firm competitiveness and propose a conceptual index (Firm Competitiveness Index or FCI) to measure it, based on the theory of dynamic capabilities.
Further, we demonstrate the use of the FCI concept, with an application to the Hungarian manufacturing sector, utilizing survey responses from a sample of 113 firms collected as part of an ongoing research project focusing on competitiveness of the Hungarian industry. We employ exploratory- and confirmatory factor analysis to construct a context-specific FCI indicator on this sample.
Finally, we explore the relationship between the constructed FCI, and thus a concept of competitiveness, and capabilities of the production area. Hierarchical regression analysis is employed to investigate this relationship.
We posit this as a means to empirically test the perceived contribution of functional areas to the overall firm-level competitiveness.
We find a positive impact of the dynamic production capabilities on the firm’s perceived competitiveness but find no significant relationship between ordinary production capabilities and firm-level competitiveness.
1. Introduction
The concept of firm-level competitiveness is widely used in the field of strategic management, but it is rarely connected to the analysis of the effectiveness of functional operations. This paper aims to bridge some of this gap. It provides a concept for measuring perceived firm-level competitiveness and establishes this as a tool for measuring the contri- bution of functional operations to the overall competitiveness and suc- cess of the firm.
This article is comprised of two distinct parts. The first part (Section 2 and 3) lays down the conceptual foundations, while the second part (Section 4) contains an empirical analysis based on the introduced ideas and concepts. Section 2 provides a comprehensive definition of firm- level competitiveness and introduces a concept to measure it, then fo- cuses on the relationship between the resulting competitiveness indi- cator, the Firm Competitiveness Index (FCI) and capabilities in the functional area of production.
The theoretical foundation underlying our work is twofold. The Resource Based View (RBV) emphasizes the crucial role of resources,
while strategic management literature highlights their dual utilization, separating ordinary (OC) and dynamic capabilities (DC). These can be linked directly to March’s concepts of exploitation and exploration of resources (March 1991). The concept of firm-level competitiveness and its measurement builds on these ideas and Chikan’s (2006 and 2008) works.
In Section 3, we shift towards the functional areas that comprises firm operations. Following Sprafke et al. (2012) work, we assume that firm-level capabilities have their roots in individual and organizational capabilities. Focusing on production capabilities (i.e. capabilities at the level of the functional area of production) we investigate the relation- ship between these capabilities and overall firm-level competitiveness as captured by the FCI. We theorize that production capabilities can contribute to firm-level competitiveness, i.e. a higher level of production capabilities should lead to a higher level of competitiveness.
These theoretical considerations drive our empirical analysis (Sec- tion 4), which uses survey data from a research conducted by the Competitiveness Research Centre of Corvinus University of Budapest.
We utilise response data of 113 manufacturing firms. The empirical
* Corresponding author.
E-mail addresses: chikan@uni-corvinus.hu (A. Chikan), ´ erzsebet.czako@uni-corvinus.hu (E. Czak´o), kiss-dobronyi.bence@stud.uni-corvinus.hu (B. Kiss- Dobronyi), david.losonci@uni-corvinus.hu (D. Losonci).
Contents lists available at ScienceDirect
International Journal of Production Economics
journal homepage: www.elsevier.com/locate/ijpe
https://doi.org/10.1016/j.ijpe.2021.108316
Received 13 June 2020; Received in revised form 19 August 2021; Accepted 24 September 2021
International Journal of Production Economics 243 (2022) 108316
2 analysis follows a two-part structure. First, using the FCI measurement concept, we construct a context-specific competitiveness index for the firms in the sample. We use exploratory factor analysis and confirmatory factor analysis to explore key items and test the validity of the construct underlying the index. Second, after obtaining FCI scores for the indi- vidual observations, we use the setup and questions about the percep- tion of production capabilities to test our hypotheses about the relationships between firm-level competitiveness and production capabilities.
The paper proceeds as follows: the first overall part starts with an overview of the literature on firm competitiveness, highlighting the role of OC and DC and leading to our own definition of firm competitiveness.
This part is followed by a conceptual discussion of the FCI and its formulation, and factor analysis calculations to establish a context- specific FCI index for Hungarian manufacturing firms. In the second part we focus on the relationship between firm-level competitiveness and production capabilities. Results from hierarchical regression be- tween the constructed FCI and production capabilities are presented and discussed. Finally, our conclusion summarizes both the theoretical and the empirical contributions of our research and touches upon potential future directions.
2. Theoretical background of firm competitiveness 2.1. Firm competitiveness – general considerations
The concept of competitiveness is closely tied to Michael Porter’s seminal work (Porter, 1990), and it is considered as a multi-tier and multifaceted idea (S¨olvell, 2015; Bhawsar – Chattopadhyay, 2015;
Chik´an et al., 2018). Porter (1990) presents the outcomes of a national level competitiveness inquiry on outstanding performance of firms and their industries in different countries. His diamond framework demon- strates explanatory factors, which enable firms to compete successfully in their international industries. S¨olvell (2015) provides an analysis of academic contributions and the subsequent and related research out- comes of Porter (1990). S¨olvell (2015) highlights that in this approach a firm is understood as a holistic unit with its own competitive strategy, where the internal factors of firms were not investigated. Those factors were developed and discussed in Porter’s earlier works (Porter, 1980, 1985). He discussed and suggested research on the interrelatedness of national, regional and firm levels of competitiveness in the global context (Snowdon and Stonehouse, 2006).
Firm level competitiveness was a synonym of business performance in strategic management (Guerras-Martin et al., 2014) when the role and impact of functional strategies (like production and operations man- agement areas) were investigated (Avella et al., 2001 and Demeter, 2003). A definition and a model for firm competitiveness (FC) and its relationship with national competitiveness were developed by Chik´an (2008). Its definition is taken as a starting point for investigating firm competitiveness in several studies (Kinra-Antai, 2010; Cetindamar, 2013; Bhawsar – Chattopadhyay, 2015; Delbari, 2015; Bayon – Aguilear, 2020). The commonality of these competitiveness papers is that the RBV of the firm (Wernerfelt, 1984; Barney 1991; Teece at al, 1997) is taken as a basis for surveys of firm level investigations focusing on the chief ex- ecutive officer (CEO) or top-level decisions. The use of RBV of the firm has become advocated also in operations management studies (Hitt et al., 2016, 80, and Chapal et al., 2020, 5).
According to Chikan (2008), firm competitiveness (FC) is a ´ construct, where the unit of analysis is the firm, which is embedded into its macro-level contexts, and investigated by economics, business and management studies. This interconnectedness was elaborated in our adopted definition: “firm competitiveness is a capability of a firm to sus- tainably fulfil its dual purpose: meeting customer demand at profit. This capability is realized through offering on the market goods and services which customers value higher than those offered by competitors. Achieving competitiveness requires the firm’s continuing adaptation to changing social
and economic norms and conditions.” (Chik´an 2008, 24–25).
Cerrato and Deppreu (2011) focus on firm-level competitiveness in international contexts and distinguish firm specific (FSA) and country specific advantages (CSA) as it is adopted by Rugman and Verbeke (2001) in the field of international business. Building on that and adopting further elements of Cerrato and Deppreu (2011), we suggest (Table 1) that FC can be described by characterizing drivers and out- comes which in our concept are influenced by enablers. These are the three building blocks of FC.
Enablers can be matched with macro-level factors that are results of the macro-environment. As a construct, these are called Country Specific Advantage (CSA). The diamond framework (Porter, 1990) and competitiveness rankings (IMD 2019; WEF 2019) are publications related to this concept. In our paper enablers are not handled explicitly, they are considered as components of Resources (see Fig. 1), as we focus on firms’ internal factors of competitiveness.
Drivers are composed by those resources and their corresponding ca- pabilities, i.e. use (exploitation), upgrade and renew (exploration) that are available for meeting the purpose of the firm (March 1991). Their construct is the Firm Specific Advantage (FSA). The concepts, methods, and studies on drivers come from the fields of business and management studies, and in particular Theories of the Firm and Strategic Management.
Outcomes of FC are the result of operation of the firm (like revenue, market share), that are also assessed and validated by its key external stakeholders (like customers, owners). Functional management (e.g.
finance, marketing, production and operations management) studies contribute to the relevant literature by investigating the creation of those outcomes.
2.2. Firm-level competitiveness – drivers and capabilities
For the analysis of FC, the RBV of the firm is selected. The RBV is a concept of the firm, which is based on the Penrosian-firm concept after its description and discussion by Penrose (1959). The Penrosian-firm as an idea enriched the RBV theories of strategic management and their investigations. (Wernerfelt, 1984; Teece et al., 1997; Pitelis, 2009).
There are several RBV theories, and most of them emanated from the field of strategic management (Teece et al., 1997; Barney, 2001b). Their common understanding is that firm resources underpin sustainable competitive advantage (SCA). Barney (1991) depicts the basic building blocks of RBV theories, gives a classification of resources (physical, human, organizational), and claims that VRIN (valuable, rare, inimi- table, non-substitutable) resources will lead to SCA which is a key issue in RBV theories. Kraaijenbrink et al. (2010) discussed research evidence and outcomes of probing and verifying Barney’s (1991) RBV theory and its main critiques after twenty years of its publication. They concluded that RBV is a suitable theory for explaining SCA.
Barney (1991) argues that environmental models of CA (like competitive forces approach of Porter 1980 and 1981) clarify the impact of a firm’s environment on performance. The RBV of CA links the firm’s internal characteristics and performance. CA is comparable to the notion of success of firms in its most general meaning (Barney, 2001a), which is also conceptualized as rent by economists (Teece et al., 1997).
Teece et al. (1997) formulate a framework for dynamic capabilities, and by that they discuss it as a model of strategy. Barney’s (1991) environmental models belong to strategizing paradigm here, where SCA can be achieved through the exploitation of market power. The econo- mizing paradigm of strategy includes the resource-based perspectives (Penrose, 1959) and the dynamic capabilities (DC) perspectives. DC is defined “as the firm’s ability to integrate, build, and reconfigure internal and external competences to address rapidly changing environments.
Dynamic capabilities thus reflect an organization’s ability to achieve new and innovative forms of competitive advantage given path de- pendencies and market positions.” (Teece et al., 1997, 516). Dynamic capabilities theory was elaborated in subsequent papers of Teece (2007, A. Chik´an et al.
International Journal of Production Economics 243 (2022) 108316
3 2014, 2016).
There are several competing approaches and theories on FC drivers;
in this paper, the dynamic capabilities framework was chosen. It de- lineates the constructs of Ordinary Capabilities (OC) that “are needed to meet current objectives” and require “efficiency-oriented management”, and Dynamic Capabilities (DC), which “involve higher-level activities that can enable an enterprise to upgrade its ordinary capabilities” (Teece, 2016).
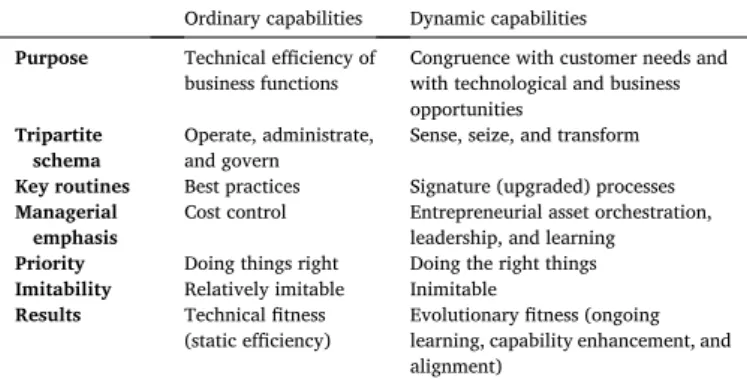
Table 2 compares them in further detail.
Since our firm-level competitiveness approach covers both drivers and outcomes, a joint conceptualization is needed. We argue that ordi- nary capabilities result in outcomes which together can be called operationality, and dynamic capabilities’ which result in outcomes that is to be called adaptivity.
Both are internal components of firm operations. They are composed of the combination of functional indicators (like those of marketing, production, R&D, etc.) that are integrated into operationality and
adaptivity and can be measured in the following ways:
• Operationality measures are composed of the widely used in- dicators of production and operations management activities, like cost, quality, reliability, flexibility and services. It corresponds to technical fitness (Teece, 2016)
• Adaptivity relates to managing changes; besides the market re- lations, human- and organizational adaptivity have been considered, which correspond to evolutionary fitness (Teece, 2016)
2.3. Firm competitiveness index
From the theoretical concept of firm-level competitiveness defined in Chik´an (2006, 2008), a Firm Competitiveness Index (FCI) was delin- eated building on RBV theories to provide a framework for assessing and measuring firm-level competitiveness and its key components. FCI en- tails both market and financial competitive advantage (CA), which en- sues from both the technical and evolutionary fitness of the firm.
Operationality is about technical fitness, and this is underpinned by ordinary capabilities (OC), and adaptability is about evolutionary fitness, and this is underpinned by dynamic capabilities (DC). OC is using resources to do things right, in order to exploit them. DC is using resources to do the right things, for exploring opportunities (March 1991;
Teece, 2007). Resources are under administrative coordination and authoritative communication by management, and competitive advan- tage entails their adequate usage partly for OC and partly for DC.
Fig. 1 presents the structure graphically. We posit that we can esti- mate the level of competitiveness of a firm in any given moment by combining measures of its capabilities and its market performance. It is evident that in real life there are time lags and cross effects among the factors. In our perception, however, when using survey data, we create a snapshot of the characteristics of the company (at the moment the sur- vey is conducted), and we can consider the resulting data as Table 1
Building blocks of competitiveness.
Building
blocks Assessment and measure
of competitiveness Constructs Academic background* Literature*
Enablers Diamond framework;
Competitiveness rankings;
CSA – competitiveness
country specific advantage Economics, Clusters,
International Business
Porter (1990), WEF (2019), Kinra – Antai (2010), Li-Hua (2007), Aiginger – Vogel (2015)
Drivers Resources, Capabilities FSA – competitiveness firm
specific advantage Strategic management (SM),
Theories of the firm, RBV Porter (1980, 1985), Barney (1991, 2001b), Teece et al. (1997), Teece (2007, 2016), Ambastha – Moyama (2004), Mesquita et al.
(2007), Amoaka-Gyampa – Acquaah (2008), Ang et al. (2015) Outcomes Revenue,
Market share, Profit, Renewal, CSR recognition
Performance measure: key
performance indicators Financial management, Marketing management, Production management**
Ghalayini et al. (1997)
Avella et al. (2001), Demeter (2003), Maniak (NA), Vilanova et al.
(2009), Lalinsky (2013), Vlachvei et al. (2016), Notes: * indicative. ** Production and operations management are referred as synonyms at the current conceptual level, either as “Production” or “OM”.
Fig. 1. Components and logic of FC.
Table 2
Main differences between ordinary and dynamic capabilities.
Ordinary capabilities Dynamic capabilities Purpose Technical efficiency of
business functions Congruence with customer needs and with technological and business opportunities
Tripartite
schema Operate, administrate,
and govern Sense, seize, and transform Key routines Best practices Signature (upgraded) processes Managerial
emphasis Cost control Entrepreneurial asset orchestration, leadership, and learning Priority Doing things right Doing the right things Imitability Relatively imitable Inimitable Results Technical fitness
(static efficiency) Evolutionary fitness (ongoing learning, capability enhancement, and alignment)
Source: Teece (2016).
A. Chik´an et al.
International Journal of Production Economics 243 (2022) 108316
4 characterizing the company in that observed moment.
Our firm competitiveness definition implies that beyond the OC and DC, which are internal to the firm, we also need to consider to what extent the firm is able to fulfil its general role in society: to meet customer demand at a profit. The degree of this shows the level of acceptance of the firm’s efforts by the external environment - more specifically by the two main groups of stakeholders: shareholders (interested in profits) and customers (interested in demand satisfaction).
Practically, it means that the firm competitiveness index (FCI) is conceptually the combination of operationality and adaptivity validated by the market.
The principle of dual value creation, i.e. that by definition firms have to create value both for the customers and the owners in the very same processes, leads us to the idea of external factors influencing competi- tiveness. These external factors express themselves as the market’s response, as it can be derived from Porter’s diamond framework (Porter 1990), and value chain (Porter 1985) concept. We measure customer value creation with a market share of the firm and value creation for owners with profitability. They together represent the market success or validation of the outcomes of internal activities and signal the value appropriation by the company. This concept is supported by CA litera- ture, where market performance is used as a multiplier (Edeling - Himme 2018; Ma, 2000; Barney 2001b).
A detailed conceptualization and analysis of the FCI concept (based on a survey of 217 firms, using the 2004 Hungarian competitiveness survey) can be found in Chik´an (2006). The paper proposed the following conceptual relationship between the mentioned components:
FCI= (OP+AD) ×MP (1)
where.
FCI Firm Competitiveness Index.
OP Operationality (measuring the outcome of ordinary capabilities).
AD Adaptivity (measuring the outcome of dynamic capabilities).
MP Market Performance.
This setup suggests that the addition of scores of operationality (OP) and adaptivity (AD) is to be multiplied by market performance (MP) to arrive to a composite score of competitiveness. We follow this logic in our current analysis.
3. The contribution of the production area to firm competitiveness
The FCI concept means that we can understand firm-level competi- tiveness as a joint construct stemming from perceived capabilities and market performance. But as we intend to bridge firm-level competi- tiveness with functional operations (such as the production area) we need to establish an understanding of how functional operations can contribute to overall competitiveness.
Our problem statement follows Sprafke et al. (2012) reasoning. We assume that firm-level capabilities have their micro-foundations in in- dividual and organisational capabilities (drivers). We theorize that measuring ordinary and dynamic capabilities at the level of the func- tional unit of the firm and analysing their relationship with firm-level competitiveness can provide insights into how functional units can contribute to firm competitiveness (outcomes). In more general terms, companies compete at both capability and product market outcomes (Pisano, 2017). Their competition with their capabilities is poorly observable externally, as they are related to internal factors (e.g., operational processes, organization, or technology) and measured by key performance indicators. The competition with product market out- comes are more observable, and usually operationalized by business performance measures.
In order to demonstrate the application of the FCI concept developed in Section 2, we have chosen to examine the effect of efficiency of the operations on firm performance measured by the FCI. We specify our
analysis to manufacturing firms in order to avoid the need of explaining sectoral differences which is unnecessary for introducing the core mes- sage of the paper.
3.1. Drivers in operations
Both conceptualizing and measuring capabilities follow a resource and routine-based approach and apply the March (1991) “exploitation and exploration” distinction of capabilities, and it has been advocated by several authors in OM.
Swink and Hegarty (1998) delineates “steady-state” and “growth”
manufacturing capabilities. “Steady-state” manufacturing capabilities represent ordinary capabilities. With these capabilities a firm shares information (acuity), directs processes (control) and ensures flexible adaptation (agility and responsiveness). It means that even “steady-- state” manufacturing could support adaptation to changing context, especially in different dimensions of flexibility. “Growth”
manufacturing capabilities can be understood as dynamic capabilities.
These are about developing new products and processes, and they also include incremental improvements of manufacturing performance by using existing resources. A somewhat different distinction is developed by Peng et al. (2008). They highlight incremental “improvement” and
“innovation” operational capabilities. In this classification the ordinary-like “improvement” capabilities are oriented to incremental improvement efforts (quality, lean) and the dynamic-like “innovation” capabilities are about new processes, products, and technologies. Both Swink and Hegarty (1998) and Peng et al. (2008) suggest common points. Both categorizations highlight that even ordinary capabilities ensure some kind of (continuous) improvement or (flexible) adjustment.
They pinpoint that ongoing improvement and hence, learning is a must for operations. More importantly, they offer a common framework for operational capabilities, as they are organized around processes, tech- nologies, and products.
The majority of works in strategic management literature either adopt Teece’s guidance about the tripartite scheme (Yeow et al., 2018) or develop their own similar schemes (see Eisenhardt and Martin (2000); Danneels (2011); Lin et al. (2016)). As strategic management literature aims to understand issues at both firm and functional levels, it has developed its own sets of functional capabilities. Danneels (2016) highlights that technology (manufacturing or operational) and market- ing capabilities are overrepresented in research. He, similarly to McKelvie and Davidson (2009), links operational capabilities to tech- nology, product (service) and technological expertise.
We can conclude that OM and strategic management approaches agree on several core operational capabilities (e.g. processes, technol- ogies). However, they contrast in how they evaluate product market related capabilities. Strategic management authors mostly link them to innovation capabilities and OM papers emphasize learning through improvement.
3.2. Outcomes in operations
Assessment of the overall performance of the manufacturing firm requires to cover several measures, which may be grouped into bundles of outcomes. The proposed framework of firm competitiveness defines three such bundles.
First, as DCs serve as theoretical foundation, we include competitive advantage. Next to financial measures (Pisano, 2017) market share, sales growth and measures of return (e.g. ROS, ROI) are widely used to operationalize market related competitive advantage. (Demeter, 2003;
Lii and Kuo, 2016; Ilmudeen et al., 2020) (see Table 3).
Second, we consider operationality as technical fitness of the production/operations area. Traditional categorization of operations objectives usually includes cost, quality, flexibility, dependability, and speed (see Slack and Brandon-Jones, 2019). The majority of these measures have a long history in operations as highlighted by Ferdows A. Chik´an et al.
InternationalJournalofProductionEconomics243(2022)108316
5
Table 3
Bundles of competitiveness outcomes in OM papers.
Bundle of
indicators Literature Capabilities in OM Competitiveness in OM Operations capabilities in DCs
Author(s) proposed
elements of FCI Peng et al.
(2008)
Swink and Hegarty (1998)
Ghalayini et al.
(1997)
Avella et al.
(2001)
Deme-ter
(2003) Amoako-Gyampah and Acquaah (2008) Yang
et al.
(2010)
Lii and Kuo (2016)
Chahal et al.
(2020)
Ilmudeen et al.
(2020)
McKelvie and Davidsson (2009)
Danneels (2016)
Main objective Type of paper survey conceptual
paper case study survey survey survey survey survey literature
review survey panel
survey panel
survey Region (no. of
companies) global
(189)* – US (1) Spain
(1104) global
(703)** Ghana (122) China
and Taiwan (107)***
Taiwan
(480) – China
(254) Sweden
(108) US (108)
Competitive
advantage Market
performance (a) Market share X X X X
(b) Return on
sales X X X X
Operationality - Operations measures
Cost/Price (c) Cost-
effectiveness X X X X X X X X
(d) Competitive
prices X X X X X X X
Quality (e) Product/
service quality X X X X X X X X X
(f) Quality of manufacturing activity
X X X X
(g) Quality of
materials X X X X
Time (h) Delivery
time/service time
X X X X X X X X X
(i) Delivery/
service accuracy X X X X X X X
Flexibility (j) Flexible responding to consumer demand
X X X X X X
(k) Flexibility of the production system
X X X X X
(l) Flexibility of the logistics system
X X
Servicing (m) Product/
service assortment
X X X X X
(n) Quality of production/
customer service
X X X
(o) Distribution
channels X
(p) Ethical
behaviour X
Market
relations X X
(continued on next page)
A. Chik´an et al.
InternationalJournalofProductionEconomics243(2022)108316
6
Table 3 (continued) Bundle of
indicators Literature Capabilities in OM Competitiveness in OM Operations capabilities in DCs
Author(s) proposed
elements of FCI Peng et al.
(2008)
Swink and Hegarty (1998)
Ghalayini et al.
(1997)
Avella et al.
(2001)
Deme-ter
(2003) Amoako-Gyampah and Acquaah (2008) Yang
et al.
(2010)
Lii and Kuo (2016)
Chahal et al.
(2020)
Ilmudeen et al.
(2020)
McKelvie and Davidsson (2009)
Danneels (2016)
Main objective Type of paper survey conceptual
paper case study survey survey survey survey survey literature
review survey panel
survey panel
survey Region (no. of
companies) global
(189)* – US (1) Spain
(1104) global
(703)** Ghana (122) China
and Taiwan (107)***
Taiwan
(480) – China
(254) Sweden
(108) US (108)
Adaptivity – stock of resources
(q) Direct relationship with consumers (r) Forecasting
market changes X
(s) Innovative sales promotion methods
X
Human
readiness (t) Skills and qualification of employees
X X X
(u) Preparedness and skill of managers
X
Organizational
change (v) Decision- making methods and techniques
X X X
(w) Technology
level X X X X X
(x) R&D
expenditures
*HPM: High Performance Manufacturing project; ** IMSS: International Manufacturing Strategy Survey; *** sub-sample of GMRG (Global Manufacturing Research Group).
A. Chik´an et al.
International Journal of Production Economics 243 (2022) 108316
7 and De Meyer (1990) or Boyer and Lewis (2002). On one hand, our item level review underlines that OM related competitiveness papers are usually analyse these objectives. On the other hand, these objectives are so detailed, that they are rarely present in operations related DCs papers.
Third, as dynamic capabilities are linked to evolutionary fitness, we also assess adaptivity, as changes in resources and routines, even beyond operations, that enables adaptation. Competitiveness oriented papers in OM usually highlight the importance of both competitive priorities of operations and strategic decision areas in manufacturing (Avella et al., 2001). So, the focus goes beyond priorities and researchers also consider strategic aspects of technology, knowledge, internal inte- gration, market orientation, and customer and supplier interfaces (Ghalayini et al., 1997; Avella et al., 2001; Lii and Kuo, 2016; Swink and Hegarty, 1998; Danneels, 2016).
As Table 3 presents to assess the overall firm performance we have to combine market performance, operational priorities and internal re- sources related to market outcomes and employees. The third column of the table is based on Chik´an (2006), where the structure of the survey questions originates from.
4. Methodology and analysis 4.1. Survey and database
The Competitiveness Research Centre of Corvinus University of Budapest (CRC) has conducted a regular competitiveness survey of Hungarian firms since 1996. In the most recent fifth wave of the pro- gram, in-person surveys were conducted between November 2018 and July 2019. Detailed demographics of the sample and measures of its representativeness to the Hungarian economy can be found in the Ap- pendix. As described above, in this paper we focus on the effects of operations performance on firm competitiveness, thus the analysed subsample is restricted to firms in the manufacturing sector. Therefore, the final database used in the analysis contains 113 manufacturing firms in total.
The perception-based survey module included five different parts on strategy and key functional areas with about 1200 items. A short introductory survey was filled-in by the CEO, on the outcome measures used in this analysis. Items for FCI in the second column in Table 3 were among them. The four other parts of the questionnaires were completed by top-level executives in charge of the respective functional areas (management and strategy, marketing and logistics, production/opera- tions management and finance). Items used in our analysis to test the relationship between the FCI and production ordinary and dynamic capabilities in manufacturing firms were selected from the one filled-out by the operations manager.
4.2. Testing the FCI and the hypotheses
In this section the firm competitiveness index (FCI) is specified for manufacturing companies in the sample, followed by the formulation of hypotheses on the contribution of production to firm-level competitiveness.
FCI is operationalized for the selected subsample, following the concept detailed in section 2.3. We use the survey-based perceptive measures of capabilities and market performance to build the index. To build a valid, comprehensive measure of firm capabilities, we employ factor analysis for item selection and to construct factors representing various capabilities.
The exact set of questions used in this paper were introduced earlier (second column of Table 3). All questions were asked as “Our perfor- mance, compared to our competitors, between 2016 and 2018 in the selected dimension was …” and the respondents gave answers on a Likert scale of 1–5, with 1 indicating “much worse” and 5 indicating
“much better”.
Using this set of questions as a starting point exploratory factor
analysis (EFA) is used to decide on a structure of items that can be used for constructing our FCI for manufacturing firms in the sample. A sys- tematic process was used to choose items to be included in the final FCI.
The following conditions were defined for selecting the combination of items that will be used in the index:
- cumulative variance explained by all factors in the solution should be over 0.5;
- at least three items per factor with significant loading (i.e. over 0.5 factor loading);
- no cross-loadings (i.e. the same item showing significant loadings to more than one factor).
Following the exact testing process, that is described in the Digital Appendix alongside with corresponding program codes, eight candidate FCI configurations were found that fulfil all conditions. One of these configurations was selected for further analysis, but to strengthen robustness, results are also provided for other possible configurations in the Digital Appendix.
In this combination 14 items are used (n =99, due to missing values).
Calculating the Kaiser-Meyer-Olkin measure of sampling adequacy (KMO =0.85) for this set of items indicates that the correlation matrix is suitable for factor analysis (Dziuban and Shirkey, 1974). The initial eigenvalue test and the screen test suggest four factors, capturing a cu- mulative 57% of the inherent variation. The extracted factors are shown in Table 4. All items have a significant factor loading (>0.5) and there are no cross-loadings. Reliability of the factors are estimated using Cronbach’s alpha, which yields values over 0.7 for all factors, suggesting the reliability of the generated factors (Hair et al., 2014).
The factor structure is further confirmed on the sample (n =99) using confirmatory factor analysis (using the lavaan R package (Rosseel, 2012)). The measurement model follows the factor structure of the EFA results, the model is estimated using the MLM estimator, therefore
Table 4
Exploratory factor analysis results.
Factor
# Label Item Factor
loading Cronbach’s alpha 1 Quality (e) Product/service
quality 0.585 0.736
(f) Quality of
manufacturing activity 0.707 (w) Technology level 0.573
2 Delivery (g) Quality of materials 0.598 0.800 (h) Delivery time/service
time 0.718
(i) Delivery/service
accuracy 0.633
3 Flexible
servicing (j) Flexible responding to
consumer demand 0.545 0.806
(k) Flexibility of the
production system 0.667 (l) Flexibility of the
logistics system 0.687 (n) Quality of
production/customer service
0.637
4 Adaptivity (r) Forecasting market
changes 0.696 0.783
(s) Innovative sales
promotion methods 0.632 (t) Skills and
qualification of employees
0.626
(v) Decision-making
methods and techniques 0.512
Extraction method: principal component analysis, rotation method: varimax withKaiser normalization with reliability statistics.
A. Chik´an et al.
International Journal of Production Economics 243 (2022) 108316
8 standard errors are robust to non-normality. The model fit is adequate by most fit indicators (χ2 =113.656, df =71, χ2/df =1.601, p =0.001, CFI =0.912, TLI =0.887, RMSEA =0.083) (Keith, 2019) and all in- dicators load significantly to the latent constructs.
Finally, discriminant validity is established using heterotrait- monotrait ratio of correlations (Henseler et al., 2015). Results of the method, presented in Table 5, support the discriminant validity of the constructs as all results are below the 0.85 threshold used by Henseler et al. (2015) and others.
Now, that it has been established that these latent factors can capture a substantial share of the variance in the 14 items, and that these items can capture overall firm competitiveness (as defined above), and so an index of competitiveness in the context of Hungarian manufacturing firms can be created.
Put into the conceptual framework described in Section 2.3, this index is defined as follows:
FCI= (factor1+factor2+factor3+factor4) ×MP (2) where.
FCI – Firm Competitiveness Index (in the current context).
factor1…factor4 – factor scores from the individual factors, repre- senting the ordinary and adaptive capabilities of the firm, scaled to 2–10 for comparability to MP (see below).
MP – market performance perception.
Market performance perception was measured as part of the survey, in the form of two questions: “Our performance, compared to our competitors, between 2016 and 2018 in (1) market share (revenue)/(2) return on sales were …“. The respondents were again the chief execu- tives, who gave answers on a scale of 1–5, with 1 indicating “much worse” and 5 indicating “much better”. The MP indicator is an average of response to the two questions (therefore it is scaled 2–10).
The FCI in this form is calculated for all firms in the subsample, who had answers to the necessary questions available (n = 96).1 The generated indicator has a mean of 54.69, a median of 56.53, while its minimum is 14.94, and the maximum is 90, its standard deviation is 13.3. Its distribution is shown on the left panel of Fig. 2, while its relationship with its components (MP and capability factor scores) is shown on the right. It can be observed that the distribution is close to a normal distribution. In fact, the Shapiro-Wilk test indicates that the distribution is not significantly different from a normal distribution (p = 0.3613). On the right panel it can also be seen that both the MP and the capability scores are relatively high, resulting in generally high FCI scores.
4.3. The effect of production capabilities on FCI
As proposed in this section we will use the FCI index and its values, as defined above, in order to investigate the relationship between the perceived production and firm-level competitiveness.
As our research is engaged in studying the core capabilities of op- erations that underline the specific action programs of production area,
it is reasonable to adopt the most general and validated categorization of strategic management (Danneels, 2016). This categorization represents Peng et al.’s (2008) second order factors in operations.
The dynamic production capability (DPC) and ordinary production capability (OPC) were proxied by two sets of questions from the survey (see Table 6) that were asked from the manager responsible for pro- duction. These questions represent the perceived production process and functional unit (production) specific capabilities of the firm.
Therefore, they could (and should) be correlated with firm-level capa- bilities, but they remain specific to the production function, importantly because these answers represent the perception of the unit-level exec- utive rather than the CEO, who answered the firm level questions.
Items of the ordinary production capabilities (see Table 6) are operationalized through the evaluation and measurement of production resources, such as expertise of leaders and employees, work environ- ment or the organization of processes. This bears similarities to other function-specific formulations of ordinary capability (Drnevich and Kriauciunas, 2011; Lun et al., 2016; Qaiyum and Wang, 2018).
Dynamic capabilities are constructed from indicators that measure the evidence of adaptability and learning, like the use of technology, the ease of introducing new processes, the ability for change, knowledge creation and integration. This construct is comparable to other con- ceptualizations of dynamic capabilities (such as Drnevich and Kriau- ciunas, 2011; Makkonen et al., 2014; Qaiyum and Wang, 2018; Wu, 2007). Two simple indicators are used, generated from these questions by averaging the scores of the answers. These will be called DPC and OPC.
Hierarchical regression analysis is then used to analyse the rela- tionship between these operations level factors and the firm competi- tiveness index. FCI is treated as exogenous in the equations. As FCI measures a relative firm performance, it yields a conceptual model similar to what has been proposed by other studies in the field of busi- ness research (Drnevich and Kriauciunas, 2011; Qaiyum and Wang, 2018). In these models, both dynamic and ordinary production capa- bilities have an assumed positive impact on the firm’s relative performance.
Therefore, we form the following two hypotheses:
H1. Ordinary capabilities of production (at the level of the production area) positively impact the competitiveness of manufacturing firms.
H2. Dynamic capabilities of production (at the level of the production area) positively impact the competitiveness of manufacturing firms.
While there can be potential omitted variables that influence both the dependent (FCI) and the independent variables (OPC, DPC), the setup of this study provides controlling for multiple potential con- founding factors. First, in the study a subsample is used where all firms are from the same broad sector (manufacturing), therefore controlling for potential differences between industries. Second, questions were asked from the respondents in the form of “How your firm compares to your competitors in this dimension?“. This kind of question can control for other, more specific firm-level dimensions, such as firm-size, location or specific industry.
Nevertheless, there are other factors that can act as confounders in this case, therefore further variables are used to control for two potential influences: (1) the age of the firm can influence both competitiveness and productive capabilities through knowledge accumulation, (2) the size of the firm (which we capture by the headcount) again can influence both dependent and independent variables, nonetheless, it can also determine the distance between the CEO and the unit-level processes, and therefore can introduce a difference between the perception of the unit-level capabilities and the firm level capabilities. Table 7 presents descriptive statistics of the variables used.
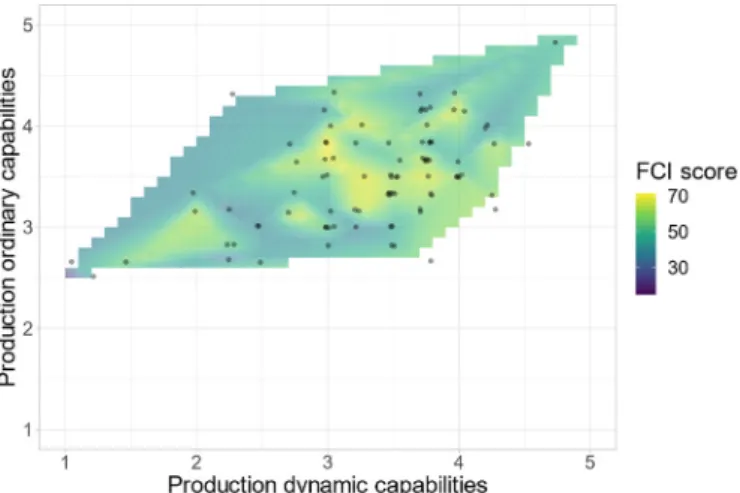
Fig. 3 presents the plotted relationship between the dependent var- iable (FCI) and the two main independent variables (DPC and OPC). The plot shows the OPC on the y-axis and the DPC on the x-axis, while the colouring is based on the value of the FCI. It can be observed, that there Table 5
Discriminant validity, HTMT method.
Factor # 1 2 3 4
1
2 0.766
3 0.684 0.653
4 0.652 0.659 0.701
1 Three responses were removed from n =99, because of data missing for calculating MP.
A. Chik´an et al.
International Journal of Production Economics 243 (2022) 108316
9 is a strong connection between DPC and OPC, but also that the FCI scores are the highest in the middle.
Hierarchical regression analysis was applied to examine the rela- tionship in depth. Three models are estimated with OLS regression. First, the control variables are included as a first step, then as a second step the main variables are added to the estimation. Finally, the third step in-
cludes an interaction term between DPC and OPC, informed by the plotted relationship between the variables and FCI. Therefore, the sec- ond step is defined as:
FCI=α+ β0X+β1OPC+β2DPC+ε (3)
where α is the intercept, X is the vector of control variables, and ε is the error term. Then, the third step is defined as:
FCI=α+βoX+β1OPC+β2DPC+ β3(OPC×DPC) +ε (4) Table 8 presents the results of the regression steps.
Normality of residuals were tested in all models using the Shapiro- Fig. 2. Descriptive properties of FCI.
Table 6
Items of ordinary and dynamic production capabilities.
Ordinary Production Capabilities
(OPC)a Dynamic Production Capabilities (DPC)b
Work environment Process innovation
(t8a) Service/production facilities
(Work Environment) (t9a) Setting up new manufacturing facilities (t8b) Available technology (t9b) Implementing new types of service/
production processes
Management Technology innovation
(t8c) Skills and expertise of
production managers (t9c) Learning about technology that has not been used before
(t8d) Organization of service/
production processes (t9d) Recruiting (engineers/workers) in new technical areas and processes
Expertise
(t8e) Technological expertise (engineering skills) (t8f) Technological skills and
expertise of workers
The statements preceded these items.
a“Assess your production resources and skills, relative to your competitors!” Items were measured on five-point scales, where 5 =ours are much better 1 = ours are much worse.
b “Relative to our competitors our company is better in …. ” Items were measured on five-point scales, where 5 =strongly agree, 1 =strongly disagree.
Table 7
Descriptive statistics of the variables.
Variable Obs. Mean SD Median Min Max SE
FCI 96 54.689 13.295 56.529 14.939 90.000 1.357
DPC 93 3.352 0.785 3.500 1.000 5.000 0.081
OPC 94 3.530 0.552 3.500 2.500 5.000 0.057
Age of the firm (z-score) 96 0.009 1.013 - 0.063 - 1.241 7.454 0.103
Headcount (z-score) 96 0.005 1.015 - 0.343 - 0.437 5.497 0.104
Fig. 3.The relationship of FCI score and capabilities of the functional pro- duction unit.
A. Chik´an et al.
International Journal of Production Economics 243 (2022) 108316
10 Wilk test (p =0.366, p =0.264, p =0.395 respectively). To test for potential multicollinearity the variance inflation factors (VIF) were calculated, in all models VIF factors for all variables are below 2.0, with the only exception of Step 3 where a higher VIF is expected because of the interaction term. Finally, the models were tested for hetero- skedasticity with the Breusch-Pagan test. The test fails to reject the null hypothesis of constant variance of the error terms in all models (p = 0.298, p =0.471, p =0.381 respectively), indicating that the assump- tion of homoskedasticity holds.
4.4. Discussion of the results
The production dynamic capability (DPC) is significant, in both steps, with a positive sign, indicating that there is a positive relationship between the perceived production area level dynamic capabilities and the overall, firm-level competitiveness. However, the production ordi- nary capability (OPC) does not show similar results. Its coefficient is non-significant through all the steps, with the point estimate having a negative sign (except in the third step). Meaning that when the level of production dynamic capabilities is taken into account, then the pro- duction ordinary capabilities will not significantly influence the level of competitiveness of the firm – dynamic capabilities are the important drivers. Based on the results of step 2, one unit increase in the DPC in- dicator (i.e., a score changes from an average of 3–4) could increase FCI by 4.882 points; in the same time a difference in the OPC according to the results, is not connected with a difference in the FCI.
The results of step 3, however, show somewhat different dynamics, similarly to what can be observed on Fig. 3. Namely, that there is a strong correlation between OPC and DPC, and when both have high values, FCI tends to be lower. This phenomenon is represented, to some degree, in step 3. Although the OPC coefficient is not significant, the point estimate changes direction and (only in this model) is positive.
While the coefficient of the interaction term is negative and significant.
The equation of step 3, complemented with the estimated coefficients (the β for OPC and for the control variables is not significant at the 10%
level) is:
FCI= 17.757×DPC+ − 3.957× (OPC×DPC) +ε (5)
Therefore, in this model, given the median value of OPC (3.5), if the DPC increases by 1 unit for the median firm, that will only lead to an increase 3.908 points in the FCI (compared to 4.882 seen earlier). While for a firm with a higher OPC value (like 4.5) it can lead to an even lower gains, less than 0.05 points.
4.5. Implications
The findings show a significant positive relationship between the FCI and production dynamic capabilities, while it does not show the same relationship between production ordinary capabilities and the FCI.
Therefore, the proposed H1 can be rejected, but H2, the hypothesis of dynamic capabilities having a positive effect on the competitiveness index, cannot be rejected.
Furthermore, it is found, that when – informed by Fig. 3 – an inter- action term between the capability scores is included, another dynamic connection can be observed. The significant negative result for the interaction term, together with the significant positive result for the production area dynamic capability score indicates that returns of pro- duction area capabilities are diminishing. According to these results, at least in the sample of Hungarian manufacturing firms, a firm with already high levels of production area ordinary capabilities (i.e., flaw- less working processes in the production unit) will likely gain less from the increase of production unit dynamic capabilities, than one with lower levels of production area ordinary capabilities.
5. Conclusions and further research
The paper discusses a conceptual introduction of a measure of firm performance called Firm Competitiveness Index and validates the index by using it in an analysis of contribution of production activities to competitiveness of manufacturing firms. First, we review the main theoretical contributions, and then we highlight the main findings of analyses.
5.1. Theoretical contributions
The main conceptual contribution of our paper is the combination of dynamic capability approaches and findings in two major fields of management research: strategic and operations management. Based on this approach the theoretical contributions of our paper are that (1), it proposes a concept of assessing competitiveness of manufacturing firms and (2) it links that directly to production area activities. In this paper the RBV was used to conceptualize firm level competitiveness, and then the formulated concept was tested from two standpoints. By analyzing capabilities and competitiveness together we go beyond the usual approach to competitiveness both in the strategic management and the operations management literature. Strategic management investigations usually do not embrace detailed characteristics of functional activities of the firm (in our case production area) while OM research is usually concerned only with ordinary outcomes (i.e. competitive priorities of production) (See Peng et al., 2008).
The literature review suggests further research on application of the concept of dynamic capabilities. One of our theoretical arguments is that firms are using their resources to build both operational and adaptive capabilities and integrate them via performing and orchestrating the appropriate business functions in order to achieve and renew their competitive performance, i.e. to maintain their competitiveness.
Measuring competitiveness requires (i) taking account of the firm’s re- sources, (ii) considering the ways it uses the resources to build both operational and adaptive capabilities (exploitation and exploration of resources), and (iii) measuring the effectiveness of utilizing its capa- bilities in the process of combining these capabilities (i.e. performing business functions). This effectiveness may have various measures, and we suggest the dual value creation concept, i.e. satisfying both cus- tomers need and owners’ expectation by an integrated value creation process resulting in acceptable market share and profitability.
This procedural logic appears generally at any for profit enterprises, however in its operationalization there may be major differences ac- cording to firm types. A general construct was conceptualized as the FCI, and was tested at manufacturing firms using survey results. To cope with this comprehensive trait, we combined driver (i.e. resources, routines) Table 8
Results of hierarchical regression analysis between firm-level competitiveness and production unit capabilities (n =93).
Independent variables Dependent variable
Firm Competitiveness Index (FCI) Step 1 Step 2 Step 3 Age of the firm (standardized) 0.143
(1.382) 0.318 (1.351)
−0.160 (1.362)
Headcount (standardized) 0.183
(1.383)
− 0.401 (1.364)
−0.411 (1.348) Production unit ordinary capability (OPC) − 0.127
(3.236) 14.621 (8.938) Production unit dynamic capability (DPC) 4.882**
(2.285) 17.757**
(7.628)
OPC ×DPC interaction −3.957*
(2.239)
Adjusted R2 −0.022 0.035 0.058
F for the step 0.015 3.676** 0.081*
F for the regression 0.015 1.846 2.137*
Note:*p <0.1; **p <0.05; ***p <0.01.
A. Chik´an et al.