Contents lists available at ScienceDirect
Global and Planetary Change
journal homepage: www.elsevier.com/locate/gloplacha
Mercury anomalies and carbon isotope excursions in the western Tethyan Csővár section support the link between CAMP volcanism and the end- Triassic extinction
Emma Blanka Kovács
a,b,c,d,⁎, Micha Ruhl
c,d,e, Attila Demény
f, István Fórizs
f, István Hegyi
f, Zsófia Rita Horváth-Kostka
a, Ferenc Móricz
g, Zsolt Vallner
a,b, József Pálfy
a,ha Department of Geology, Eötvös Loránd University, Pázmány Péter sétány 1/C, Budapest H-1117, Hungary
b Isotope Climatology and Environmental Research Centre (ICER), Institute for Nuclear Research, Bem tér 18/C, Debrecen H-4026, Hungary
c Department of Geology, Trinity College Dublin, The University of Dublin, College Green, Dublin 2, Ireland
d Earth Surface Research Laboratory (ESRL), Trinity College Dublin, The University of Dublin, Dublin 2, Dublin, Ireland
e Irish Centre for Research in Applied Geosciences (iCRAG), Trinity College Dublin, The University of Dublin, College Green, Dublin 2, Dublin, Ireland
f Institute for Geological and Geochemical Research, Research Centre for Astronomy and Earth Sciences (RCAES), Budaörsi út 45, Budapest H-1112, Hungary
g Institute of Mineralogy and Petrology, University of Miskolc, Miskolc-Egyetemváros H-3515, Hungary
h MTA–MTM–ELTE Research Group for Paleontology, Pázmány Péter sétány 1/C, Budapest H-1117, Hungary
A R T I C L E I N F O Keywords:
Triassic–Jurassic boundary stable carbon isotopes mercury
chemostratigraphy CAMP large igneous province
A B S T R A C T
The end-Triassic extinction is one of the major Phanerozoic mass extinctions and it appears to have been linked to coeval rapid and severe environmental change, thought to be triggered by volcanism in the Central Atlantic Magmatic Province (CAMP). However, direct stratigraphic evidence to substantiate this linkage and to help develop scenarios for the cascade of events is still scarce. Mercury is an increasingly widely used proxy to trace the volcanic activity associated with large igneous provinces (LIPs) in distal sedimentary sections, but so far Hg records are available from only a handful of Triassic–Jurassic boundary (TJB) sections. One of the few well-studied marine sedimentary sections with a continuous sedimentary record across the TJB is located at Csővár (Hungary) and it exposes an extended succession of carbonates deposited in an intraplatform basin on the western Tethyan shelf.
Previously, this section yielded one of the first convincing records of carbon isotope excursions (CIEs) across the TJB, albeit from low-resolution sampling. Here we report a new, high-resolution δ13Ccarb curve, supplemented with Hg measurements. A series of successive negative carbon isotope excursions (termed NCIE-1 to 6) attests to carbon cycle perturbations in the TJB interval. Four excursions appear significant after statistical smoothing. Of these, NCIE-3 exhibits the highest amplitude and is biostratigraphically constrained to the topmost Triassic, hence reliably corre- lated with the initial CIE, a globally recognised excursion closely preceding the TJB, and coincident with the end- Triassic extinction (ETE) horizon. The Hg concentration data provide the longest record available to date from a single section across the TJB. It shows very low values below NCIE-3 that are interpreted as the pre-volcanic background, followed by a prominent Hg peak that is nearly coincident with the most significant carbon isotope spike (NCIE-3). The slight lag suggests that onset of a major extrusive phase of CAMP (marked by a significant rise in Hg) closely followed the very onset of carbon cycle perturbation at that time (expressed by an abrupt change in the δ13Ccarb signal), possibly from biogenic methane release. Subsequent and recurring smaller Hg psuggest a pulsatory nature of prolonged volcanic activity. Organic content in the section is consistently low and sedimentary Hg con- centrations are therefore normalized against Fe content, a reliable proxy in the lack of significant lithological changes. The maximum sedimentary Hg concentration at Csővár is greater than that in any other TJB section, although not unprecedented if other events are considered. Three hypotheses are explored to explain the high values;
i) the hit-or-miss model could suggest that deposition of the sampled beds was fortuitously coincident with major eruptions, ii) the presence and preservation of cryptotephra could account for the unusually high sedimentary Hg enrichment, and iii) changes in the proportion of Hg-carrier phases throughout the studied succession, e.g. from magnetite to pyrite dominance, could have enhanced the potential of Hg capture and deposition. Collectively, the new data provide direct stratigraphic and geochemical evidence for the link between CAMP volcanism and carbon cycle perturbations and strengthen the case of their causal relationship with the end-Triassic extinction.
https://doi.org/10.1016/j.gloplacha.2020.103291
Received 16 April 2020; Received in revised form 31 July 2020; Accepted 3 August 2020
⁎Corresponding author.
E-mail address: kovacse@tcd.ie (E.B. Kovács).
Available online 14 August 2020
0921-8181/ © 2020 The Authors. Published by Elsevier B.V. This is an open access article under the CC BY license (http://creativecommons.org/licenses/by/4.0/).
T
1. Introduction
Large igneous provinces (LIPs) were commonly synchronous with, and are suspected to be the main trigger of, cascades of environmental changes and concomitant mass extinctions that fundamentally influ- enced the Phanerozoic history of the Earth system (Wignall, 2005; Bond et al., 2014). LIP-related greenhouse gas emissions and attendant global warming, ocean acidification and anoxia are key components of sce- narios proposed to explain observational evidence from the strati- graphic and fossil records (Bond and Grasby, 2017); therefore in- ferences from past events may inform predictions of trajectories of global change from greenhouse gas forcing in the Anthropocene (Waters et al., 2016). The end-Triassic mass extinction (ETE) and its relation to the Central Atlantic Magmatic Province (CAMP) has been a prominent example and the subject of several case studies exploring the LIP-extinction linkage (e.g. Marzoli et al., 1999; McElwain et al., 1999;
Pálfy, 2003; Whiteside et al., 2007; Pálfy and Zajzon, 2012; Jaraula et al., 2013; Pálfy and Kocsis, 2014; Thibodeau et al., 2016; Percival et al., 2017; Heimdal et al., 2018).
The temporal coincidence of the age of CAMP volcanics and marine and terrestrial biotic extinctions (Marzoli et al., 1999; Pálfy et al., 2000) contributed to establishing the overall pattern of synchrony of LIPs and extinction events (Courtillot and Renne, 2003). The subsequent reali- zation that complex and intertwined environmental and biotic changes are best reflected in perturbations of the carbon cycle, was evidenced by discoveries of major negative carbon isotope excursions (NCIEs) across the Triassic–Jurassic boundary (TJB) interval (Pálfy et al., 2001; Ward et al., 2001; Hesselbo et al., 2002). In the past two decades a multitude of studies documented carbon isotope excursions (CIEs) around the TJB and used them either for stratigraphic correlation or reconstruction of changes in carbon cycle dynamics or both (Korte et al., 2019). How- ever, controversies exist, and alternative interpretations have been proposed as causes for the CIEs, especially concerning the immediate cause for the CIE correlated with the ETE-horizon, on whether sub- surface intrusion-related gas release, explosive-magmatic gas release, or enhanced biogenic methane gas release was more potent (Beerling and Berner, 2002; Ruhl et al., 2010a, 2010b; Ruhl and Kürschner, 2011;
Davies et al., 2017; Capriolo et al., 2020). Clearly, new high-resolution records of biostratigraphically constrained TJB sections are needed to help resolve these issues.
Beyond establishing the temporal link of CAMP volcanism and the ETE, and the plausible role of LIP-driven environmental changes in triggering the biotic crisis, significant effort went into finding direct markers of volcanism in marine sedimentary sections where the ex- tinction event is best documented. Mafic mineral grains supposedly from air-fallen ash, distinctive clay minerals thought to derive from alteration of basaltic volcanic glass, and anomalous enrichment of rare earth elements (REE) at the TJB in a western Tethyan marine section now exposed in the Northern Calcareous Alps was proposed as distal evidence for coeval CAMP activity (Pálfy and Zajzon, 2012; Zajzon et al., 2012). In recent years, mercury-concentration and Hg/TOC (Hg data normalized against the total organic carbon content) data have been increasingly used, and proved as a possibly useful geochemical tracer of distal volcanic activity in sedimentary sections (Grasby et al., 2019 and references therein). This new proxy has been tested in only a few studies in a limited number of TJB sections (Thibodeau et al., 2016;
Percival et al., 2017; Lindström et al., 2019; Ruhl et al., 2020). Al- though these results are promising, they are somewhat controversial, due to potential issues in stratigraphic correlation between sections and the lack of understanding of processes that control the variability in Hg- enrichment in different sediments and between different sites. Com- bined, these issues underscore the need for the stratigraphic study of a sedimentary succession marked by non-variable marine depositional conditions.
To augment the available database and advance our understanding on potential CAMP-ETE causal links, here we present and integrate new
high-resolution Hg-concentration and δ13Ccarb records from Csővár, a key TJB section with a rich history of recent studies (Pálfy and Dosztály, 2000; Pálfy et al., 2001, 2007; Götz et al., 2009; Haas et al., 2010). The Csővár section in Hungary shares some similarities in paleogeographic and depositional setting with other western Tethyan reference sections in the Northern Calcareous Alps in Austria, including the GSSP for the base of the Jurassic system at Kuhjoch (Hillebrandt et al., 2013). Al- though the Csővár section was one of the first localities where the prominent NCIE at the ETE was documented (Pálfy et al., 2001) and confirmed by further studies (Pálfy et al., 2007), the data resolution was inadequate by current standards, and correlation of the set of CIEs to other localities remained contentious, requiring the generation of new data from denser sampling, which is reported here. In contrast to most other sections, the lack of significant lithological changes at Csővár, combined with a relatively elevated sedimentation rate provides an opportunity to obtain Hg concentration data at a higher temporal re- solution than in previously studied sections. As we report a series of Hg and δ13Ccarb anomalies over the extended TJB interval, we integrate the previously studied records from other TJB sections to assess whether the Hg load was indeed sourced by CAMP and discuss possible me- chanisms of formation and preservation of the Hg signal. Our results add to the ongoing debate about the characteristics and reliability of the Hg proxy for LIP volcanism and help refine scenarios of carbon cycle changes and biotic extinction across the TJB.
2. Background
2.1. Carbon isotope excursions
The Triassic–Jurassic transition is marked by dramatic global biotic turnover, known as the end-Triassic extinction. Near the extinction horizon, there is a significant NCIE, observed in marine and terrestrial sedimentary archives, across both hemispheres, which suggests a major perturbation of the carbon cycle. This anomaly is widely used as a global correlation tool, commonly referred to as the initial CIE (e.g.
Pálfy et al., 2001; Ward et al., 2001; Hesselbo et al., 2002). There are other anomalies around the boundary, such as the precursor CIE and the main CIE, however, their global significance remains debated (e.g.
Hesselbo et al., 2002; Ruhl et al., 2009; Ruhl et al., 2010a; Ruhl and Kürschner, 2011). An alternative naming and correlation scheme of CIEs was poposed recently, based on a combination of palynostrati- graphy and ammonite biostratigraphy (Lindström et al., 2017). Their emphasis on the use of palynological data, obtained from marine se- dimentary successions, led to discrepancies with the ammonite records as taxon ranges and abundance distribution of palynomorphs are sen- sitive to paleoenvironmental differences and thus vary geographically and between sections. An additional nomenclatural issue concerns the use of Spelae Zone, which is no longer an accepted zone and is thus not a biostratigraphic unit, therefore the younger two CIEs both belong to the Tilmanni Zone. Due to these controversies, we use the more widely established correlation scheme as advocated by Korte et al. (2019).
2.2. Mercury anomalies as proxy for LIP volcanism
Large Igneous Province volcanism and mass extinctions often occur synchronously (Bond et al., 2014), however, their cause-and-effect re- lationship is not uniformly accepted (e.g. Grasby et al., 2019; Schoene et al., 2019). Volcanogenically induced elevated carbon fluxes (e.g.
from basalt degassing, thermogenic and biogenic methane release) may have impacted on the global carbon cycle, but its stratigraphic link to the onset or peak of magmatism is poorly constrained, and carbon re- lease as cause for mass extinction cannot be convincingly demonstrated in every case (Self et al., 2006, 2014). In addition, not every LIP has a matching extinction and vice versa (Wignall, 2001).
A recently developed proxy to establish a potential link between past extinctions, as recorded in sedimentary archives, and LIP activity
utilizes elevated levels of sedimentary Hg as an indicator of major volcanism (Sanei et al., 2012). Modern day volcanism increases sig- nificantly the atmospheric Hg concentration, implying that LIP activity would potentially release large amounts of Hg into the atmosphere (Grasby et al., 2019 and references therein), e.g. ~3800 Mt of extra Hg is connected to the emplacement of the Siberian Traps (Wang et al., 2019) and ~150 Mt of Hg to emplacement of the Karoo-Ferrar LIP (Grasby et al., 2019). Mercury release from LIP emplacement possibly largely results from volcanogenic degassing, but it can also be released during the intrusive phase and resulting contact metamorphism with organic-rich sediments (Grasby et al., 2013; Percival et al., 2015;
Heimdal et al., 2019; Jones et al., 2019).
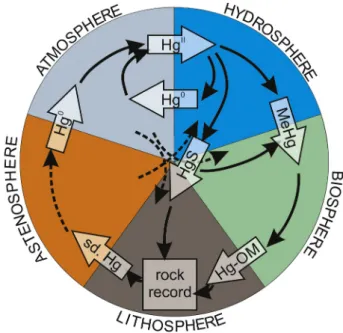
The present-day natural Hg cycle is marked by multiple sources and sinks, as well as temporary Hg reservoirs (Fig. 1). The most important natural source of Hg in modern environments is the direct emission from volcanism, on land and in the oceans. In the present-day ocean Hg- concentrations vary significantly, between 1×10⁻⁵–2.4×10⁻⁴ ppb, lar- gely depending on the proximity to mid-ocean ridges, as its residence time is around 350 years (Gill and Fitzgerald, 1988; Bowman et al., 2015).
The dominant phase of Hg released into the atmosphere, from ter- restrial volcanism, occurs in the form of elemental gas (Hg0) and its atmospheric residence time is 0.5–1.5 yr (Pyle and Mather, 2003; Selin, 2009; Wang et al., 2019), allowing for a global distribution in the present-day atmosphere (Schroeder and Munthe, 1998). Hg+2 is the more common oxidation state (+1 is rarer), which can also be trans- ported aerially; however, Hg+2 will be transported across much shorter distances (in the order of 10–100 km), as it stays in the atmosphere for only a few weeks (Schroeder and Munthe, 1998; Grasby et al., 2019).
Solid-state Hg can be volcanogenically emitted, and the distance be- tween source and deposition depends largely on the diameter and/or mass of the aerosol particle that Hgs may be attached to (Schroeder and Munthe, 1998). During explosive volcanic activity, marked by ex- tremely high plumes (20–40 km in altitude, reaching the more stable stratosphere), gaseous and ash-bound Hg may be able to travel large distances, carried by stratospheric winds (Grasby et al., 2019).
Deposition of Hg, i.e. its removal from the atmosphere, depends on the concentration of the different Hg phases. If the concentration of Hg+2 and/or Hgs is greater than 100 pg/m3 then Hg can be removed through wet and dry deposition (Holmes et al., 2010; Grasby et al., 2019). However, if these Hg-phases have lower concentrations in the atmosphere, then Hg is removed by wet deposition and oxidation of Hg0. Although Holmes et al. (2010) suggest that bromine can also oxidize Hg0, HgOg is commonly the product of reactions with O3, NO3
or other oxides (Hall, 1995). The newly formed HgOg is then adsorbed by aerosol particles, which are removed from the atmosphere through precipitation (Poissant, 1997).
Plants aid in the dry removal of Hg from the atmosphere as Hg is adsorbed onto leafs and either taken up by the stomata or washed off by precipitation into the soil (Schroeder and Munthe, 1998). The amount of Hg in plant tissue is closely related to the atmospheric Hg con- centration (Grasby et al., 2019), but varies significantly between plant- species due to different adsorption rates. If Hg is taken up and retained by plants, it can enter the soil with the litterfall, after which it can be re- mobilized and taken up by the root system (Schroeder and Munthe, 1998). As plants can be enriched in Hg, elevated wildfire activity can enhance the Hg-flux into the atmosphere. For example, it has been proposed that an increased wildfire activity in the latest Permian, in response to Siberian Traps emplacement driven climatic and environ- mental change, resulted in an elevated flux of Hg into the ocean-at- mosphere system (Grasby et al., 2017).
Other natural Hg sources into past environments may have been the melting of permafrost, or continental weathering (de Lacerda et al., 2017; Grasby et al., 2019). Whatever the source of Hg, as reactive Hg2+
reaches the ocean, it commonly forms MeHg (methylmercury), which then accumulates and builds Hg-OM (organo-mercury complexes)
(Ravichandran, 2004).
The analyses of changes in the Hg abundance in sedimentary ar- chives spanning major global change events and/or large igneous pro- vince emplacement, potentially allows for constrains on the change in Hg capture and storage compared to the average Hg influx over geo- logical time (Grasby et al., 2019). Due to the reactivity of the Hg, there is likely no long-term Hg accumulation in the marine reservoir.
As Hg is most often attached to organic matter, usually the TOC and Hg concentration curves in sedimentary archives evolve parallel to one another, because changes in the sedimentary Hg concentration are re- sulting from changes in its sequestration with organic matter, rather than in Hg loading of the environment (Outridge et al., 2007; Gehrke et al., 2009; Sanei et al., 2012). For this reason, sedimentary Hg-con- centrations are commonly normalized against TOC and reported as Hg/
TOC values. However, due to the increasing uncertainty on TOC ana- lyses in low TOC samples, normalization should be avoided when TOC < 0.2 wt%; and even with TOC values below 0.5 wt% caution must be taken (Grasby et al., 2019).
Although Hg is commonly bound to organic matter, it can also occur in a bond to clay minerals, or as sulphides (such as pyrite (FeS2), pyr- rhotite (Fe1-xS) and mackinawite (FeS); under anoxic depositional conditions), or in Fe-oxides (under oxic depositional conditions) (Shen et al., 2019a, 2020 and references therein). It may therefore be useful (or essential) to normalize sedimentary Hg concentrations against Al, Fe, and/or total/pyrite S (Grasby et al., 2019).
3. Geological and stratigraphic background
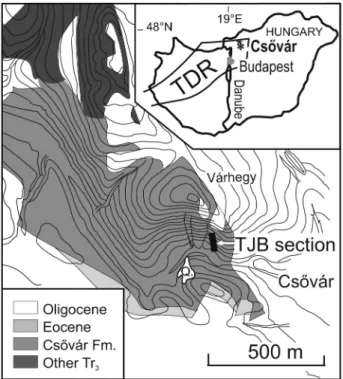
The Vár-hegy section near the village of Csővár lies 50 km north- northeast of Budapest (Fig. 2), within the fault-bounded Nézsa-Csővár block on the left side of the Danube, at the northeastern extremity of the Transdanubian Range, within the Alcapa Megaunit (Csontos and Vörös, 2004). Palaeogeographically, it formed part of an intraplatform basin near the external margin of the extensive Dachstein carbonate platform system that started to disintegrate in the Late Triassic–Early Jurassic, due to the ongoing opening of the Neotethys Ocean (Fig. 3) (Haas et al., 2010, 2012). The Nézsa-Csővár block consists of Triassic–Jurassic and Eocene sedimentary rocks. The Mesozoic carbonates were deposited on the slope and in the basin, as well as on the adjacent platform; slope and
Fig. 1. The natural Hg cycle. The wide-open arrows show the dominant phase in which Hg is transported, whereas the black arrows represent the possible transition pathways between Hg phases (with solid lines for known and dashed lines for assumed but less explored pathways).
basinal facies are assigned to the Csővár Limestone Formation. The lower (Upper Carnian–Lower Rhaetian) part of the Csővár Limestone Formation was penetrated by the Csv-1 core. Higher parts of the for- mation are exposed in the Pokol-völgy quarry (Haas et al., 1997) and on the south-facing, steep slope of the Vár-hegy. The latter outcrop in- cludes the Rhaetian–Hettangian interval (Pálfy and Dosztály, 2000) and extends up to the Sinemurian (Kozur, 1993). The Csővár area is
structurally complex as it was affected by Late Cretaceous–Early Pa- leogene folding, and subsequently segmented by younger normal faults (Benkő and Fodor, 2002). The measured TJB section lies within a stratigraphically intact domain with gently northeast-dipping strata.
The Vár-hegy section has been known for over 150 years (Szabó, 1860); its significance as a continuous TJB section was only recognized much later, with the boundary identified at around 20 m (Pálfy and Dosztály, 2000). Detailed microfacies studies revealed remarkable li- thological continuity between the Triassic and Jurassic parts of the succession (Haas and Tardy-Filácz, 2004). The first 11 m of the section (Fig. 4) consists of laminated calcareous mudstone alternating with thin to medium-bedded limestone, followed by a 1 m thick bioclastic lime- stone bed. In the interval of 12–15 m laminated calcareous mudstone is the most common rock type. From there, up to 32 m, slumps are common features in the sequence. Between 32–34 m, platform-derived ooidal limestone is exposed. The upper part of the 57 m thick measured section comprises laminated calcareous mudstone alternating with bedded limestone and limestone with slumps (Pálfy and Dosztály, 2000). The sedimentary succession at Csővár is consistent with its origin at the foreslope of a carbonate platform and in proximal to distal parts of an intraplatform basin. Microfacies analyses suggest a general upward deepening trend that can be considered as the record of the transgressive phase of a long-term, second order transgression-regres- sion cycle. Meter-scale cyclicity is observed in the alternation of cal- careous turbidite and basinal facies, which may be interpreted as third- and fourth order cycles (Haas and Tardy-Filácz, 2004).
3.1. Ammonoid biostratigraphy
The position of the TJB is approximated by several fossil groups, but each group has a sporadic record due to preservation issues. Despite intensive sampling efforts, the last occurrence of various Triassic and the first occurrence of Jurassic taxa are congruent albeit recorded at different levels. Ammonoids are of paramount importance as they provide the primary marker for the TJB definition (Hillebrandt et al., 2013). Ammonoids are rare in the section and are poorly or moderately Fig. 2. Geographical location and geological context of the studied
section.TDR: Transdanubian Range, TJB: TriassicJurassic boundary. From Pálfy et al. (2001).
Fig. 3. Palaeogeographical position of the Csővár basin in global context (panel A) and within the western Neotethys (panel B). CAMP: Central Atlantic Magmatic Province, LBM: London-Brabant Massif, BM: Bohemian Massif, MM: Malopolska Massif, AA: Austroalpine Units, WC: Central and Inner West Carpathian Units, TI:
Tisza Unit, TR: Transdanubian Range, SL: Slovenian basin, JU: Julian Alps, B: Bükk Unit, ADCP: Adriatic-Dinaridic Carbonate Platform, BO: Bosnian Zone, D:
Drina–Ivanjica Unit, J: Jadar Block, SI: Sicilian Basin, L: Lagonegro Basin, JEF: Jefra Basin, PI: Pindos Basin, PEL: Pelagonian-Subpelagonian Units. After Haas et al.
(2019).
preserved, especially in the marly, laminated beds (Pálfy and Dosztály, 2000). The lowermost 10 m of the section yielded Rhaetian ammonoids (Choristoceras spp., Cladiscites sp.). At 19 m the first Jurassic phyllo- ceratid was found ex situ and identified as Nevadaphyllites psilomorphum (Pálfy et al., 2001). The lowermost Jurassic ammonoid that occurs in situ was discovered at 29.5 m (Psiloceras sp.), representing the lower Hettangian. From the top of the section (Pálfy and Dosztály, 2000) reported a finding of Waehneroceras (~54 m), which suggests a middle Hettangian age. However, new finds of Schlotheimia sp. accompanied by Juraphyllitidae gen. et sp. indet., discovered near the same level during
this study (~52 m), indicate the base of the upper Hettangian Mar- morea Zone (see Appendix A.3.).
3.2. Radiolarian biostratigraphy
Although previous studies established a broad radiolarian bios- tratigraphy of Vár-hegy (Kozur and Mostler, 1990; Kozur, 1993), Pálfy et al. (2007) were the first to constrain the TJB in the section. Radi- olarians at ~1.5 m represent the Globolaxtorum tozeri zone of late Rhaetian age, whereas radiolarians from ~26.5 m are assigned to the Fig. 4. New δ18O, δ13Ccarb, Hg and Hg/Fe concentration data from the Csővár, Vár-hegy section. The light-grey curves are the 5-point running averages for δ18O, δ13Ccarb curves, respectively. Lithostratigraphic and microfacies log is modified from Haas and Tardy-Filácz (2004). Ft: fine-grained turbidite, Mt: medium-grained turbidite, Rw: radiolarian wackestone, La: calcisiltite-calcilutite laminate, Lb: lithoclastic-bioclastic grainstone/packstone, On: oncoid, grapestone grainstone/
packstone/wackestone. Biostratigraphy is from Pálfy and Dosztály (2000), Pálfy et al. (2001), Götz et al. (2009) and this study. The palynological data is from Götz et al. (2009).
Relanus hettangicus zone of early Hettangian age (Kozur and Mostler, 1990).
3.3. Conodont biostratigraphy
The bottom of the section (Bed 1) yielded a conodont fauna thought to belong to the Misikella posthernsteini zone (Kozur and Mock, 1991;
Pálfy et al., 2001, 2007). Conodonts from 1.5–10.5 m were assigned to the Misikella ultima zone. However, recently Karádi (2018) proved the first occurrence of M. ultima significantly lower in the Csővár Fm., hence suggesting that the lower part of the Vár-hegy section lies en- tirely within the upper part of the revised M. ultima zone (Karádi et al., 2019). At 31.7 m Neohindeodella detrei was found, which is considered the sole survivor of the end-Triassic extinction in the conodont fauna (Kozur, 1993; Pálfy et al., 2001, 2007), although its occurrence could not be reproduced during this study. Taken together, biostratigraphy of primary age-diagnostic fossils (ammonoids, conodonts, radiolarians) establish an uppermost Rhaetian to middle-upper Hettangian chronos- tratigraphic range of the Vár-hegy section.
3.4. Foraminiferan biostratigraphy
The lowest part of the section (0–12.5 m) has an abundant and di- verse Rhaetian foraminifera fauna (Pálfy et al., 2007). Above 12.8 m only impoverished assemblages are found. Platform-derived taxa are generally scarce in the section, however above 34.7 m, only ner- itic–bathyal fauna is described. The first Jurassic foraminiferan species (Involutina liassica) was identified from Bed 119, at 52 m.
3.5. Palynology
Palynological and palynofacies analyses were carried out in the interval of 7–37 m in the section (Götz et al., 2009). The lower part of the section yielded a late Rhaetian palynomorph assemblage. At ~19 m, there is a sudden increase of prasinophytes (Tasmanites), and trilete spores (Concavisporites spp., Deltoidospora spp.) reach their peak abun- dance. The Hettangian assemblage (26–37 m) suggests a distal basinal setting, based on the presence of degraded organic matter, small equidimensional phytoclasts and foraminiferal test linings. The paly- nofacies patterns imply a continuously increasing continental influx and a change in the terrestrial vegetation in the hinterland.
3.6. Chemostratigraphy
The Vár-hegy section at Csővár was one of the first TJB sections where a NCIE was reported (Pálfy et al., 2001). With values ranging from -3.9‰ to 3.2‰ in the previously published δ13Ccarb data, the two main features of the curve are a smaller negative peak in the Rhaetian and a more significant one at the top of the Triassic strata (Pálfy et al., 2001, 2007). The major negative anomaly was further shown by a high- resolution resampling of the boundary interval, which revealed several smaller, temporally closely-spaced negative shifts within the excursion (Pálfy et al., 2007). Values fluctuate from -30.2‰ to -27.5‰ in the δ13Corg curve and a prominent negative excursion is observed nearly coincident with the larger negative δ13Ccarb anomaly (Pálfy et al., 2001, 2007). As the NCIE around 19 m has been detected in both the δ13Ccarb
and δ13Corg data, it was thought to represent a primary signal. Pre- viously measured δ18O values fluctuate between -3.2‰ and -0.2‰, however some extreme (down to -10.3‰) negative values were mea- sured as well (Pálfy et al., 2001, 2007).
3.7. Organic matter characterization
The total organic carbon content (TOC) was found to remain below 0.1% in the section (Pálfy et al., 2001). Based on the hydrogen index (HI), the organic matter is of marine origin. The variation in the amount
of insoluble residue has a similar pattern to the TOC fluctuation, both of which, along with HI have a distinct decline at the top of the Triassic.
HI* and the δ13Corg show a reverse correlation in turbidites but not in the basinal facies. This was attributed to the fact that the organic matter in turbidites consists largely of isotopically heavy terrestrial particles, which have a low H-content (Pálfy et al., 2007).
3.8. Magnetostratigraphy
Magnetostratigraphy of the section was also investigated, with the aim of finding the short reversed polarity zone in the latest Rhaetian (Pálfy et al., 2007). This study established that the dominant carrier of remanent magnetism in the section is magnetite, revealing normal po- larity throughout most of the section. However, in the Triassic–Jurassic transition interval, goethite, which occurs as alteration product after pyrite, generated a false, post-depositionally acquired signal of reversed polarity.
4. Material and methods 4.1. Sampling in the Csővár section
A total of 243 rock samples with 20 cm spacing were collected from the Vár-hegy section at Csővár (see Appendix Table A.1.). The sampled profile is identical to that reported in Pálfy et al. (2001, 2007). Only fresh, unweathered hand specimens were picked with an average size of 3x6x1 cm. A 2.7 m long interval between 21.8–24.6 m, above the previously identified initial CIE, was excluded from sampling as it consists of slumps. All new isotopic and Hg analyses were done on the same set of samples, albeit with a different measurement resolution.
In order to assess the reliability of the carbon isotope record in the section, two 20 cm thick slabs from individual beds of slightly different lithology were collected. One of them represents a hard, homogeneous limestone layer (Bed 19 at 7 m) and another one with softer, more marly lithology (Bed 18 at 6.6 m). These slabs were sampled at a high resolution (~1 cm) by micro-drilling (see Appendix A.1., Figures A.1., A.2, Tables A.4. and A.5.).
4.2. Stable carbon and oxygen isotope analysis
The entire suite of 243 samples collected from the section, with a 20 cm resolution, was processed for δ13Ccarb analysis. Each sample was drilled with a Proxxon Micromot 50/E drill (5000/min power) to obtain powder. Calcite veins were avoided. Stable carbon and oxygen isotope compositions were determined by reacting carbonate powder samples (150–200 μg) with orthophosphoric acid at 72 °C (Spötl and Vennemann, 2003) and analyzing the evolved CO2 by an automated GASBENCH II sample preparation device attached to a Thermo Fin- nigan Delta Plus XP isotope ratio mass spectrometer (IRMS) at the In- stitute for Geological and Geochemical Research (IGGR, Budapest, Hungary). Three laboratory standards calibrated with the NBS-18, NBS- 19 and LSVEC standards (provided by the International Atomic Energy Agency) were used for inter- and cross-laboratory standardization. A Harding Iceland Spar (Landis, 1983) sample was measured as unknown in the course of the study, and yielded δ13C and δ18O values of –4.82 ± 0.07 ‰ and –18.53 ± 0.07 ‰ (n=20), respectively. These values are close to the published values of -4.80 and -18.56‰, re- spectively (Landis, 1983). On the basis of these results, the accuracy and reproducibility of δ13C and δ18O values are better than ± 0.1‰.
4.3. TOC analysis
A suite of 123 samples were selected for total organic carbon (TOC) analysis, at 20 cm resolution from 0 to 22 m, and at 60 cm resolution from 22 to 28 in the studied succession. The powdered samples were measured at the Earth Surface Research Laboratory (ESRL) at the
Department of Geology at Trinity College Dublin, The University of Dublin. For total inorganic carbon (TIC) measurement an average of 50 mg of powder was weighed, whereas for total carbon (TC) measurement an average of 80 mg was weighed. Both TIC and TC were measured on an analytikjena®, multi EA 4000 elemental analyser. To the TIC samples 30-40% H3PO4 acid was added automatically and the resulting CO2 was introduced into the EA device. For TC analyses, carbon in a sample was oxidized to CO2 (in an oxygen flow) at high temperature (~1200 °C). In both cases the results were expressed as % values. To obtain TOC va- lues, TIC values were subtracted from the TC values. The detection limit was ~0.03%. Six samples were measured in duplicate or triplicate for total carbon (TC) and total inorganic carbon (TIC) concentrations (and thus calculated TOC concentrations), which covered an average TOC- concentration range of ~0.01 to ~0.9%. The standard deviation on the duplicate or triplicate measurements lies between 0.02 and 1.3%.
4.4. Mercury analysis
A suite of 163 rock samples were selected for mercury analysis, at 20 cm resolution from 0 to 26 m, and at 60 cm resolution from 26 to 52 m in the studied succession. The selected samples were powdered with an agate mortar and pestle. The mercury analysis was performed in the Earth Surface Research Laboratory (ESRL) at the Department of Geology at Trinity College Dublin, The University of Dublin, on a LECO AMA-254 mercury analyser, using the methodology described by Hall and Pelchat (1997). An average of 115 mg per samples was weighed on a scale. During the initial test measurements, it became obvious that, due to extremely low Hg concentrations, the standard 'isolation-mode' is inadequate for these samples, as it would often yield negative ppm values. To avoid this problem, all samples were measured in 'blank- mode' (on the same machine), which provides an absolute quantity of analyzed Hg (in ng). The obtained absolute Hg-concentrations were
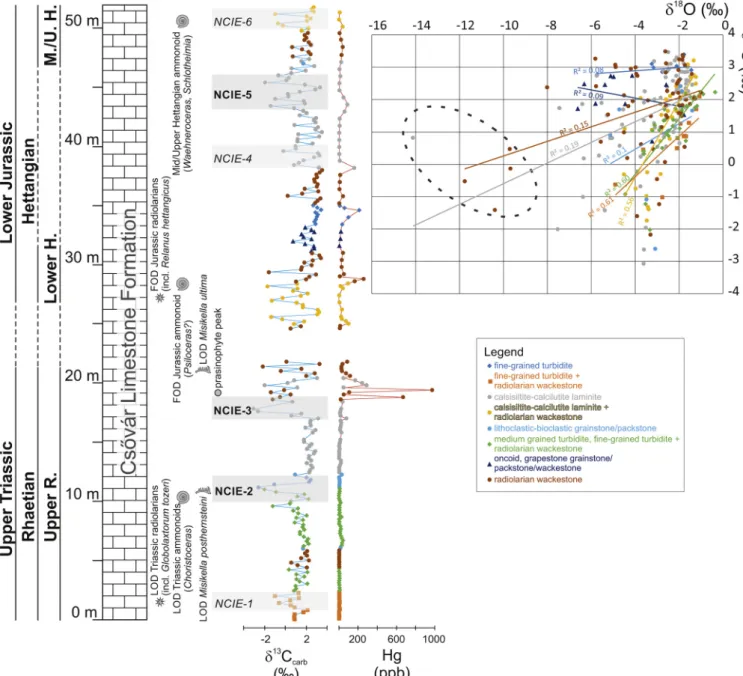
Fig. 5. New δ13Ccarb and Hg data with each microfacies represented by different colours, as well as a cross-plot diagram of the new δ13Ccarb and δ18O values. The linear trendlines and the correlation coefficients (R2) were calculated for each microfacies. The circle indicates a distinct group of samples with extremely low δ18O values. Lithostratigraphic and microfacies log is modified from Haas and Tardy-Filácz (2004). Biostratigraphy is from Pálfy and Dosztály (2000), Pálfy et al. (2001), Götz et al. (2009) and this study.
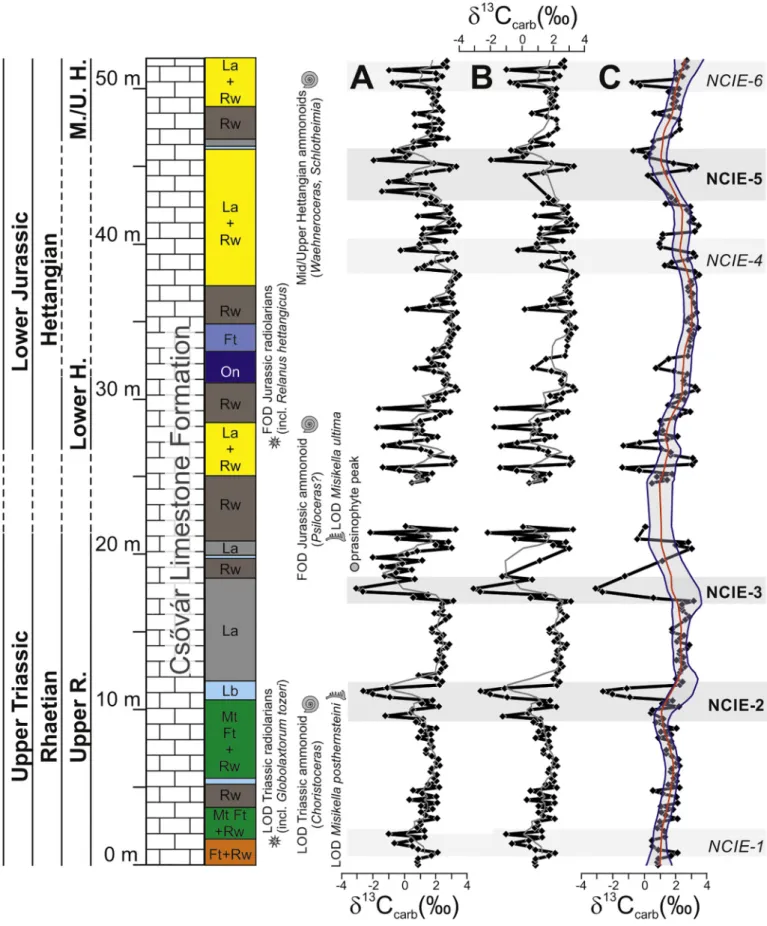
Fig. 6. δ13Ccarb curves of Csővár, Vár-hegy section. (A) The entire new δ13Ccarb dataset. The light-grey line is the 5-point running average. (B) Screened δ13Ccarb curve, after omission of samples with δ18O values under -5‰. The light-grey line is the 5-point running average. (C) A further screened δ13Ccarb curve, after omission of single-point spikes, and LOESS smoothed curve (f=0.1) of this screened δ13Ccarb dataset. Lithostratigraphic and microfacies log is modified from Haas and Tardy- Filácz (2004). Ft: fine-grained turbidite, Mt: medium-grained turbidite, Rw: radiolarian wackestone, La: calcisiltite-calcilutite laminate, Lb: lithoclastic-bioclastic grainstone/packstone, On: oncoid, grapestone grainstone/packstone/wackestone. Biostratigraphy is from Pálfy and Dosztály (2000), Pálfy et al. (2001), Götz et al.
(2009) and this study.
subsequently calculated offline to obtain a concentration value. In cases of high (> 5 ng) values, blanks were analysed and/or test measure- ments were done between successive samples to exclude the possibility of internal Hg contamination. Every fifth sample was measured twice.
The standard deviation on duplicate measurements is 1.18 ppb, and the difference between duplicates is (on average) ~3.95% the average of duplicates (see Appendix Table A.2.).
Some samples were also analysed in ‘isolation-mode’ (providing a direct ‘online’ approximation of sedimentary Hg concentrations).
Obtained sedimentary Hg concentrations analysed and calculated off- line (blank-mode) and online (isolation mode) agree well in the con- centration range of 45–1000 ppb (with a linear correlation and R2 = 0.99, n=15 (excluding 3 outliers). The correlation between the two different measurement modes decreases exponentially when con- centrations are towards the ppb range. Only blank-mode values are reported and discussed in the figures and text of the main manuscript, but all data and further discussion is provided in Appendix A.6., Table A.3.).
5. Results
5.1. δ13Ccarb and δ18O
Throughout the section, δ13Ccarb values vary considerably between -3.07‰ and 3.49‰, with an average of 1.51‰ (Fig. 4) (see Appendix Table A.1.). Although a slightly increasing trend is apparent overall, the most prominent feature is the presence of a series of negative carbon isotope excursions (NCIEs) of different amplitude and stratigraphic extent, labelled here successively from NCIE-1 to NCIE-6 (Fig. 6). The stratigraphically first NCIE, at the base of the section, has an amplitude of ~3‰ (NCIE-1 at 1.4–2 m). This is followed by another anomaly of
~-5‰ (NCIE-2 at 9–11.6 m). Above the last observed Triassic bios- tratigraphical marker, at 17 m, there is a sudden, significant drop in δ13Ccarb values of over 6‰ (NCIE-3 at 17–18.4 m). Following the TJB, in the upper part of the section, the δ13Ccarb values fluctuate noticeably, with three smaller negative excursions observed (NCIE-4 at 38–39.6 m, NCIE-5 at 45.4 m, and NCIE-6 at the top of the section). δ18O values vary between -14.12‰ and -0.34‰ along the section, with greater magnitude in the upper half. The minimum value (-14.12‰) is ob- served at around 20 m, near NCIE-3.
5.2. TOC
Out of the total of 123 samples, only 39 measurements were above detection limit (0.03%) and TOC content remains below 2% throughout the section (see Appendix Table A.1.). The measured values vary be- tween 0.03–1.84%, and only for 10 samples exceed 0.5%. There is no clear trend or pattern as the peak values are isolated at the base of the section, at 3.0 m and 15.2 m.
5.3. Sedimentary Hg concentrations
Mercury concentrations are overall very low in the lowest part of the section (from 0–5.8 m), with an average of 3.39 ppb (Fig. 4; see Appendix Table A.1.). In the interval of 5.8–8 m, Hg values rise to 40.8 ppb, but then gradually return to lower values of on average 2.13 ppb.
Generally low (< 10 ppb) sedimentary Hg concentrations from 8 to 14.6 m are interrupted by four minor peaks of 27 ppb (at 8.6 m), 17 ppb (at 9.8 m), 29 ppb (at 12.2 m) and 20 ppb (at 13.2 m). At 14.8 m the sedimentary Hg values start to increase and reach 76 ppb at 17 m, followed by a decrease to 11 ppb at 17.4. Values vary greatly from 17.6–21.8 m, with peak concentrations of 668 ppb at 18.8 m and 972 ppb at 19.4 m. In the upper half of the section, sedimentary Hg con- centrations are on average lower than in the interval from 18–22 m, but with several distinct peaks at 25 m (98 ppb), 28.8 m (256 ppb), 34.6 m (212 ppb), 38.2 m (164 ppb) and 43.6 m (91 ppb).
6. Discussion
6.1. Correlation of δ13Ccarb and δ18O and the possible impact of diagenesis The new Csővár δ13Ccarb and δ18O records presented here show the same general trends observed in previous studies (Pálfy et al., 2001, 2007). The obtained data may reflect, to some extent, diagenetic al- teration of the studied carbonates (Brand and Veizer, 1981; Veizer et al., 1999). A cross-plot between δ13C and δ18O values shows a dis- tinct grouping of samples with significantly lower δ18O values (Fig. 5).
The majority of samples, however, show δ13C and δ18O values that are expected for diagenetically unaltered sediments, without a clear cross- correlation (with an average R2 value of 0.3 for the entire data-set (excluding the outliers)), similar to observed by Pálfy et al. (2007).
Previous analyses identified and characterized several microfacies types in the section (Haas and Tardy-Filácz, 2004), and those results were used to examine if there is any correlation between depositional processes and the isotopic composition of the samples. Generally, δ18O versus δ13C cross-plots of the microfacies subsets reveal no facies-con- trol on the chemical composition of the studied sediments. Only sam- ples with oncoidal grapestone microfacies show a slight diagenetic trend, albeit with a very low R2 of 0.09 (n=11; Fig. 5). This is likely due a second phase of cementation, controlled by meteoric water, following the formation and deposition of the oncoids, which causes a shift to- wards more negative δ18O values (Pederson et al., 2015).
6.2. Interpretation of the δ13Ccarb record
To assess and ensure that the obtained δ13Ccarb data (Fig. 6A)can be reliably interpreted to reflect changes in the δ13C of DIC in the basin, across the studied stratigraphic interval, and as captured in the studied stratigraphic record, three approaches were employed. Firstly, δ13C data from samples with low δ18O values (below -5‰), commonly as- sociated with diagenetic alteration (Brand and Veizer, 1981), were omitted (Fig. 6B). Secondly, single-point spikes in δ13Ccarb were omitted, where a single value differs more then ~2‰ from the average of the pre- and succeeding samples (Fig. 6C). This was justifiable be- cause of the observations from the preliminary analyses of the two 20 cm thick slabs, which showed that even within a 20 cm rockslab in- dividual spikes occur that most probably are not the result of change in the carbon cycle (see Appendix A.1., Figures A.1., A.2, Tables A.1., A.4.
and A.5.). Thirdly, a LOESS smoothing (f=0.1) was performed for the remaining dataset with the originally identified NCIEs (NCIE-1 to NCIE- 6) also apparent in the LOESS smoothed curve (Fig. 6C). As NCIE-1–6 are all recognized on all the curves, they are interpreted as primary signals, thus a reflection of changes in the carbon cycle. Out of these six anomalies, NCIE-2, -3, and -5 are the most prominent excursions, with NCIE-3 being the most significant.
6.3. Carbon isotope excursions at Csővár and their correlation with other TJB sections
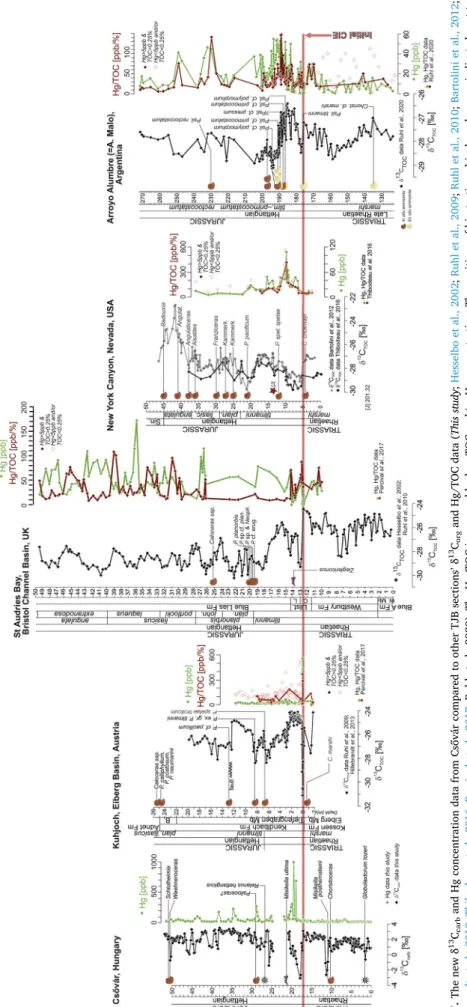
The δ13C curve obtained at Csővár likely reflects changes in, or perturbations to, the global exogenic carbon cycle; this is tested by comparison of the Csővár δ13C record with stratigraphically over- lapping δ13C records from other Triassic–Jurassic boundary sections where Hg data are also available (Fig. 7). The δ13Corg record from the marine TJB section at St. Audrie’s Bay, SW England, is marked by three NCIEs (Hesselbo et al., 2002; Ruhl and Kürschner, 2011). The lower- most is a ~2‰ negative excursion in the uppermost Rhaetian, referred to as the precursor CIE (Ruhl and Kürschner, 2011). The most significant anomaly in the section is a sharp ~4‰ NCIE, named as the initial CIE, at the same stratigraphic level as the end-Triassic mass extinction (ETE), based on sporomorphs and dinoflagellates (Hesselbo et al., 2002). The youngest NCIE was identified higher in the section, starting below the base of the Psiloceras planorbis Zone in that section, and
Fig. 7. The new δ13Ccarb and Hg concentration data from Csővár compared to other TJB sections’ δ13Corg and Hg/TOC data (This study; Hesselbo et al., 2002; Ruhl et al., 2009; Ruhl et al., 2010; Bartolini et al., 2012; Hillebrandt et al., 2013; Thibodeau et al., 2016; Percival et al., 2017; Ruhl et al., 2020). The Hg/TOC is screened by low TOC and/or Hg concentration. The positions of biostratigraphical markers are indicated next to each section. For Csővár, the biostratigraphy is from Pálfy and Dosztály (2000), Pálfy et al. (2001) and this study. For Kuhjoch, the biostratigraphy is from Hillebrandt et al. (2013). For St. Audries Bay, the biostratigraphy is from Swift (1995) and Weedon et al. (2019). For New York Canyon (Ferguson Hill), the biostratigraphy is from Guex et al. (2004), Lucas et al. (2007) and Bartolini et al. (2012). For Arroyo Alumbre, the biostratigraphy is from Riccardi (2019).
referred to as the main CIE (Hesselbo et al., 2002). It is less sharp and much longer-lived than the earlier CIEs, continuing well into the Si- nemurian (Ruhl et al., 2010b; Hüsing et al., 2014; Hesselbo et al., 2020).
The Global Stratotype Section and Point (GSSP) for the base of the Hettangian Stage is defined in the Kuhjoch section in the Northern Calcareous Alps, Austria (Hillebrandt et al., 2013). There, and in the Eiberg section, the first anomaly in organic carbon isotopes occurs in the uppermost Rhaetian and is identified as the precursor CIE (Ruhl and Kürschner, 2011), although earlier, mid and upper Rhaetian negative CIEs have also been identified there (Mette et al., 2012; Korte et al., 2017; Mette et al., 2019; Rizzi et al., 2020). A sharp and high-amplitude (~5‰) NCIE was detected at the top of the Kössen Formation, identi- fied as the initial CIE (Ruhl et al., 2009). Stratigraphically above the subsequent Schattwald beds and above the first occurrence of Psiloceras spelae, in the nearby Ochsentaljoch section, another NCIE of lower amplitude but longer duration develops that lasts up to the top of section and is identified as the main CIE (Ruhl et al., 2009; Korte et al., 2019).
The Triassic–Jurassic boundary in the terrestrial Astartekløft sec- tion, SE Greenland, is marked by a definite (~3.5‰) negative shift in the δ13Cwood record across the TJB, defined by the transition from the Lepidopteris macrofloral zone to the Thaumatopteris zone (Hesselbo et al., 2002). As δ13Cwood values remain low in the upper part of the section, this CIE was correlated with the onset of the main CIE at the base of the Hettangian, in agreement with palynostratigraphy (Mander et al., 2013). Although there is no unequivocal record of the earlier CIEs here, low data resolution and likely stratigraphic hiatuses in this fluvio- deltaic succession leave open the possibility of their presence. Im- portantly, fossil leaves collected from this section allowed for stomatal density analyses and reconstruction of atmospheric pCO2 change at this time (McElwain et al., 1999)
The Triassic–Jurassic transition at New York Canyon, Nevada, is marked by a distinct NCIE, identified as the initial CIE, stratigraphically closely following the last occurrence of Choristoceras crickmayi (Guex et al., 2004; Ward et al., 2007; Bartolini et al., 2012; Thibodeau et al., 2016). The proposed record of the main CIE here (Bartolini et al., 2012;
Thibodeau et al., 2016) is controversial for its brevity in comparison with other sections.
The carbon isotope record of the Triassic–Jurassic transition at the marine Arroyo Alumbre section (Arroyo Malo, Neuquén Basin, Argentina) is marked by a definite NCIE (~1.5‰ in amplitude within a dataset of ~2.5‰ total range), identified as the initial CIE. This is fol- lowed in the lowermost Jurassic by a greater and more prolonged ne- gative shift which can be correlated with the main CIE (Ruhl et al., 2020).
At Csővár, NCIE-3 is the most significant anomaly of the section and is identified here with the initial CIE that can be best used for global correlation as it coincides with the ETE horizon (Hesselbo et al., 2002;
Ruhl et al., 2009; Korte et al., 2019). Peak abundance of prasinophytes and spores occurs at the same stratigraphical level as NCIE-3, which indicates major and synchronous changes in marine and terrestrial ecosystems and permits stratigraphic correlation with sections with similar features (e.g. the Newark Basin (US; Olsen et al., 2002), St Audries Bay (UK; Deenen et al., 2010), the Germanic Basin (Germany and Denmark; van de Schootbrugge et al., 2009; Lindström et al., 2012), and the Sichuan Basin (China; Li et al., 2020), even when C.
thiergartii, the terrestrial auxiliary marker for the base of the Jurassic, is not observed (Götz et al., 2009; Hillebrandt et al., 2013; Lindström et al., 2017). Based on its shape and position below the initial CIE, NCIE- 2 in the Vár-hegy section and the correlative NCIE from the Pokol-völgy quarry (Korte and Kozur, 2011) may be tentatively identified as the precursor CIE (Ruhl and Kürschner, 2011). However, considering that the total thickness of the Rhaetian at Csővár exceeds 80 m (Karádi et al., 2019), this correlation is uncertain, as NCIE-2 at Csővár may be stra- tigraphically higher than the precursor CIE in other sections. The main
CIE, as identified at St Audrie’s Bay (Hesselbo et al., 2002), with a negative shift followed by a period that is characterized by rather large oscillations with Milankovitch frequencies, cannot be observed at Csővár with any certainty as opposed to other TJB sections. However, as there appears to be regional variability in significance and duration of the main CIE (Hesselbo et al., 2002; Guex et al., 2004; Ruhl et al., 2009; Ruhl et al., 2010a; Lindström et al., 2012; Hüsing et al., 2014;
Thibodeau et al., 2016; Lindström et al., 2017; Percival et al., 2017; Xu et al., 2017; Hesselbo et al., 2020; Storm et al., 2020), there is a pos- sibility that NCIE-5 is the main CIE at Csővár.
6.4. Mercury anomalies at Csővár and their correlation with other TJB sections
Generally low sedimentary Hg concentrations observed in the up- permost Triassic (the first 18 m) of the studied Csővár section are in- terpreted as showing a pre-volcanic background signal. Upsection, a major enrichment in sedimentary Hg coincides with the NCIE-3 and is followed by five smaller but distinct enrichments (Fig. 4). The increase in sedimentary Hg concentrations starts simultaneously with the onset of the initial CIE (or NCIE-3) and reaches a maximum value of > 970 ppb, 1 m above the onset. Four of the successive minor Hg peaks, all with values > 90 ppb, occur stratigraphically near smaller negative shifts in the δ13Ccarb data. Due to the overall very low TOC values in the section (see Appendix Table A.1.), the Hg/TOC normalization estab- lished and recommended in numerous similar studies cannot be applied at Csővár as it would lead to false Hg/TOC peaks due to the relatively large % analytical error on low TOC sample measurements (Sanei et al., 2012; Grasby et al., 2019 and references therein). Given the observed extreme variations in sedimentary Hg-concentrations, it appears that in the Csővár succession organic matter enrichment is not the controlling factor on sedimentary Hg values across the Triassic–Jurassic transition.
As additional controlling factors, detrital input and sulphide segrega- tion have also been proposed (Grasby et al., 2019; Shen et al., 2019b, 2020). We obtained new elemental geochemical data through XRF analysis (see Appendix A.5.). Neither the Al nor the S data allow their use for normalization due to their overall low concentration that often remains below detection limit and resulted in an incomplete dataset.
However, Fe data is obtained for all samples, and since Fe-sulphides constitute the most common sulphide minerals, and Fe concentration may increase through detrital input, we employed Hg/Fe normalization (see Appendix Table A.1.). As the Hg concentration curve is parallel with the Hg/Fe curve (Fig. 4), it appears that neither sulphide pre- cipitation, nor detrital input govern the change in the sedimentary Hg concentration. Furthermore, the studied succession is not marked by major lithological changes, nor do changes in sedimentary Hg con- centrations correlate with variations in microfacies-type, suggesting that lithology is of no apparent control on the sedimentary Hg-signal (see Fig. 5).
Geographically near (e.g. at Kuhjoch, Eiberg Basin, Austria (Percival et al., 2017)) as well as far away (e.g. at Ferguson Hill/ NewYork Canyon, Nevada, USA (Thibodeau et al., 2016) or Arroyo Alumbre, Argentina (Ruhl et al., 2020)), sedimentary archives show a similar Hg signal across the Triassic–Jurassic transition compared to Csővár, with a major spike in sedimentary Hg during or stratigraphically close to the initial CIE and followed by subsequent, smaller peaks in sedimentary Hg abundance (Fig. 7).
Compared to other TJB sections, Csővár stands out for its sig- nificantly higher Hg concentration peak, with values of up to 972 ppb (where sedimentary Hg concentrations at Kuhjoch peak at 555 ppb and in the Rødby-1 core peak at 550 ppb (Percival et al., 2017; Lindström et al., 2019). Some TJB sections, however, show only very limited se- dimentary Hg concentrations or signals that appear stratigraphically different to what is observed here. This has also been observed for other time-intervals marked by large igneous province volcanism, such as during the Toarcian Oceanic Anoxic Event, the Cretaceous-Paleogene
event and at the Paleocene–Eocene Thermal Maximum (Percival et al., 2018; Jones et al., 2019) and it may largely be due to local and regional processes impacting on the shuttling of Hg from the atmosphere/ocean into the sedimentary depositional environment.
Despite regional differences in Hg deposition, the stratigraphical onset of enriched sedimentary Hg concentrations in geographically widespread locations appears to coincide with elevated atmospheric pCO2 and a major carbon cycle perturbation, as represented by the in- itial CIE, and the onset of extrusive volcanism associated with CAMP emplacement (Percival et al., 2017).
The combined effect of the elevated temperature and the release of CO2 and other gases and toxic metals likely contributed to the syn- chronous mass extinction (McElwain and Chaloner, 1995; McElwain et al., 1999; Ward et al., 2001; Pálfy et al., 2002; Steinthorsdottir et al., 2011; Bond and Grasby, 2017; Lindström et al., 2019; Li et al., 2020).
6.5. Causes of NCIEs and Hg anomalies
The generally low Hg values in the lower part of the section (0–17 m) is interpreted as representing a pre-CAMP background signal, which corresponds well with data from sedimentary records that formed during the emplacement of other LIPs (e.g. Grasby et al., 2015, 2019;
Wang et al., 2019). On the δ13C curve of this interval, NCIE-2 may be identified as the precursor CIE. This stratigraphic interval is character- ized by the two negative CIEs of which NCIE-2 is the more prominent one (Fig. 4). Previous studies recorded negative CIEs, preceding the end-Triassic mass extinction and commonly termed precursor CIEs, and suggested these to reflect global carbon-cycle perturbations preceding the onset of the main CAMP emplacement (Ruhl and Kürschner, 2011;
Mette et al., 2012, 2019; Blumenberg et al., 2016; Korte et al., 2017;
Fujisaki et al., 2018). Although the geological significance of the pre- cursor CIE is debated, the most commonly proposed hypothesis posits that the NCIE is the result of the release of isotopically light CO2 from contact metamorphism of organic-rich sediments during the intrusive phase of the CAMP activity (Davies et al., 2017; Heimdal et al., 2018).
Sedimentary Hg concentrations are low throughout the lower part of the succession, with only a minor increase of up to 70 ppb at ~6m (Fig. 7), which stratigraphically predates NCIE-2 (the precursor CIE) by
~4 m (Figs. 4 and 7). This data suggests that early CAMP intrusives, which are suggested to have been responsible for carbon release and associated carbon-cycle perturbations predating the main phase of
CAMP basalt emplacement, may have been accompanied by significant Hg release into the global ocean-atmosphere system, although the ratio between carbon and Hg degassing from sill intruded subsurface or- ganic-rich shales may have varied over time (Heimdal et al., 2018, 2019; Ruhl et al., 2020).
In the biostratigraphically identified TJB transition interval, the most significant carbon isotope anomaly, NCIE-3, likely represents the initial CIE associated with the end-Triassic mass extinction. This major negative CIE is suggested to have resulted from CAMP basalt degassing, and possibly accompanied by ocean-floor methane hydrate dissociation (Ruhl et al., 2011; Capriolo et al., 2020), suggesting synchrony of paroxysmal volcanism and rapid global warming. The NCIE-3 in the Csővár record, identified as the initial CIE, is parallel with a major in- crease in sedimentary Hg concentrations, of up to 1000 ppb (Fig. 7).
The simultaneous occurrence of the carbon isotope and Hg-anomaly is broadly in agreement with other TJB sections globally (Thibodeau et al., 2016; Percival et al., 2017; Lindström et al., 2019; Ruhl et al., 2020). The Hg-record from Csővár supports the scenario that the onset of a more explosive phase of CAMP volcanism may have injected Hg into the stratosphere, thereby allowing its global distribution (Thibodeau et al., 2016; Percival et al., 2017; Lindström et al., 2019;
Ruhl et al., 2020).
Following the initial peak in Hg concentrations, the sedimentary Hg levels remained high compared to pre-volcanic background, with sig- nificant subsequent peaks in sedimentary Hg concentrations occurring throughout the Hettangian part of the succession. These subsequent Hg peaks may suggest episodic release of Hg, and CO2, during later phases of CAMP volcanism (Percival et al., 2017; Lindström et al., 2019).
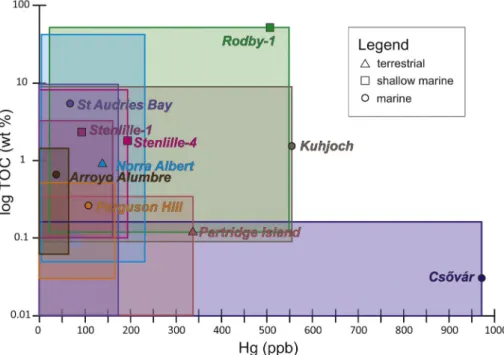
6.6. Possible causes and significance of high Hg concentration at Csővár Low TOC values throughout the carbonate succession at Csővár suggest that changes in TOC cannot be a significant factor in the major fluctuations in Hg concentrations throughout the section. Furthermore, a global comparison of ranges in maximum sedimentary Hg con- centrations and corresponding TOC values across the end-Triassic mass extinction and Triassic–Jurassic transition does not reveal any mean- ingful correlation between maximum TOC and sedimentary Hg con- centrations (Fig. 8). The Hg-record at Csővár also appears unrelated to minor lithological changes, as reflected by variations in microfacies- type (see Fig. 5).
Fig. 8. The range of TOC and sedimentary Hg con- centrations in different Triassic-Jurassic boundary successions; shown are the maximum Hg values co- inciding with, or stratigraphically close to the initial CIE. Data from Pálfy et al. (2001), Thibodeau et al.
(2016), Percival et al. (2017), Lindström et al.
(2019), Ruhl et al. (2020) and this study.
The peak in sedimentary Hg coincident with the initial CIE (NCIE-3) at Csővár, exceeds all previously reported values for this stratigraphic interval in other TJB sections, and it appears unusually high, even though not entirely unprecedented, compared to sedimentary records of other global change events (Percival et al., 2018; Grasby et al., 2019).
One possible explanation for the high peak in sedimentary Hg con- centrations at Csővár lies in the pulsatory nature of CAMP volcanism (Marzoli et al., 2004, 2019; Deenen et al., 2010; Hachimi et al., 2011;
Blackburn et al., 2013; El Ghilani et al., 2017; Percival et al., 2017, 2018; Panfili et al., 2019; Capriolo et al., 2020) and the short residence time (0.5–1 yr) of Hg in the atmosphere (Pyle and Mather, 2003; Selin, 2009; Wang et al., 2019). With this, the detection of sedimentary Hg- enrichment may be a case of ‘hit or miss’, depending largely on whether sediment was deposited, and preserved, locally during temporally ele- vated volcanic activity and associated atmospheric Hg-fluxes. The sig- nificantly larger Hg peaks at Csővár (reaching 972.14 ppb at 19.4 m) may therefore simply represent the serendipitous discovery of sedi- mentary layers that formed during individual CAMP volcanic pulses, aided by the presumably relatively complete sedimentary record, marked by relatively high sedimentation rates, at Csővár. Alternatively, high sedimentary Hg concentrations may be explained by the presence of cryptotephra, i.e. volcanogenic material, possibly enriched in Hg, within the section. Electron probe microanalysis (EPMA) on a sample with the second highest Hg value at 18.8 m revealed a porous, volca- noclastic-like microlayer of silicified Fe-oxides with apatite and barite plates without any orientation (see Appendix A.4.). The barite plates are partly resorbed, with pore spaces also filled with barite, suggesting formation shortly after deposition. The barite contains a noticeable amount of Sr, whereas the apatite is rich in Sr and REE. The EPMA analysis of a sample from 19.4 m identified altered Fe-oxides with apatite and Mg-rich biotite (phlogopite). The alteration of biotite is further supported by the elevated level of kaolinite found in these samples by X-ray diffractometry. These minerals are associated with dispersed Ba-Sr-REE-rich volcanic material that is typical of alkaline volcanic activity. Occurrence of such minerals is in accordance with observations of Bensalah et al. (2011) who associate the early phase of CAMP with alkaline volcanism. The observed possible cryptotephra were altered by interaction with diagenetic fluids as suggested by the exceptionally low δ18O values, this layer may therefore have been further enriched in Hg by partial mobilization and redeposition from adjacent beds. However, the beds in question are texturally homo- geneous distal calcareous turbidites and micro-fissures are rare.
Therefore, the concept of fluid flow restricted to one particular bed may not be supported by sedimentological evidence (Haas and Tardy-Filácz, 2004). Additionally, Cretaceous bentonites that formed shortly before Oceanic Anoxic Event 2 (OAE2) in the Mevarick Basin of central Texeas (USA) have been proven to have low Hg concentrations (Scaife et al., 2017); consequently it may be unlikely that the presence of cryptote- phra caused the high Hg concentration at Csővár.
Another possible explanation for the elevated sedimentary Hg level is the change of Hg-bearing mineral phases recorded in the TJB in- terval. It is possible that the Hg-bearing phase differs in geographically close locations (Shen et al., 2020). Previous magnetostratigraphic stu- dies in the section revealed that the dominant magnetic mineral is magnetite throughout the section, except for the interval of 15–21 m, around the Triassic–Jurassic boundary. Here, a significant amount of goethite is present, which has been identified as alteration product after pyrite (Pálfy et al., 2007). Possibly, magnetite is the dominant Hg- carrying phase in the lower and upper part of the section (Dunham et al., 2003; Melamed and da Luz, 2006; Girginova et al., 2010;
Ahmaruzzaman and Gupta, 2012; Yang et al., 2014, 2017). However, in the interval of 15–21 m (including the end-Triassic mass extinction interval), the observed altered pyrite in the form of goethite may have carried additional Hg (Benoit et al., 1999; Ravichandran, 2004; Pálfy et al., 2007). Microprobe analysis showed the presence of Zn-Hg sul- phides, with a minor amount of Cd (see Appendix A.4.). After organic
matter, sulphides are the second most significant carriers of Hg into sediments (Benoit et al., 1999; Ravichandran, 2004). Methylating bacteria, present in sulphide-rich sediment, capture Hg0 from the porewater, which is evident by the correlation between the HgS0 and MeHg concentrations in sediments (Benoit et al., 1999). The sig- nificance of pyrite in the Hg system is also supported by the observation of extremely high Hg concentrations (265–1547 ppb) detected in pyrite beds and pyrite-rich black shales (Shen et al., 2019a). A Hg-pyrite correlation has commonly been associated with anoxia, which did not occur at Csővár. However, under oxic/suboxic conditions Hg-release is possible from decomposed organic matter and it is taken up by sulphide phases (Shen et al., 2020). Therefore, the presence of the Hg-bearing magnetite possibly combined with sulphide-captured Hg may be con- sidered as an explanation for the extremely high Hg concentration at Csővár. However, the lack of Fe-peaks at the Triassic–Jurassic transition at Csővár suggests no major changes in Fe-bearing minerals, thus also questioning whether sedimentary pyrite, or any sulphide, concentra- tions thoroughly explain the observed Hg-record.
7. Conclusions
New high-resolution δ13Ccarb data from the TJB section at Csővár builds on previously published data, showing six successive NCIEs of up to ~6‰ at the end-Triassic mass extinction interval. The uppermost Triassic NCIE-3, associated with the end-Triassic mass extinction, re- presents the most prominent and well-defined minimum in the section and provides a robust correlation with the initial CIE in other sections globally. The existence of a prolonged main NCIE, observed elsewhere, is not obvious in the Csővár section. The largest ~6‰ NCIE, associated with the end-Triassic mass extinction in the Csővár section likely re- presents a significant perturbation of the end-Triassic carbon cycle, resulting from CAMP volcanic degassing, possibly combined with, episodically released 12C-enriched methane derived from gas hydrate dissociation and/or contact metamorphism.
Mercury analyses at Csővár shows that this proxy can reliably be used to study global Hg-fluxes and the evolution of the global Hg-cycle in homogeneous, organic-lean limestone successions. Here, TOC values are commonly too low to use for Hg normalization. The consistently low organic content excludes the possibility that changes in organic matter sequestration significantly controlled the observed stratigraphic changes in sedimentary Hg concentrations.
The Hg-record from Csővár presented here, spanning the upper Rhaetian to mid-upper Hettangian, shows relatively low pre-volcanic background values in the lower part of the succession. This is followed by a significant rise in sedimentary Hg near the initial CIE, similarly to other TJB sections. Sedimentary Hg values do not return to the back- ground but remain elevated with occasional spikes, throughout most of the Hettangian in the studied succession.
The major Hg anomaly at the end-Triassic negative CIE is inter- preted as the onset of the extrusive phase of CAMP activity, im- mediately following intrusive magmatic activity. Mercury levels are already enriched, albeit generally low, before the end-Triassic mass extinction interval, suggesting that early phases of intrusive magmatic activity associated with CAMP may have had some impact on Hg-fluxes into the atmosphere. Subsequent Hg spikes, following the end-Triassic mass extinction interval are smaller in magnitude but support a pul- satory nature of CAMP volcanism, possibly leading to prolonged stressed environments following the extinction event.
Significantly elevated sedimentary Hg concentrations at the end- Triassic mass extinction interval at Csővár are higher than at any other TJB succession, but comparable in magnitude to Hg anomalies at other global change events. The elevated Hg level may be because (1) the sampled succession was characterized by sedimentation and sediment preservation synchronous with a major eruption, thus immediately capturing the elevated Hg-fluxes into the atmosphere, (2) the pre- servation of cryptotephra, observed through electron microprobe