Bereczk Ádám
University of Miskolc
3900 Szerencs, Rákóczi út 116. HUNGARY phone: +36304401080
mail: bereczkadam@gmail.com
COMPARATIVE ANALYSIS IN THE FIELD OF HUNGARIAN MANUFACTURING
„The described work was carried out as part of the TÁMOP- 4.2.2/B-10/1-2010-0008 project in the framework of the New Hungarian Development Plan. The realization of this project is
supported by the European Union, co-financed by the European Social Fund.”
COMPARATIVE ANALYSIS IN THE FIELD OF HUNGARIAN MANUFACTURING
ABSTRACT
The main goal of the present study is to provide a comparative analysis between the characteristics of tier one and lower level enterprises (SME’s) in the field of automotive industry and manufacturing. While many of Hungarian SME’s were eliminated by the crisis, those companies have strong relations with production networks (like TIER-1, TIER-2 automotive production companies) in many cases perform still pretty well. The comparison was done based on circulation indicators, capital intensity, and net circulating capital. There is a significant difference between the financing time of tier one enterprises and small and medium enterprises. One of the serious problems of small and medium enterprises is that an average of 17 percent of their invested assets are from short term liabilities. This indicates a significant lack of desirable management modes and conditions of capital. This could be a reason why they were less resistant to the crisis.
key words: SME’s, current assets, financing, manufacturing, crisis
Introduction
The automotive industry is a significant branch of Hungarian manufacturing. The automotive industry is typically organized in network structures. The Hungarian ownership in the supplier chains is below what we think it desirable.
This study attempts to reveal the main differences between the integrator companies of supplier chains in automotive industry and that of smaller size enterprises at lower levels.
Integrator companies are mainly in foreign ownership and produce mainly to export.
Hungarian capital can be found dominantly at the third degree of supplier chain. The
comparative analysis concerns the above mentioned group of enterprises. I do this research in the hope that in the future more and more companies (national ownership) can step to the path of growth; stepping forward in the supplier chain.
The first part of the study demonstrates the features of the automotive industry and its place in the national manufacturing. In addition to showing the factual data it gives new information about the cost structure typical of branches. Thereafter the study shows the comparison of the management features of integrator companies and those belonging to lower supplier levels. The tier one companies can be able characterize the industry characteristics a number of cases. The suppliers of lower levels remain between the size limits of small and medium sized enterprises. On the basis of their main business activity they belong to the branch of metal raw material production and metal-working. This way the study gives an insight into the management features of small and medium sized enterprises of metallurgy industry. Moreover I also had the opportunity to compare the metallurgy enterprises supplying to the automotive industry and the general features of the metallurgy industries.
Management features of the present study is an examination of the current assets management theme. The most central categories of the calculations are: financing time, average inventory period, capital intensity and net circulating capital.
1. Basis of information
The calculations are based mainly on two data sources. The two data sources represent two different summary levels. On the one hand, the calculations concern two groups of enterprises of automotive industry (based on sampling). On the other, they concern the entirety of the national automotive industry, manufacturing and the metallurgy industry, as follows.
a) Taking samples and the related data source
I took samples from those groups of enterprises, which can be formed according to the suppliers of car factories at different levels and scales. The sampling concerned the separate groups of enterprises at and under level tier one. The sample (at this phase of the survey) contains the data of ten enterprises. It can be extended later, and based on the written details it is not representative. The calculations made on the sample serve as the
comparison between tier one level and small and medium enterprises. I used the data gained from reports published by the Company Information and Electronic Company Registration Service (Company Information Service). The year of the survey is 2009.
b) The sources and use of the industry information
I gained the data on branches and the entire manufacturing from the reports of NAV (APEH). These reports are based on database resulting from company tax returns. The NAV collects and gains data concerning all companies keeping double entry. This way, these information are suitable to authentically describe the field of economy concerned. This information basis is used for two purposes. On the one hand in the firstpart of the survey it serves information background for the chapter dealing with the description of national car production. On the other hand it serves as a comparison basis during the examination carried out on the basis of data included in the sample. The values, index numbers counted
on the single groups of enterprises related to car production can be compared with the results of calculations based on data from levels of branches and branches. The data were available from 2002 till 2009. In reasonable cases I ignore to show the data from 2008 and 2009, since the effects of the economic recession would distort the observable trends.
2. The national car production in general
The car production has set a course within the field of innovation and production
organization for the manufacturing long ago (Hudson 1994). First, the activity was organized within craftsman relations. It was followed by the fordist plant introduced in the 1910s. The era bringing process organization and standardization decided simultaneously with this was characterized by strong integration. The integration mainly concerned the field of ownership:
enterprises bought their suppliers (Turnbull-Oliver-Wilkinson, 1992). From the 1950s
changes started within the field of control by owners. Independent supplier enterprises joined the production process in such way that the high level of organization and standardization remained. A new era started in the 1980s, 1990s, which is called toyotism. Its main characteristic is that the customer strives to have long-term relationship with its suppliers.
These frameworks served as a basis for the spreading of just in time and just in sequence and the advenced quality assurance systems. The productivity of Japanese car factories increased in an incredible measure (Mészáros 2009). The suppliers operating as long-term partners became integrators, they organize the activity of the lower levels. It is also their task to supply complete partial units and parts for manufacturers which more and more deal only with assembly. Those which produce end material are usually signed with original equipment manufacturer, integrators are at tier one, their suppliers are at tier two and tier three levels. In case of national car production the Hungarian capital appears mainly at tier three level.
These enterprises produce simpler products, the level of added value is lower. However, it can have opportunities if the research and innovation stress passed by original equipment manufacturers to the enterprises in tier one would be delegated to lower levels by them.
Annex no. 1 shows the changes in aggregated net return from sales from 2002 till 2007 (at current price). Enterprises acting on the field of automotive industry have doubled the value of their net return from sales in five years. The share of the branch from the
aggregated return from sales of the manufacturing has increased from 14 percent to 17 percent. The tables deliberately ignore the years of the economic recession. If they are taken into account, it would extremely disturb clear-sightedness due to the prosperity dependency of car production. The effect of the recession on the national car production could be the subject of an independent study.
However much it is worth mentioning that the output of the branch could grow on nominal prices even despite the crisis. It's 459,5 billion HUF growth during the period
essentially kept its share in the manufacturing on the level. From calculations based on more detailed real prices it turns out that the decrease in its performance caused by the crisis was approximately the double than that of the average branch of the manufacturing. However, it showed a more dynamic growth in the years before the crisis and it can be expected in the near future as well.
In our country, the development of the automotive industry already appeared among the priorities of the Operative Program for Economic Competitiveness lasting from 2004 to 2006.
The research conducted for the groundwork of the decision surveyed seventeen branches of industry according to three points of view, and the automotive industry got into the first position from the areas qualified for development. (The points of view were global market dynamics, technological trends and comparative advantages. Kemenczei Nóra: Az Állami Támogatások Szerepe a Magyar Autóiparban, BMGE, 2009.)
Chart 1 and 2 showing the output of the national manufacturing and its branches. The automotive industry is determinant part of our industry in many aspects (Annex no. 2).
Chart 1.: Total output of the Hungarian manufacturing by branches Branch
Net income
(million HUF, on current price)
2002 2009
Production of food, drinks, tobacco products
2.144.368 2.214.637
Production of textiles, leather, footwear
410.242 244.729
Wood, paper, printing activity
729.771 721.008
Coke production, petroleum processing
932.627 1.704.364
Production of chemical products
776.974 1.325.837
Production of rubber, plastic products
469.027 747.091
Production of non-metal mineral products
364.944 473.618
Production of metal basic materials, metal processing
1.101.632 1.382.237
Production of electric machinery, tools
2.500.312 3.285.178
Production of machines, equipment
585.764 1.306.823
Vehicle production 1.628.963 2.088.372
Other manufacturing activity
145.897 352.523
Total manufacturing 11.790.521 15.846.422
Source: Calculations of the author based on the annual reports of NAV based on company tax returns
Pursuant to the average staff number the sector employed 8,6 percent of the employees.
The balance-sheet total of our enterprises represents the third highest value within the branches. On the other hand it represents approximately one seventh of the aggregated value of the manufacturing.
Chart 2.: The distribution of the output by branches.
Branch
Proportion of net income (%)
2002 2009
Production of food, drinks, tobacco products
18 14
Production of textiles, leather, footwear
3 2
Wood, paper, printing activity
6 5
Coke production, petroleum processing
8 11
Production of chemical products
7 8
Production of rubber, plastic products
4 5
Production of non-metal mineral products
3 3
Production of metal basic materials, metal
processing
9 9
Production of electric machinery, tools
21 21
Production of machines, equipment
5 8
Vehicle production 14 13
Other manufacturing activity
1 2
Source: Calculations of the author based on the annual reports of NAV based on company tax returns
The aggregated value of the tangible assets, and as well as that of the intangible assets is higher than the aggregated value of any other branch. Also automotive enterprises have reached the highest aggregated net profit. The net profit per total assets is the highest here as well. The 623 billion HUF gross added value produced by the automotive industry is 13,5 percent of the 4.606 billion HUF totally produced by the national economy section. The share of the export in the revenue is extraordinarily high (87 percent). The number of companies, however, is expressly high. The statistics classified 651 companies to the sub-branch, but
due to the problems caused by the main activity based classification the data must only be regarded as an approximate value.
The rate of material costs shows visible differences considering the individual branches.
It is more than 90 percent (91 percent) in the case of electric machinery and device industry that got extraordinary significance considering its importance in the national economy by now. In the case of enterprises that got interests in the market of textiles, leather products, footwear it does not reach the two-third of the costs (65 percent). In the area of the
automotive industry the material intensity is relatively high. The level of production, the technology, the production organization highly defines the cost structure.
From the expense structure of the automotive industry the staff costs provided a percentage lower than the average 10 percent, namely, 8 percent. The rate of material costs is about 80 percent. No obvious trends or significant changes happened in the field of
expenses (like for example the increase of material intensity and the decrease of labour intensity observed in the case of electrical machinery, instruments production). The decrease of material costs reacting to the production decline is behind the rate changes of the year 2009.
The small and medium enterprises of the automotive industry consider the problems of asset management to be one of the greatest challenges of the management, besides exceptional capital intensity. In the case of small and medium enterprises, corresponding with the requirements of flexible adaptation, one can assume a longer average inventory period. Due to their bargaining power generally one can presume longer accounts receivable collection period. On the other hand they have to redeem their suppliers in a shorter time.
This assumption was the starting point for investigations.
3. Asset management in supplier companies
My research this point dealing with financing time strengthens, also with importance of circulating capital management, but do not evidence the vulnerability of the small and medium enterprises, but point out the lack of capital is a significant problem. Considering the result contradicting the general hypothesis, I listed below (financing time chapter) the
unavoidable mistakes when calculating financing time. The most important of them is small and medium enterprises tend to sell their claims when they have been hold during a
specified period of time.
3.1. Financing time
Financing time is the result of the difference between rotation time and the accounts payable payment period (average accounts payable / recovery per day). Rotation time is to be calculated as the sum of the average inventory period (average inventory / revenue per day) and the accounts receivable collection period (average value of accounts receivable / revenue per day). I calculated the indicators in the following groups:
- tier one enterprises according to the sample,
- in the consolidated group of tier two and tier three enterprises, - and regarding the whole of the automotive industry,
- the metal industry and the manufacturing as well, thus providing basis for comparison.
The just in time system organization of production and the adaptation constraint of small and medium enterprises to the similar production philosophies points to the direction
opposite with the regularity of the average inventory and receivable increasing in theory with the revenue increase. The relatively different changes of the average inventory, receivable and accounts payable or the exceptional change of revenue would modify the rfactors significantly. The data are from the year 2009, where a slight revenue decrease (an average of 4 percent) could be observed in the tier one group. For small and medium sized
enterprises the decrease was an average 16 percent. Every one of the profitable tier one
enterprises, and only two of the small and medium enterprises suffering losses got to the sample (on the level of operating income).
The average inventory period in the case of tier one enterprises is 52 days, the accounts receivable collection period is 30 days. The rotation time resulting from the sum of the two is a total of 82 days. The accounts payable payment period is 38 days, so the financing time is an approximately one and a half months, 44 days. Compared to this the financing time of small and medium enterprises in the sample is only 5 days. The serious difference is the result of the joint effect of two factors. On one hand, the rotation time is shorter than in the case of the tier ones (66 days). In this the accounts receivable collection period is in essence the same (35 days), but here the average inventory period is also about a month (32 days). It is a significant difference compared to the 52 days index number of the tier ones. So the difference of the rotation time is caused by the longer inventory period of the tier ones. As I mentioned earlier one reason could be that small and medium enterprises tend to sell their claims to a financial affiliated firm or to third party after a certain time. The other component of the difference of the financing time is even more significant. Payable payment period for small and medium enterprises almost equivalent with the two months long rotation time. The payment period is 61 days. The reasonably short, five days financing time is primarily the result of this.
The receivables (when examination not just about trade debtors or accounts receivables) are sometimes against joint enterprises in a significant part in the case of tier one
enterprises. The total registered capital of the automotive industry is 243 billion HUF, 217 billion of this is foreign property, where the share of transactions with joint enterprises is significant.
All of the small and medium enterprises in the sample are metal industry enterprises.
An average of 47 days inventory period and 44 days accounts receivable collection period was characteristic of the national metal industry. It resulted in a rotation time of 91 days, which is almost a month longer than the one experienced at the suppliers. The payment period is 58 days; the financing time is 33 days. In the small and medium enterprises in the sample the payment period is similar, their advantage realised in the financing time is about the inventory and receivable case. This allows us to conclude that the tier one enterprises of the automotive industry count as trusted, paying customers, are relatively calculable
partners.
Figure 1. Financing time in the studied groups
Source: calculations of the author
If we examine the data of economic branches, the national automotive industry (from double entry bookkeeping companies) shows an average of 67 days rotation time resulting from 28 days inventory period and 39 days of collection period. The payment period is 38 days, so the financing time is almost a month, more precisely 29 days. This value is between the financing time regarding small and medium enterprises and tier ones calculated from the sample, closer to the 44 days number of the tier ones. (This was predictable; their larger sizes effect the development of the characteristics of the sub-branch more.) Theoretically the fewer days of inventory period usually means the more preferable production of the
enterprise. It is to be noted that the low inventory level can bring the danger of inventory deficit costs (that can be significantly high), and keeping a high(er) inventory level could be a strategic decision. The increase in the rotation speed of the inventory or the shorter collection period should result in the higher yield of the invested capital in theory (in the case of
otherwise unchanged conditions). A further advantage is that it contributes to the higher liquidity of the enterprise, since the transformation of resources into money is faster.
When publishing the results of the estimates so far one should note that there are several hidden problems, which are:
- the receivables were sold (to a financial affiliated firm or to third party);
- the inventory level is too low;
- the substitution cost significantly exceeds the value shown by the bookkeeping;
- the liquidity is dangerously low;
- the short-term liabilities are overvalued. (Soenen 2006.) 3.2. Capital intensity and net circulating capital
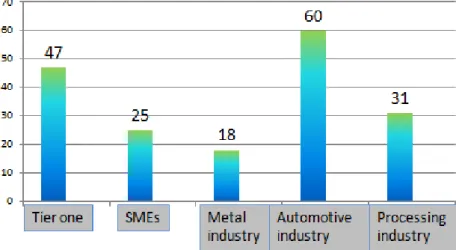
Capital intensity is measured as the quotient of some indicator of the capital stock and the average number of employee. The capital intensity was now calculated based on the sum value of assets from the balance sheet data (not an average value). The total capital stock of the tier one enterprises divided by the total number of personnel data results in an approximately 47 million HUF, so it is an average of 47 million HUF capital per employee. In the case of small and medium enterprises it is somewhat more than 25 million HUF. The result corresponds with what was expected, in the case of larger enterprises the capital stock per employee is almost the double compared to the small and medium enterprises. In the national metal industry the capital per employee is an average of 18 million HUF/employee.
In the automotive industry the number is 60 million HUF/employee, in the manufacturing 31 million HUF/employee.
Source: calculations of the author
Figure 2. Financing time differencies
Net circulating capital is the difference between current assets and short-term liabilities.
The literature is not unified in the question of the content of circulating capital. Certain authors do not differentiate between net circulating capital and circulating capital (for
example Brealey-Myers 1993, or E. Cohen 1997). On the other hand the circulating capital is often identified with the current assets, although the concept of current assets is a wider category than that. (If we study the matter considering the resource stocks operated in favor of the production.) Since the owned securities as assets do not fit into the logic built on the basis of the production process, it is not recommended to involve them when calculating circulating capital. (OTKA closing report on research activity No. K61156, 2007.)
The latter does not cause a real problem in this case; the examined enterprises do not have significant security stocks. Based on the above the net circulating capital can be
regarded the part of the current assets that are financed from long-term liabilities or from own capital by the enterprise. This way their value can even be negative, if the enterprise is forced to (or considers it necessary) to finance a certain stock of invested assets from short- term liabilities. This so-called aggressive financing strategy is present in three of the tier one enterprises from the sample. In the case of small and medium enterprises, however, six out of ten enterprises show a negative circulating capital based on year 2009 data.
Based on the summarized data of tier one enterprises the positive net circulating capital stock is around 9 percent (8,9 percent) in proportion to current assets. This group of enterprises can cover an average 9 percent of its current assets from long-term liabilities.
The circulating capital of small and medium enterprises (which is negative, even when summarized) is 34 percent in proportion to the current assets, but due to their negative value their stock should rather be compared to the invested assets. It can be stated that the
enterprises in the sample financed an average of 17 percent of their invested assets from short-term liabilities.
The aggregated data also of the metal industry, the automotive industry and also of the manufacturing show positive net circulating capital stock. In the metal industry 32 percent of the current assets, in the automotive industry 69 percent, in the manufacturing 39 percent is financed from long-term liabilities or from own capital. Besides a "healthy" picture is shown by the aggregated data, the results gained from small and medium enterprises allow us to conclude a serious capital deficit.
Figure 3. Capital intensity in the individual groups, sub-branches and in the processing industry (million HUF/employee)
Source: calculations of the author
Conclusion
The automotive industry is a branch of manufacturing that is typically organized by networks. The enterprises directly connected to the original equipment manufacturers (called tier one) supply parts, components. Their function as integrators spreads to the organization of the production of smaller enterprises, the enforcement of quality assurance and transportation requirements on lower (tier two and three) levels as well. The main goal of the present study was to provide a comparative analysis between the management characteristics of the tier one and the lower level enterprises. The
comparison was done based on circulation time indicators, capital intensity, and net circulating capital.
The automotive industry based on data aggregated in 2009 it proved to be the most profitable industrial activity, and produced the greatest gross added value amount (623 billion HUF).
There is a significant difference between the financing time of tier one enterprises and small and medium enterprises. In the case of the former the average financing time is 44 days, in the case of the latter it is 5 days. There are two sources of the difference. First, one can see a longer average inventory period in the case of tier one companies, second, small and medium enterprises could upkeep an accounts payable payment period (approximately 2 months) corresponding with the typical rotation time. In the case of tier one enterprises an average of 47 million HUF capital per employee is trait, 25 million HUF in the case of small and medium enterprises. The capital intensity of metal industry enterprises supplying the automotive industry is higher than that of the average metal industry enterprise.
The serious problems of small and medium enterprises were revealed on the financing side.
The data show a negative circulating capital asset in the case of six small and medium enterprises out of ten. As the result of this we came to the conclusion that the enterprises in the pattern financed an average of 17% of their invested assets from short-term liabilities. This indicates a significant lack of desirable management modes and conditions of capital.
References
Brealey R. and Myers S. (1993), Principles of Corporate Finance, McGraw Hill Book Company, New York.
Ecostat (2010), Vállalkozások Magyarországon 1992-2008., Ecostat, Budapest.
Hudson R. (1994), New Production Concepts, New Production Geographies? Reflections on Changes in the Automobile Industry, Royal Geographical Society, Kensington.
Illés M. (2009), Vállalati Gazdaságtan Fejezetek, Miskolci Egyetem, Miskolc.
Illés M. (2002), Vezetői Gazdaságtan, Kossuth Kiadó, Budapest.
Kemenczei N. (2009), Az Állami Támogatások Szerepe a Magyar Autóiparban, BMGE, Budapest.
Mészáros Á (2009), A Fordizmus és a Toyotizmus a Magyar Suzuki Beszállítói Rendszerében, BCE, Budapest.
NFGM (2009), Közúti Járműipari Akcióterv, NFGM, Budapest.
OTKA (2007) Closing Report on Research Activity No. K61156.
Soenen L. (2006), Advances in Corporate Finance and Asset Pricing, Emerald Group Publishing Limited, Bingley.
Figure 4. Net circulating capital in proportion to current assets
Source: calculations of the author
Annex no. 1: The output of the national manufacturing aggregated per branches
Source: Calculations of the author based on the annual reports of NAV based on company tax returns (2009) Annex no. 2: Main features of our atumotive industry in relation to data concerning the manufacturing
Source: Calculations of the author based on the annual reports of NAV based on company tax returns (2009) Branch
Net income
(million HUF, on current price)
2002 2007
Production of food, drinks, tobacco products 2.144.368 2.151.986 Production of textiles, leather, footwear 410.242 241.826
Wood, paper, printing activity 75.525 76.014
Coke production, petroleum processing 932.627 700.841
Production of chemical products 776.974 1.362.771
Production of rubber, plastic products 469.027 782.170 Production of non-metal mineral products 364.944 563.116 Production of metal basic materials, metal
processing
1.101.632 1.880.299
Production of electric machinery, tools 2.500.312 4.741.835 Production of machines, equipment 917 491 1 880 299
Vehicle production 1.628.963 3.210.870
Other manufacturing activity 145.897 231.159
Total manufacturing 11.790.521 18.854.432
Aggregated value
Automotive industry
Manufacturi
ng total Ratio
„Rank”
(from 11)
Group of activity having the highest
value / rate Number of
companies (ps) 651 35.030 0,019 10th Wood, paper, printing activity (8.089) Total assets (Bln
HUF) 2.433 17.404 0,140 3rd
Coke production, petroleum processing
(2.637) Tangible assets
(Bln HUF) 826 5.528 0,149 1st -
Intangible assets
(Bln HUF) 111 576 0,193 1st -
Export
income/income 0,87 0,58 - 2nd Production of electrical
machinery, tools (0,88)
Sum of net profit 187 -9 - 1st -
Profit 207 618 - 1st -
Loss -20 -627 - - -
Net profit/Total
assets 0,077 -0,0005 - 1st -
Gross added
value ( Bln HUF) 623 4.606 0,135 1st -
Average number of employees
(number) 55.000 639.000 0,086 5th
Production of metal basic materials, metal
processing (103) Average staff
costs (staff costs/number of employees, HUF)
2.734.000 2.087.000 1,31 3rd
Coke production, petroleum processing
(6.018.000)