Intl. Trans. in Op. Res. 00 (2019) 1–25 DOI: 10.1111/itor.12691
TRANSACTIONS IN OPERATIONAL
RESEARCH
A simulation comparison of tournament designs for the World Men’s Handball Championships
L´aszl ´o Csat ´oa,b
aLaboratory on Engineering and Management Intelligence, Research Group of Operations Research and Decision Systems/Institute for Computer Science and Control, Hungarian Academy of Sciences (MTA SZTAKI), Budapest,
Hungary
bDepartment of Operations Research and Actuarial Sciences, Corvinus University of Budapest (BCE), Budapest, Hungary E-mail: laszlo.csato@uni-corvinus.hu [Csat´o]
Received 3 July 2018; received in revised form 23 April 2019; accepted 3 June 2019
Abstract
The study aims to compare different designs for the World Men’s Handball Championships. This event, organized in every two years, has adopted four hybrid formats consisting of knockout and round-robin stages in recent decades, including a change of design between the two recent championships in 2017 and 2019. They are evaluated under two extremal seeding policies with respect to various outcome measures through Monte Carlo simulations. We find that the ability to give the first four positions to the strongest teams, as well as the expected quality and outcome uncertainty of the final, is not necessarily a monotonic function of the number of matches played: the most frugal format is the second best with respect to these outcome measures, making it a good compromise in an unavoidable trade-off. A possible error is identified in a particular design. The relative performance of the formats is independent of the seeding rules and the competitive balance of the teams. The recent reform is demonstrated to have increased the probability of winning for the top teams. Our results have useful implications for the organizers of hybrid tournaments.
Keywords:OR in sports; tournament design; simulation; handball
1. Introduction
Finding the optimal design of sports tournaments is an important question of scientific research (Szymanski, 2003). Ignoring the assignment of referees (Alarc ´on et al., 2014; Atan and H ¨useyinoˇglu, 2017)—who may be biased, for example, toward the home team (Garicano et al., 2005)—organizers and sports governing bodies have supposedly no influence on match outcomes. However, they can certainly choose other characteristics of a tournament, including the format (Scarf et al., 2009; Scarf and Yusof, 2011; Guyon, 2018), the schedule of individual matches (Ribeiro, 2012;
Atan and H ¨useyinoˇglu, 2017; Dur´an et al., 2017), the seeding policy (Guyon, 2015; Laliena and
C2019 The Authors.
International Transactions in Operational Researchpublished by John Wiley & Sons Ltd on behalf of International Federation
L ´opez, 2019), or the progression rules (Csat ´o, 2018a, 2018b, 2019b, 2019c; Dagaev and Sonin, 2018;
Vong, 2017).
The current paper considers tournament designs as probabilistic mechanisms that select high- quality alternatives (players or teams) in a noisy environment (Ryvkin, 2010). Operational research (OR) can play a prominent role here by analyzing the effects of different competition structures on particular aspects of the sporting event: given a particular metric as an objective, and respecting design constraints, it becomes possible to choose the most favorable version.
In sports involving pairwise matches, there are two fundamental tournament formats (Scarf et al., 2009). The first is theknockouttournament where matches are played in rounds such that the winners play against each other in the next round, while the losers are immediately eliminated from the tournament. The sole remaining player, the winner of the final, gets the first prize. The second basic design is theround-robintournament where every competitor plays with each other such that they earn points based on their number of wins, draws, and losses. The winner is the team with the greatest point score. All other designs can be considered as variations, such as thedouble elimination(McGarry and Schutz, 1997; Stanton and Williams, 2013), theSwiss system(Appleton, 1995; Csat ´o, 2013, 2017), and hybrids like the FIFA World Cup or the UEFA Champions League in association football.
Tournament success measures can be defined in a relatively straightforward way. On the other hand, the identification of design constraints is usually more complicated because they are rarely communicated by the administrators. The only plausible assumption seems to be that a format used in the past for a given tournament remains feasible in the future. However, this consideration does not help much when the tournament receives a modification to its structure only in parallel with a change in the number of competitors. For example, the FIFA World Cup was expanded to 24 teams in 1982, then to 32 in 1998, while the 2026 World Cup will have 48 finalist teams, but its format has remained the same for the same number of teams in these years. Similarly, the biannual European Men’s and Women’s Handball Championships started with 12 teams in 1994, and were expanded to 16 teams in 2002, but were organized according to the same structure for a given number of competitors. It means that suggesting a novel design has not much practical value unless it dominates the one applied in the real world in (almost) every respect.
In contrast, some high profile events have received a regular modification to their structure. We will analyze here a probably unique example, the IHF World Men’s Handball Championship. This event has been held in every two years since 1993 and is one of the most important and prestigious championships for men’s handball national teams along the Olympic games and the EHF European Men’s Handball Championship, as handball is most popular in the countries of continental Europe, which have won all medals but one in the World Men’s Championships. Attendance at the Cham- pionship in 2019, hosted by Denmark and Germany, was over 900,000, more than 9,000 per match.
The number of qualified teams has remained fixed at 24 since 1995, but the tournament format has changed several times over the last two decades. Between 1995 and 2001 (four events), there were group games in the preliminary round, followed by a knockout stage. This format was used again between 2013 and 2017 (three events). However, there were two subsequent group stages between 2003 and 2011 (five events), in three different variants, one of them returning in 2019. To conclude, there are four tournament structures implemented in recent years, including a change between the two recent tournaments. This indicates that the organizers experiment with finding the best design, which offers an extraordinary opportunity to compare them with the tools of OR.
It is clear that such complex designs, consisting of knockout and round-robin stages, can be analyzed only via Monte Carlo simulations. Academic literature has made several attempts to address similar problems. Scarf et al. (2009) propose a number of tournament metrics and describe how they may be evaluated for a particular design. The authors use the UEFA Champions League to illustrate their methodology. Scarf and Yusof (2011) extend this investigation by considering the effect of the seeding policy on outcome uncertainty while taking competitive balance into account.
Goossens et al. (2012) examine four league formats that have been considered by the Royal Belgian Football Association. Lasek and Gagolewski (2015) compare the recently introduced competition format for the top association football division in Poland to the standard double round-robin structure. Yusof et al. (2016) develop a system called “E-compare of Soccer Tournament Structures”
to assist decision makers in determining the fairest design for association football tournaments.
Lasek and Gagolewski (2018) examine the efficacy of league formats in ranking football teams and find that the performance of formats consisting of round-robin stages mainly depends on the total number of matches played. Dagaev and Rudyak (2019) assess a recent reform of the seeding system in the UEFA Champions League. Csat ´o (2019a) evaluates an alternative of the traditional multistage tournament design through the example of the EHF Champions League, the most prestigious men’s handball club competition in Europe.
Most of these papers use specific models for simulating match results, however, we want to avoid the use of such sophisticated assumptions to compare the tournament formats for a number of reasons. First, we follow general works on the efficacy of sports tournaments (Appleton, 1995;
McGarry and Schutz, 1997) or ranking methods (Mendonc¸a and Raghavachari, 2000), which apply this choice. Second, at least according to our knowledge, there exists no particular prediction model fitted to handball results, contrary to the variety of methods making a good prediction on the outcome of a single match between two football teams (Maher, 1982; Dixon and Coles, 1997; Koning et al., 2003). The main difficulty is probably that handball is a fast, dynamic and high-scoring game, where professional teams now typically score between 20 and 35 goals each, therefore the technical analysis of a handball match poses a serious challenge (Bilge, 2012; Grui´c et al., 2007). According to Dumangane et al. (2009), the dynamics of handball matches violate both independence and identical distribution, in some cases having a nonstationary behavior. In addition, some tournament designs analyzed here have been applied only once, so the lack of historical data prevents fitting a specific prediction model. Third, Krumer et al. (2017) prove that in round-robin tournaments among three or four symmetric contestants, there is a first-mover advantage driven by strategic effects arising from the subgame perfect equilibrium, while Krumer and Lechner (2017) give an empirical proof of this finding. Since all of our designs contain at least one group stage, even the schedule of the matches may influence the outcome of the tournament.
To summarize, the exact modeling of handball matches organized in such complicated hybrid designs seems to be beyond the current knowledge of the academic community. However, since our intention is only to compare the tournament formats, and not to estimate the chance of winning, a number of models within reason could be taken into consideration to determine the winners (Appleton, 1995). Nonetheless, this implies that all calculations are for comparative purposes only.
The main contribution and novelty of our research is the analysis of a particular—but by no means marginal—handball tournament by simulations, which has received several modifications to its format recently, indicating that the organizers are probably uncertain on its appropriate design.
While the choice of tournament format is driven by a number of factors (Szymanski, 2003; Wright,
2014), we focus on its ability to give the first four positions to the strongest teams, and on the quality and competitive balance of the championship final. Consequently, in the following, a design will be called moreefficaciousif it performs better with respect toallthese criteria, which can be conflicting, hence this definition of efficacy is not guaranteed to produce a strict ranking of all formats.
Note that our definition does not coincide with the standard meaning of efficacy, the ability of a tournament to produce accurate rankings with respect to teams’ true abilities. However, in our view, the latter approach is reasonable only in round-robin tournaments (Lasek and Gagolewski, 2018), or if the number of competitors is small (McGarry and Schutz, 1997; Mendonc¸a and Raghavachari, 2000). Now the ranking outside the top four is unreliable and almost irrelevant as all designs are centered around the semifinals, while the tournament final has a prominent role in creating media attention, so taking only the ranking ability into account is not enough if the key determinants of demand (Borland and MacDonald, 2003) are unfavorable for the most important match.
We have some surprising findings, for example, the most frugal design in the number of matches played is the second best with respect to efficacy, thus it seems to be a good compromise in the unavoidable trade-off. This is mainly caused by the smaller groups of four teams each instead of six in the first round-robin stage, a suggestion is worth further consideration. Our calculations also reveal that the recent format change of the World Men’s Handball Championship has increased the probability of winning for the top teams.
In short, the results will have useful implications for hybrid tournaments that are applied in several sports such as basketball, handball, and volleyball, some of them are presented at the end of the paper.
The paper is structured as follows. Section 2 describes the tournament designs, the metrics used for the comparison of different formats, and the simulation experiment. The results and their sensitivity analysis are detailed in Section 3. Finally, Section 4 discusses our main findings and concludes.
2. Methodology
For the comparison of different tournament designs, it is necessary to use simulations as historical data are limited because some formats were applied only once.
2.1. Tournament designs
The IHF World Men’s Handball Championships have been organized with 24 participating teams in four fundamentally different designs in recent decades. Our investigation is restricted to these tour- nament formats in order to avoid the question of whether the suggested design can be implemented in practice.
Each format contains one or two group stages. Groups are round-robin tournaments with all teams playing once against any other team in their group. In the case of two group stages, the results of the matches played in the preliminary round between teams of the same main round group are carried over to the main round (Csat ´o, 2019b).
Organizers provide a strict final ranking at the end of the tournament, meaning that usually there are some placement matches played by the teams already eliminated. We focus on the first four
Table 1
Tournament formats of the IHF World Men’s Handball Championships with 24 teams
Preliminary round Main round
Format Year(s) of application Gr. Teams Q Gr. Teams Q
KO 1995–2001, 2013–2017 4 6 4 Knockout
G64 2003 4 6 4 4 4 1
G66 2005, 2009–2011, 2019– 4 6 3 2 6 2
G46 2007 6 4 2 2 6 4
Gr.=number of groups in the preliminary and main round, respectively; Teams=number of teams in each group of the preliminary and main round, respectively; Q =number of teams qualified from each group of the preliminary and main round, respectively.
places, our stylized model contains only a third-place game played between the two losers of the semifinals, similarly to the actual tournaments. Note that there were no playoffs for the 5th–8th place in the 2013 and 2017 World Men’s Handball Championships.
In the following, the designs that have been used recently in the World Men’s Handball Champi- onships are presented. Table 1 and Figures A1–A4 provide an overview of them.
2.1.1. One group stage with six teams per group (KO)
This design, presented in Figure A1, has been used in the World Men’s Handball Championships between 1995 and 2001 as well as between 2013 and 2017. It contains one group stage with four groups of six teams each such that the top four teams qualify for the round of 16 (see Figure A1a), where a standard knockout stage starts (see Figure A1b).
2.1.2. Two group stages with six and four teams per group (G64)
This design, presented in Figure A2, has been used in the 2003 World Men’s Handball Champi- onship, hosted by Portugal. It contains two group stages (see Figure A2a). The preliminary round consists of four groups of six teams each such that the top four teams qualify for the main round.
The main round consists of four groups of four teams each such that two teams in each main round group are from the same preliminary round group, the first and the third, or the second and the fourth. Therefore, all teams play two further matches in the main round. Only the group winners of main round groups qualify for the semifinals in the knockout stage (see Figure A2b).
2.1.3. Two group stages with six and six teams per group (G66)
This design, presented in Figure A3, has been used first in the 2005 World Men’s Handball Champi- onship and has been applied in 2009, 2011, and 2019. It contains two group stages (see Figure A3a).
The preliminary round consists of four groups of six teams each such that the top three teams qualify for the main round. The main round consists of two groups of six teams, each created from two preliminary round groups. Therefore, all teams play three further matches in the main round.
The top two teams of every main round group advance to the semifinals in the knockout stage (see Figure A3b).
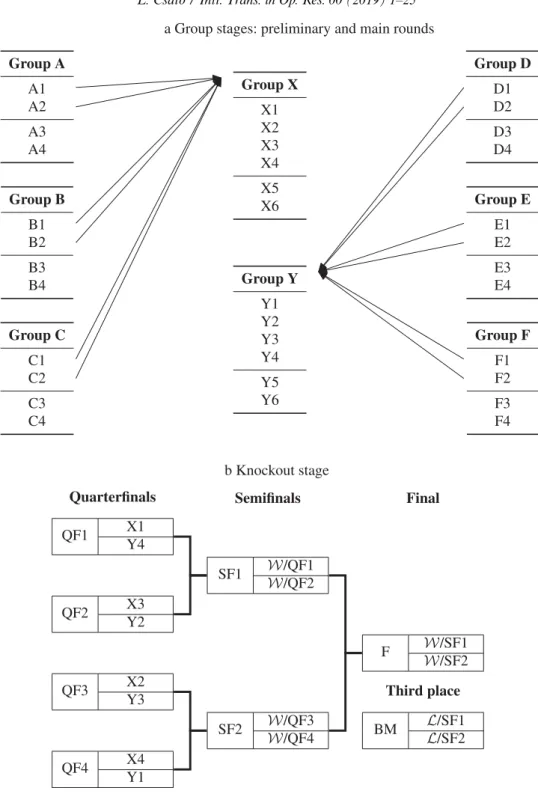
2.1.4. Two group stages with four and six teams per group (G46)
This design, presented in Figure A4, has been used in the 2007 World Men’s Handball Champi- onship, hosted by Germany. It contains two group stages (see Figure A4a). Teams are drawn into six groups of four teams each in the preliminary round such that the top two teams proceed to the main round. The main round consists of two groups, each created from three preliminary round groups. Therefore, all teams play four matches in the main round. Four teams of a main round group advance to the quarterfinals in the knockout stage (see Figure A4b).
2.1.5. Round-robin (RR)
While the 24 competitors have never played a round-robin tournament, we use this basic format as a reference.
2.1.6. Seeding policy
Seeding plays an important role in knockout tournaments (Hwang, 1982; Schwenk, 2000; Marc- hand, 2002; Groh et al., 2012; Karpov, 2016; Dagaev and Suzdaltsev, 2018; Karpov, 2018). It is not an issue in our case since the knockout stage of all formats is immediately determined by the previous group stage (see Figures A1–A4). On the other hand, all participants should be drawn into groups before the start of the tournament, and this policy may also influence the outcome (Guyon, 2015, 2018; Dagaev and Rudyak, 2019; Laliena and L ´opez, 2019).
In the recent World Men’s Handball Championships, the pots were determined on the basis of geography and other aspects such as qualification results. For example, in the 2009 tournament, Pot 1 contained the host (Croatia), the defending World Champions (Germany), the champions of Europe (Denmark), and the third-placed team of the recent European Championship (France), where Croatia and Germany were the second- and fourth-placed teams, respectively.
We consider two variants of each tournament design calledseededand unseeded. In the seeded version, the preliminary round groups are seeded such that in the case ofkgroups (k=6 for design G46 andk=4 otherwise), the strongestkteams are placed in Pot 1, the next strongestkteams in Pot 2, and so on. Unseeded version applies fully random seeding. In this case, some strong teams, allocated in a harsh group, may have more difficulty in qualifying than weaker teams allocated in an easier group, which is inefficient and can be regarded as unfair.
Naturally, there is no need to seed the teams in the reference formatRR.
2.2. Tournament metrics
Following the literature (Horen and Riezman, 1985; Scarf et al., 2009; Dagaev and Rudyak, 2019), the following tournament success measures have been chosen:
r the probability that one of the bestpteams wins the tournament;
r the probability that at least one of the bestpteams plays in the final;
r the average pretournament rank of the winner, second-, third-, and fourth-placed teams;
r the expected quality of the final (the sum of the finalists’ pretournament ranks);
r the expected competitive balance of the final (the difference between the finalists’ pretournament ranks).
24 22 20 18 16 14 12 10 8 6 4 0 2
0.2 0.4 0.6 0.8 1
Pre-tournament rank of the opponent
Team 1 Team 2 Team 7 Team 13
Fig. 1. The probability that teamibeats its opponent (baseline,α=4,β=24).
We focus only on the first four places because there was a third place game in all World Men’s Handball Championships since 1995, however, other placement matches were organized arbitrarily.
2.3. Simulation procedure
Given the design and a prediction model for match results, we are able to simulate a complete tournament repeatedly and obtain estimates of any metrics of interest.
2.3.1. Playing abilities
The probability with which a given team would beat another team is fixeda priori. We have chosen a generalized version of Jackson’s (1993) model for this purpose:
pi j = 1
1+[(i+β)/(j+β)]α, (1)
where pi j is the probability that teami defeats team j,α, β ≥0 are parameters, and 1≤i, j ≤24 is theidentifierof the teams. The model was used by Jackson (1993) and Marchand (2002) with β =0. The role of this novel parameterβis to lessen the sharp increase of winning probabilities for the strongest teams. The function ofα is similar to the original model; its smaller or larger values reflect situations where there is a smaller or larger dispersion in the teams’ strengths, respectively.
Stationarity and independence of the probability that teamibeats team jis assumed; it does not change throughout the tournament and is independent of the previous results. While in practice they are dynamic and changing probabilities are expected to alter the outcome of the tournament on a single occasion, it seems to be reasonable that stationary probabilities are good approximations of long-run averages (McGarry and Schutz, 1997).
Baseline results are obtained withα=4 andβ =24 but a robustness check will be provided for both parameters. Figure 1 shows the probabilities of beating the opponents for certain teams as
derived from formula (1). Our choice somewhat follows the idea behind Matrix I of McGarry and Schutz (1997): adjacent teams are closely matched (teamk−1 defeats teamkwith a probability of no more than 0.54), but the difference between a top team and an underdog is significant (the strongest team has greater than 90% chance to win against the last five teams).
2.3.2. Technical details
A handball game may be tied at the end of the regular playing time. If a winner has to be determined, namely, in the knockout stage of a tournament, it is followed by the first and (if it is necessary) the second overtime of 10 minutes, and the match is finally decided with penalty throws. It is a less frequent event than a draw in football, for example, in the 2017 World Men’s Handball Championship, which was organized according to formatKO, there were three draws from the 60 group matches, and one draw from the 16 matches of the knockout stage. Thus, following McGarry and Schutz (1997), draws are not allowed in the simulation. This is not to be confused with ties in the ranking of round-robin groups, resolved in our simulations with an equal-odds “coin toss.”
Every simulation has been run one million times (N=1,000,000) such that two matrices with match outcomes have been generated for each possible pair of opponents in every run because some teams may play two matches against each other (however, it is not possible before the semifinals).
After that, these outcomes have been plugged into the competition formats analyzed to study the outcome of the tournament: we have recorded the identifier of the first four teams and the teams which play the final in each run. Thus, any differences in tournament metrics are solely caused by the designs.
The validity of the simulation procedure has been tested in several ways. First, a matrix repre- senting equality among all teams (pi j =0.5 for all combinations ofiand j) has led to, as expected, an outcome where all teams are placed first to fourth equally often. Second, simulations with a fully deterministic matrix (pi j =1 ifi< j) have been analyzed. It still shows the differences between our tournament designs. For example, in the seeded versions ofG66 andG46, the four best teams are guaranteed to occupy the first four places in their natural order. However, in the seededKO andG64, the two strongest teams can meet in the semifinals with a probability of 1/3. Regarding the unseeded variants, the worst team that may qualify for the semifinals is the sixth inG46, the seventh inKO, and the 14th inG64 andG66. Finally, some values have been changed in the fully deterministic matrix in order to see whether they function in an expected way.
3. The comparison of tournament designs
In the following, our findings on the four tournament designs that have been used in the recent World Men’s Handball Championships are reviewed.
3.1. Match distribution
By looking at the tournament formats, it can be realized that two teams may play at most two times against each other, and this number could be two only if one of these matches is a semifinal, the final, or the third-place game.
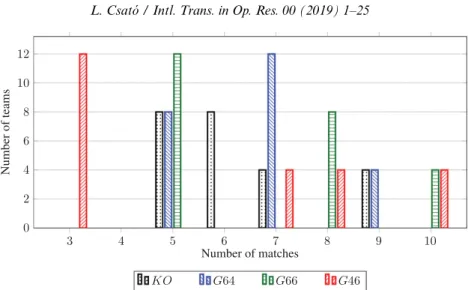
3 4 5 6 7 8 9 10 0
2 4 6 8 10 12
Number of matches
Numberofteams
KO G64 G66 G46
Fig. 2. The distribution of matches played in different tournament designs.
Each design requires different number of matches:
r A round-robin tournament with 24 teams contains 24×23/2=276 games.
r FormatKOcontains 4×6×5/2=60 games in the group stage, and 8+4+2+2=16 games in the knockout stage, that is, 76 in total.
r FormatG64 contains 4×6×5/2=60 games in the preliminary round, 4×4×2/2=16 games in the main round, and 2+2=4 games in the knockout stage, that is, 80 in total.
r FormatG66 contains 4×6×5/2=60 games in the preliminary round, 2×6×3/2=18 games in the main round, and 2+2=4 games in the knockout stage, that is, 82 in total.
r FormatG46 contains 6×4×3/2=36 games in the preliminary round, 2×6×4/2=24 games in the main round, and 4+2+2=8 games in the knockout stage, that is, 68 in total.
Besides the total number of matches, its distribution, presented in Figure 2, is also interesting.
This reports the number of teams with a given number of matches, for example, under the design KO, eight teams play five matches. InG46, half of the teams play only three matches, however, the others play at least seven. For the three remaining designs, the minimum number of games to be played by a team is five. The maximum is nine inKOandG64, while 10 inG66 andG46.
3.2. Main results
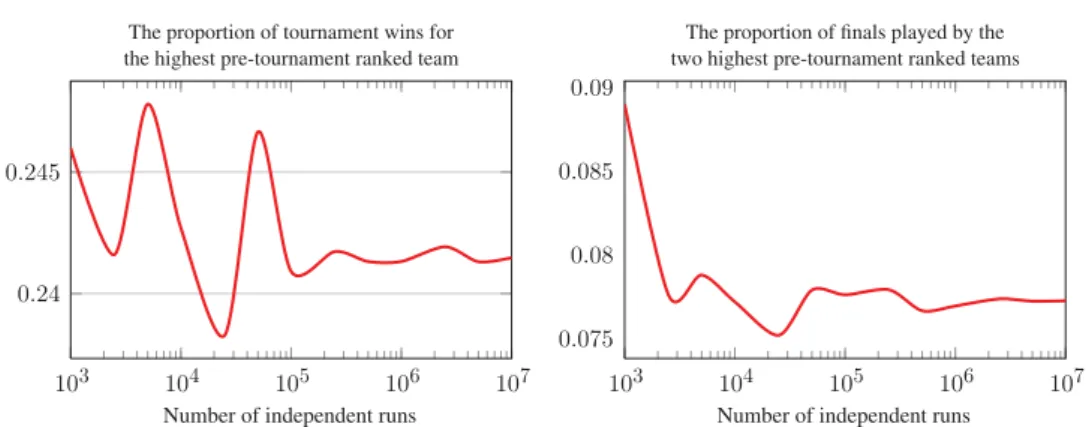
We have tested the simulations with the unseeded variant of tournament design KO for various number of independent runs (Figure 3). Since two success measures, the proportion of tournament wins for the highest ranked team and the proportion of tournament finals between the two highest ranked teams are stable after one million (106) runs, we have decided to implement all of our following simulations with one million runs.
The first tournament metric is analyzed, the probability that one of the best p teams wins the tournament is shown in Figure 4 for some tournament designs. As expected from the number of
103 104 105 106 107 0.24
0.245
Number of independent runs The proportion of tournament wins for the highest pre-tournament ranked team
103 104 105 106 107
0.075 0.08 0.085 0.09
Number of independent runs The proportion of finals played by the two highest pre-tournament ranked teams
Fig. 3. Dependence of some tournament metrics on the number of iterations. Competition design unseededKO;α=4;
β=24.
12 11 10 9 8 7 6 5 4 3 2 1 0.2 0.3 0.4 0.5 0.6 0.7 0.8 0.9 1
Value ofp
RR KO G64 G66 G46
Fig. 4. The probability that one of the bestpteamswinsthe tournament. Seeded competition designs;α=4;β=24.
matches played in each design (Section 3.1), the round-robin is the format that maximizes the probability of winning for the best teams.
Furthermore, the four designs of the World Men’s Handball Championships are almost indis- tinguishable, therefore it is worth calculating the difference between these formats compared to the referenceRR, as presented in Figure 5. This reveals that designG66 is the best from the perspective of its ability to select the strongest teams as the winner, followed byG46, whileKOandG64 perform similarly. Furthermore, seeding has not much effect, with the possible exception of formatKO: while the seeded variants of KO and G64 are almost indistinguishable, KO becomes marginally better with random seeding.
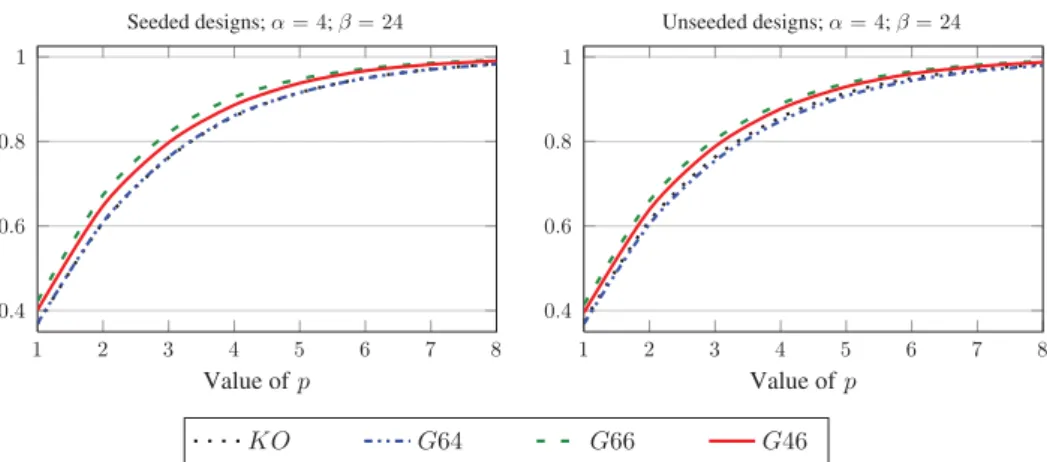
The same pattern is attested for our second tournament metric, the probability that at least one of the bestpteams plays in the final (Figure 6).
12 10 8 6 4 2
−0.2
−0.15
−0.1
−0.05 0
Value ofp Seeded designs; α = 4; β = 24
12 10 8 6 4 2
−0.2
−0.15
−0.1
−0.05 0
Value ofp
Unseeded designs; α = 4; β = 24
KO G64 G66 G46
Fig. 5. The probability difference that one of the bestpteamswinsthe tournament, compared to a round-robin tournament with 24 teams (RR).
8 7 6 5 4 3 2 1 0.4 0.6 0.8 1
Value ofp Seeded designs; α = 4; β = 24
8 7 6 5 4 3 2 1 0.4 0.6 0.8 1
Value ofp
Unseeded designs; α = 4; β = 24
KO G64 G66 G46
Fig. 6. The probability that at least one of the bestpteamsplays in the final.
The remaining outcome characteristics for the nine tournament designs are summarized in Table 2. As has already been mentioned in Section 1, a format is said to be more efficacious if the average pretournament rank of the team finishing in the pth place (p=1,2,3,4) is smaller, as well as the expected quality and the expected competitive balance of the final is lower (more favorable).
While the round-robin design shows the best performance in selecting the highest pretournament ranked teams as the winner, it requires a large number of matches, and only the other formats can be applied in practice. Among the seeded variants, G66 is the most efficacious, followed byG46, while the order ofKOandG64 remains undecided, although the former has a marginal advantage.
This order holds for all criteria of efficacy considered here, although they can be conflicting.
Eliminating the seeding procedure changes the metrics according to our expectations, for example, the unseededG66 is approximately at the same level as the seededG46, whereas the unseededG46 is still more efficacious than theKO. An interesting observation—perhaps a kind of puzzle—is that
Table 2
Estimates of some tournament metrics for all designs (baseline model)
RR KO/S KO/R G64/S G64/R G66/S G66/R G46/S G46/R
Min. games 23 5 5 5 5 5 5 3 3
Max. games 23 9 9 9 9 10 10 10 10
Total games 276 76 76 80 80 82 82 68 68
Average rank of #1 2.56 3.90 3.88 3.90 3.96 3.48 3.58 3.60 3.70
Average rank of #2 3.31 5.70 5.69 5.75 5.86 4.88 5.11 5.07 5.31
Average rank of #3 4.03 5.81 5.86 5.74 6.11 4.94 5.37 5.19 5.45
Average rank of #4 4.79 8.63 8.74 8.63 9.19 7.16 7.87 7.47 8.01
Proportion of wins for the highest ranked 0.36 0.24 0.24 0.24 0.24 0.27 0.26 0.25 0.25
Expected quality of the final — 9.60 9.57 9.65 9.82 8.35 8.69 8.68 9.01
Expected competitive balance of the final — 4.40 4.37 4.45 4.51 3.78 3.94 3.87 4.09 1 million simulations for each version;α=4;β=24. S=seeded version of the design; R=unseeded (random) version of the design.
the performance of the designKO, where the knockout stage plays the greatest role, is essentially not influenced by seeding.
The metrics of seededG64 may refer to a flaw of this format because the average pretournament ranking of the bronze medalist is not substantially greater than the average ranking of the silver medalist. The unexpected phenomenon is perhaps caused by its strange knockout stage, where only the group winners of the main round compete.
Focusing on the averages of our success measures may mask some variance behind them. For instance, the same expected pre-tournament rank of the winner can be obtained if a format gives a higher probability for the top and the bottom teams, but harm the middle teams. Therefore, Figure A5 plots the probability difference of reaching the first four places as a function of the pre-tournament rank, compared to competition design KO. For example, the probability of the strongest team winning the championship is more than 2.5% higher under formatG66 than under formatKO, a more than 10% increase.
The graph reinforces that the difference between seededKOandG64 is negligible, especially in the allocation of the first two places. On the other hand, designsG66 andG46 are preferred only by the four or five strongest teams. In addition, the lines do not converge to zero even for the weakest teams in the case of the fourth place (#4) because the presence of two well-constructed subsequent group stages is effective against the occasional emergence of underdogs in the semifinals.
It is reasonable to assume that if a given design is more efficacious than another in both its seeded and unseeded variants, then it remains more efficacious in real-life when the actual allocation of the teams into pots is somewhere between these two extreme cases.
Naturally, all results should be considered with respect to the number of games played. It is the smallest, 68 for the designG46, so its second place according to efficacy has a favorable message for the organizers: there exists no clear trade-off between efficacy and the number of matches. This is in contrast to the intuition and the conclusions of many tournament design papers. For example, the performance of soccer league formats highly depends on the total number of matches played (Lasek and Gagolewski, 2018).
The underlying reason is probably that half of the participating teams play only three games in G46, which seems to be enough to determine the competitors with the greatest chance to win the tournament. In addition, this is the only design containing quarterfinals after two group stages.
The remaining three formats are closer to each other from this point of view, all teams play at least five matches, and the total number of games is between 76 and 82. This fact also shows that G64 is a misaligned design because of the relatively high number of matches could not reduce outcome uncertainty.
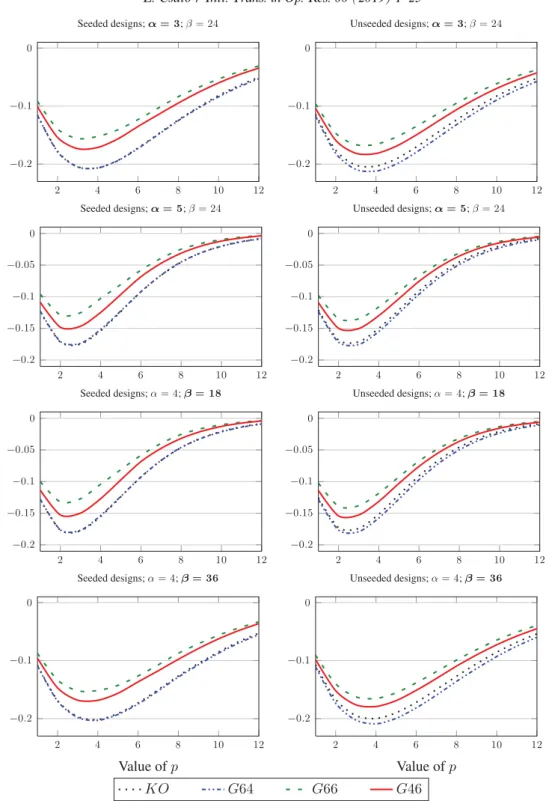
3.3. Sensitivity analysis
Following Scarf et al. (2009), the robustness of the results is addressed by calculating our metrics for more and less competitive tournaments than the baseline version. It is achieved in two ways by changing the parameterα in formula (1) from its original value of 4 to 3 (more competitive) and 5 (less competitive); and the parameter β in formula (1) from its original value of 24 to 18 (less competitive) and 36 (more competitive).
Figure A6 reproduces Figure 5 for these cases. It can be seen that the ranking of the competition designs by their ability to select the best teams as the winner remains unchanged asG66 is better than G46, which outperformsKOandG64. The seededKOandG64 formats are almost indistinguishable, but the former outperforms the latter from this point of view without seeding. The advantage of an ideal round-robin tournament becomes more significant if competitive balance is smaller, that is, the outcome of the matches is more difficult to forecast.
Figure A7 reinforces that seeding has not much influence on tournament outcomes, and, while the actual differences among the four designs are modest (at least compared to the round-robin format), they are robust with respect to the distribution of teams’ strength.
Further tournament characteristics are summarized in Tables 3 and 4. Our conclusions do not change significantly, although the unseededKOis clearly worse than its seeded variant ifα =3 or β =36 when the teams’ abilities are more similar. The final of the seededKOis more exciting with higher quality and outcome uncertainty than the final of the seededG64 in these cases as well. A possible flaw of designG64 under seeding (the average pretournament rank of the third-placed team is close to the average rank of the second-placed team) can also be observed as before.
4. Discussion
We have compared four tournament formats of recent World Men’s Handball Championships. They have been evaluated by Monte Carlo simulations under two seeding policies, namely, allocating teams perfectly into pots on the basis of their known strength and a fully random draw of groups.
Our main findings are as follows:
r KO (applied from 1995 to 2001 and between 2013 and 2017, see Section 2.1.1): It is almost insensitive to the seeding rule. While this seems to be a somewhat surprising fact because the knockout phase plays the greatest role in this format, Marchand (2002) provides evidence that the outcome of the standard and random knockout tournaments may not vary as much as one might expect.
Table 3
Sensitivity analysis for parameterα– Estimates of some tournament metrics
RR KO/S KO/R G64/S G64/R G66/S G66/R G46/S G46/R
aα=3;β=24 (more competitive)
Average rank of #1 3.00 4.78 4.78 4.81 4.89 4.26 4.40 4.41 4.55
Average rank of #2 3.82 6.73 6.77 6.82 6.96 5.87 6.11 6.05 6.36
Average rank of #3 4.58 6.84 6.89 6.78 7.16 5.90 6.33 6.15 6.48
Average rank of #4 5.35 9.58 9.72 9.61 10.08 8.24 8.86 8.53 9.08
Proportion of wins for the highest ranked 0.31 0.20 0.20 0.20 0.19 0.22 0.22 0.21 0.21 Expected quality of the final — 11.51 11.55 11.63 11.86 10.13 10.51 10.46 10.91 Expected competitive balance of the final — 5.29 5.30 5.38 5.45 4.65 4.84 4.75 5.00
bα=5;β=24 (less competitive)
Average rank of #1 2.31 3.34 3.33 3.34 3.38 3.00 3.08 3.13 3.18
Average rank of #2 3.02 5.02 4.98 5.04 5.12 4.26 4.46 4.48 4.63
Average rank of #3 3.73 5.11 5.17 5.03 5.40 4.34 4.77 4.60 4.78
Average rank of #4 4.50 7.85 7.96 7.82 8.44 6.38 7.16 6.73 7.21
Proportion of wins for the highest ranked 0.40 0.28 0.28 0.28 0.28 0.31 0.30 0.29 0.29
Expected quality of the final — 8.36 8.30 8.38 8.50 7.27 7.55 7.61 7.81
Expected competitive balance of the final — 3.80 3.75 3.82 3.86 3.22 3.37 3.35 3.49 1 million simulations for each version. S=seeded version of the design; R=unseeded (random) version of the design.
Table 4
Sensitivity analysis for parameterβ: Estimates of some tournament metrics
RR KO/S KO/R G64/S G64/R G66/S G66/R G46/S G46/R
aα=4;β=18(less competitive)
Average rank of #1 2.27 3.33 3.31 3.32 3.36 2.98 3.06 3.11 3.16
Average rank of #2 2.99 5.05 5.01 5.07 5.17 4.27 4.48 4.48 4.66
Average rank of #3 3.72 5.15 5.21 5.07 5.44 4.36 4.79 4.61 4.82
Average rank of #4 4.51 7.95 8.07 7.93 8.57 6.45 7.26 6.82 7.30
Proportion of wins for the highest ranked 0.41 0.28 0.29 0.28 0.28 0.31 0.31 0.30 0.30
Expected quality of the final — 8.37 8.32 8.40 8.53 7.25 7.54 7.59 7.82
Expected competitive balance of the final — 3.84 3.80 3.87 3.92 3.24 3.40 3.37 3.52 bα=4;β=36(more competitive)
Average rank of #1 3.13 4.90 4.91 4.94 5.02 4.41 4.54 4.54 4.69
Average rank of #2 3.94 6.82 6.85 6.90 7.04 5.96 6.21 6.14 6.45
Average rank of #3 4.68 6.92 6.97 6.86 7.21 5.99 6.40 6.23 6.56
Average rank of #4 5.42 9.59 9.72 9.62 10.07 8.27 8.88 8.55 9.09
Proportion of wins for the highest ranked 0.30 0.19 0.19 0.19 0.19 0.21 0.21 0.20 0.20 Expected quality of the final — 11.72 11.76 11.84 12.06 10.37 10.75 10.68 11.14 Expected competitive balance of the final — 5.34 5.34 5.42 5.49 4.72 4.89 4.80 5.06 1 million simulations for each version. S=seeded version of the design; R=unseeded (random) version of the design.
r G64 (applied in 2003, see Section 2.1.2): It turns out to be a questionable design because of its weak ability to select the best teams despite the relatively high number of matches, and the average pretournament rank of the third-placed team is not substantially higher than the average pretournament rank of the second-placed team in the seeded variant.
r G66 (the actual design in 2019, applied in 2005, 2009, and 2011, see Section 2.1.3): It maximizes the association between teams’ strength and final position, partially due to the highest number of matches played among the designs considered.
r G46 (applied in 2007, see Section 2.1.4): It means a good compromise between efficacy and compactness as the only format with better performance (G66) requires a 20% increase in the number of matches.
Our analysis clearly shows that no single best tournament design exists. For example, formatG46 allows only three matches for certain teams before they are eliminated, which may be regarded as the price for an appropriate selection of top teams. On the other hand, format KO is insensitive to the drawing of groups, therefore this competition structure minimizes randomness in a sense by being independent of the seeding policy. In short, we can agree with Scarf et al. (2009) that one cannot come up with a unique definition of fairness that all would accept.
Nonetheless, the current paper has an important message for the governing bodies of major sports: the obvious conclusion from the intuition and the principle of statistics that a bigger sample lead to better estimates does not necessarily hold in the case of such complex hybrid tournament designs as the comparison of formatsG64 andG46 reveals.
Naturally, all results are based on a particular probabilistic model, which implies certain lim- itations. However, we have made great effort to minimize this sensitivity by studying a variety of robustness check, and it seems that a wide range of model assumptions are appropriate for comparative purposes (Appleton, 1995).
These competition designs have also been used in other team tournaments with 24 participants.
The IHF World Women’s Handball Championship is organized in every two years since 1993, and has 24 teams since 1997. Its format has followed the World Men’s Handball Championship taken place in the same year, except for 2003—when women handball teams competed under design G66, while men played in formatG64, thus no women tournament was organized accord- ing to this dubious design—and for 2011—when women national teams competed under design KO, while men played in format G66. Similarly to the Men’s Championship, the next Women’s Championship to be held in 2019, hosted by Japan, will also use the format G66 instead of KO (IHF, 2018).
In basketball, the 2006 and the 2010 FIBA World Championships as well as the 2014 FIBA Basketball World Cup (the tournament previously known as the FIBA World Championship), the EuroBasket 2015, and the EuroBasket 2017 applied the design KO. FormatG66 was used in the 1986 FIBA World Championship, while the EuroBasket 2011 and the EuroBasket 2013 appliedG66 with a slight modification that four teams advanced from each of the two main round groups to the quarterfinals (instead of only two to the semifinals). Finally, the 1978 and 1982 FIVB Volleyball Men’s World Championships were organized in a structure similar to G46, but only the two top teams from the two main round groups qualified for the semifinals, while in handball, the second group stage was followed by the quarterfinals (see Figure A4). In the view of our computations, perhaps it is not a coincidence that no further use of the strange design G64 has been found in practice.
Organizers of team championships are encouraged to consider our results when deciding on the design of future tournaments. For example, the recent change of the World Men’s Handball Championship format (from KO to G66 between 2017 and 2019) has increased the probability
of winning for the best teams as revealed by Figure A5. The choice of tournament design is an especially important issue because it offers perhaps the only way to influence the expected value of certain success measures for sports administrators.
There is a great scope for future research. First, one can implement a more extensive sensitivity analysis. Second, as discussed in Section 1, our simulation is not based on data from real tournaments since it is far from trivial to model handball matches. Third, other tournament designs or simple modifications of the formats analyzed here (recall that a slightly modified variant of structure G46 was used in volleyball) can be investigated with the presented methodology. Finally, further properties of the competition formats are worth examining. For example, it is almost obvious to check that designKOsatisfies strategy proofness, while formatsG64,G66, andG46 are incentive incompatible (Csat ´o, 2019b).
Acknowledgments
This paper could not have been written without my father, who coded the simulations in Python mainly during a Christmas break. We are grateful to Tam´as Halm for reading the manuscript.
Four anonymous reviewers provided valuable comments and suggestions on earlier drafts. We are indebted to the Wikipedia community for contributing to our research by collecting and structuring some information used in the paper. The research was supported by OTKA grant K 111797 and by the MTA Premium Postdoctoral Research Program.
References
Alarc ´on, F., Dur´an, G., Guajardo, M., 2014. Referee assignment in the Chilean football league using integer programming and patterns.International Transactions in Operational Research21, 3, 415–438.
Appleton, D.R., 1995. May the best man win?Journal of the Royal Statistical Society: Series D (The Statistician)44, 4, 529–538.
Atan, T., H ¨useyinoˇglu, O.P., 2017. Simultaneous scheduling of football games and referees using Turkish league data.
International Transactions in Operational Research24, 3, 465–484.
Bilge, M., 2012. Game analysis of Olympic, World and European Championships in men’s handball.Journal of Human Kinetics35, 1, 109–118.
Borland, J., MacDonald, R., 2003. Demand for sport.Oxford Review of Economic Policy19, 4, 478–502.
Csat ´o, L., 2013. Ranking by pairwise comparisons for Swiss-system tournaments.Central European Journal of Operations Research21, 4, 783–803.
Csat ´o, L., 2017. On the ranking of a Swiss system chess team tournament.Annals of Operations Research254, 1–2, 17–36.
Csat ´o, L., 2018a. Incentive compatible designs for tournament qualifiers with round-robin groups and repechage.
Preprint. arXiv:1804.04422.
Csat ´o, L., 2018b. Was Zidane honest or well-informed? How UEFA barely avoided a serious scandal.Economics Bulletin 38, 1, 152–158.
Csat ´o, L., 2019a. How to design a tournament: lessons from the men’s handball Champions League. Preprint.
arXiv:1811.11850.
Csat ´o, L., 2019b. Overcoming the incentive incompatibility of tournaments with multiple group stages. Preprint.
arXiv:1712.04183.
Csat ´o, L., 2019c. UEFA Champions League entry has not satisfied strategy-proofness in three seasons.Journal of Sports Economics. https://doi.org/10.1177/1527002519833091.
Dagaev, D., Rudyak, V., 2019. Seeding the UEFA Champions League participants: evaluation of the reform.Journal of Quantitative Analysis in Sports15, 2, 129–140.
Dagaev, D., Sonin, K., 2018. Winning by losing: incentive incompatibility in multiple qualifiers. Journal of Sports Economics19, 8, 1122–1146.
Dagaev, D., Suzdaltsev, A., 2018. Competitive intensity and quality maximizing seedings in knock-out tournaments.
Journal of Combinatorial Optimization35, 1, 170–188.
Dixon, M.J., Coles, S.G., 1997. Modelling association football scores and inefficiencies in the football betting market.
Journal of the Royal Statistical Society: Series C (Applied Statistics)46, 2, 265–280.
Dumangane, M., Rosati, N., Volossovitch, A., 2009. Departure from independence and stationarity in a handball match.
Journal of Applied Statistics36, 7, 723–741.
Dur´an, G., Guajardo, M., Saur´e, D., 2017. Scheduling the South American Qualifiers to the 2018 FIFA World Cup by integer programming.European Journal of Operational Research262, 3, 1109–1115.
Garicano, L., Palacios-Huerta, I., Prendergast, C., 2005. Favoritism under social pressure. Review of Economics and Statistics87, 2, 208–216.
Goossens, D.R., Beli¨en, J., Spieksma, F.C.R., 2012. Comparing league formats with respect to match importance in Belgian football.Annals of Operations Research194, 1, 223–240.
Groh, C., Moldovanu, B., Sela, A., Sunde, U., 2012. Optimal seedings in elimination tournaments.Economic Theory49, 1, 59–80.
Grui´c, I., Vuleta, D., Milanovi´c, D., 2007. Performance indicators of teams at the 2003 Men’s World Handball Champi- onship in Portugal.Kinesiology: International Journal of Fundamental and Applied Kinesiology38, 2, 164–175.
Guyon, J., 2015. Rethinking the FIFA World CupTMfinal draw.Journal of Quantitative Analysis in Sports11, 3, 169–
182.
Guyon, J., 2018. What a fairer 24 team UEFA Euro could look like.Journal of Sports Analytics4, 4, 297–317.
Horen, J., Riezman, R., 1985. Comparing draws for single elimination tournaments.Operations Research33, 2, 249–262.
Hwang, F.K., 1982. New concepts in seeding knockout tournaments.The American Mathematical Monthly89, 4, 235–239.
IHF, 2018. Regulations for IHF competitions. International Handball Federation, Basel, Switzerland. http://ihf.info/
files/Uploads/NewsAttachments/0_Regulations%20for%20IHF%20Competitions_GB.pdf.
Jackson, D.A., 1993. Independent trials are a model for disaster.Applied Statistics42, 1, 211–220.
Karpov, A., 2016. A new knockout tournament seeding method and its axiomatic justification.Operations Research Letters44, 6, 706–711.
Karpov, A., 2018. Generalized knockout tournament seedings.International Journal of Computer Science in Sport17, 2, 113–127.
Koning, R.H., Koolhaas, M., Renes, G., Ridder, G., 2003. A simulation model for football championships.European Journal of Operational Research148, 2, 268–276.
Krumer, A., Lechner, M., 2017. First in first win: evidence on schedule effects in round-robin tournaments in mega-events.
European Economic Review100, 412–427.
Krumer, A., Megidish, R., Sela, A., 2017. First-mover advantage in round-robin tournaments.Social Choice and Welfare 48, 3, 633–658.
Laliena, P., L ´opez, F.J., 2019. Fair draws for group rounds in sport tournaments.International Transactions in Operational Research26, 2, 439–457.
Lasek, J., Gagolewski, M., 2018. The efficacy of league formats in ranking teams.Statistical Modelling18, 5–6, 411–435.
Lasek, J., Gagolewski, M., 2015. Predictive efficacy of a new association football league format in Polish Ekstraklasa.
Proceedings of Machine Learning and Data Mining for Sports Analytics Workshop at ECML/PPKD, Dublin, Ireland.
Maher, M.J., 1982. Modelling association football scores.Statistica Neerlandica36, 3, 109–118.
Marchand, ´E., 2002. On the comparison between standard and random knockout tournaments.Journal of the Royal Statistical Society: Series D (The Statistician)51, 2, 169–178.
McGarry, T., Schutz, R.W., 1997. Efficacy of traditional sport tournament structures.Journal of the Operational Research Society48, 1, 65–74.
Mendonc¸a, D., Raghavachari, M., 2000. Comparing the efficacy of ranking methods for multiple round-robin tourna- ments.European Journal of Operational Research123, 3, 593–605.
Ribeiro, C.C., 2012. Sports scheduling: problems and applications.International Transactions in Operational Research19, 1–2, 201–226.
Ryvkin, D., 2010. The selection efficiency of tournaments.European Journal of Operational Research206, 3, 667–675.
Scarf, P.A., Yusof, M.M., 2011. A numerical study of tournament structure and seeding policy for the soccer World Cup Finals.Statistica Neerlandica65, 1, 43–57.
Scarf, P.A., Yusof, M.M., Bilbao, M., 2009. A numerical study of designs for sporting contests.European Journal of Operational Research198, 1, 190–198.
Schwenk, A.J., 2000. What is the correct way to seed a knockout tournament?The American Mathematical Monthly107, 2, 140–150.
Stanton, I., Williams, V.V., 2013. The structure, efficacy, and manipulation of double-elimination tournaments.Journal of Quantitative Analysis in Sports9, 4, 319–335.
Szymanski, S., 2003. The economic design of sporting contests.Journal of Economic Literature41, 4, 1137–1187.
Vong, A.I.K., 2017. Strategic manipulation in tournament games.Games and Economic Behavior102, 562–567.
Wright, M., 2014. OR analysis of sporting rules—a survey.European Journal of Operational Research232, 1, 1–8.
Yusof, M.M., Khalid, R., Sulaiman, T., Hamid, M.S.A., Mansor, R., Rosli, N.C., 2016. E-compare of soccer tournament structures.International Review of Management and Marketing6, 8S, 294–298.
Appendix
a Group stage: preliminary round
Group A A1 A2 A3 A4 A5 A6
Group B B1 B2 B3 B4 B5 B6
Group C C1 C2 C3 C4 C5 C6
Group D D1 D2 D3 D4 D5 D6
b Knockout stage
F W/SF1 W/SF2 SF1 W/QF1
W/QF2 QF1 W/R1
W/R2
R1 A1
B4
R2 C3
D2
QF2 W/R3 W/R4
R3 A3
B2
R4 C1
D4
SF2 W/QF3 W/QF4 QF3 W/R5
W/R6
R5 A4
B1
R6 C2
D3
QF4 W/R7 W/R8
R7 A2
B3
R8 C4
D1
Round of 16 Quarterfinals Semifinals Final
Third place BM L/SF1
L/SF2
Fig. A1. FormatKO, which was used in the 2017 World Men’s Handball Championship.
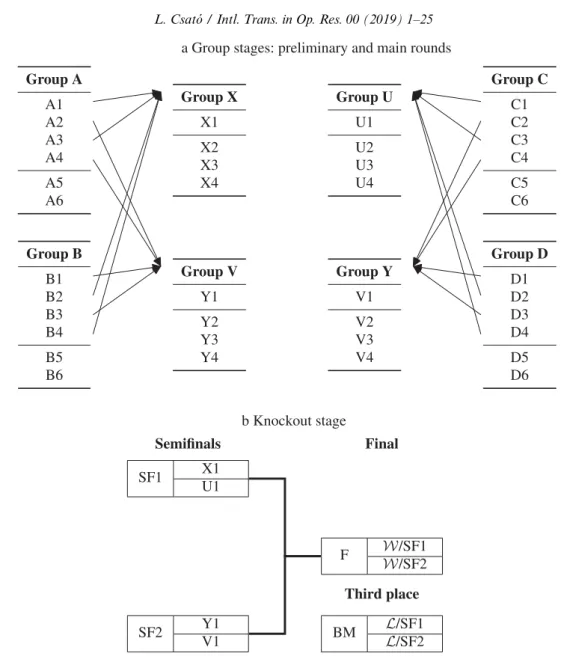
a Group stages: preliminary and main rounds
Group A A1 A2 A3 A4 A5 A6
Group B B1 B2 B3 B4 B5 B6
Group C C1 C2 C3 C4 C5 C6
Group D D1 D2 D3 D4 D5 D6 Group X
X1 X2 X3 X4
Group V Y1 Y2 Y3 Y4
Group U U1 U2 U3 U4
Group Y V1 V2 V3 V4
b Knockout stage
F W/SF1 W/SF2
SF1 X1
U1
SF2 Y1
V1
Semifinals Final
Third place BM L/SF1
L/SF2
Fig. A2. FormatG64, which was used in the 2003 World Men’s Handball Championship.
a Group stages: preliminary and main rounds
Group A A1 A2 A3 A4 A5 A6
Group B B1 B2 B3 B4 B5 B6 Group X
X1 X2 X3 X4 X5 X6
Group C C1 C2 C3 C4 C5 C6
Group D D1 D2 D3 D4 D5 D6 Group Y
Y1 Y2 Y3 Y4 Y5 Y6
b Knockout stage
F W/SF1 W/SF2
SF1 X1
Y2
SF2 X2
Y1
Semifinals Final
Third place BM L/SF1
L/SF2
Fig. A3. FormatG66, which was used in the 2011 World Men’s Handball Championship, and again in the 2019 World Men’s Handball Championship.
a Group stages: preliminary and main rounds
Group A A1 A2 A3 A4
Group B B1 B2 B3 B4
Group C C1 C2 C3 C4
Group D D1 D2 D3 D4
Group E E1 E2 E3 E4
Group F F1 F2 F3 F4 Group X
X1 X2 X3 X4 X5 X6
Group Y Y1 Y2 Y3 Y4 Y5 Y6
b Knockout stage
F W/SF1 W/SF2 SF1 W/QF1
W/QF2
QF1 X1
Y4
QF2 X3
Y2
SF2 W/QF3 W/QF4
QF3 X2
Y3
QF4 X4
Y1
Quarterfinals Semifinals Final
Third place BM L/SF1
L/SF2
Fig. A4. FormatG46, which was used in the 2007 World Men’s Handball Championship.