__________________________________________________________________________________
Investigation of activated sludge pumping through a case study
Budapest University of Technology and Economics, Faculty of Mechanical Engineering, Department of Hydrodynamic Systems
www.hds.bme.hu
1corresponding author: pcsizmadia@hds.bme.hu
Received: 11 February, 2020 Accepted:15 May, 2020
ABSTRACT
The energy consumption of the drinking water and wastewater technologies is growing, and gaps remain in the field of estimation of hydrodynamic losses. The pumping of recirculated sludge in the comprehensive activated sludge technology exposes 1.5 3% of the electric energy consumption of a wastewater treatment plant (WWT). At several technological points of the whole activated sludge process, changes in the total suspended solids (TSS) content of the activated sludge can occur. These changes cause sedimentation problems and also modify the rheological properties of the fluid. In our work, we determined the losses and performance curves of a simple hydrodynamic system carrying three different, real activated sludges based on computational fluid dynamics (CFD) calculations and literature data. We have shown that even a change in the sludge TSS content can have negative effect on the specific energy consumption of the system.
INTRODUCTION
In recent years, energy-efficient thinking has been appreciated in all areas of industry.
Water supply and wastewater
services are also of significant importance in terms of both energy consumption and environmental emissions (Longo, S. et al.
(2016); Wakeel, M. et al. (2016); Haaz, E.
et al. (2019)).
The energy consumption of the wastewater treatment (WWT) sections varies in a wide range depending on many parameters, such as the size and location of the plant, water contaminations, or the treatment process type. The WWT process consists of several sludge treatment steps with different energy requirements. In general, the primary treatment requires less energy than the other stages. The energy consumption of the secondary treatment is significantly higher and depends on technology and contamination. The tertiary treatment is even more energy-intensive step depending on the treatment standard of the given country. Based on Wakeel, M et al. (2016), the average specific energy consumption of WWT is between 0.25 to 0.67 kWh/m3. The conventional type of secondary treatment is the activated sludge process.
The specific energy consumption of the needed sludge recirculation pumps were reported to be between 0.0047 to 0.01 kWh/m3 (Longo, S. et al.), and in average of 0.011 kWh/m3 (Plappally, A.K. &
4 1.
__________________________________________________________________________________
________________________________________________________________________________
Lienhard V.J.H. (2012)). This represents 1.5 3.5% of the total electric energy consumption of the whole WWT plant (Longo, S. et al. (2016)).
For designing and operating these technologies, it is essential to examine the rheological properties of the sludge, which is known as non-Newtonian fluid. For the rheological modelling of activated sludge, the literature suggests the Ostwald (power- law), the Bingham, and the Herschel- Bulkley models (Ratkovich, N. (2013);
Seyssiecq, I., Karrabi, M. & Roche, N.
(2015)). Material properties of the fluid vary depending on the total suspended solids (TSS) (Guibaud, G. et al. (2004)), temperature, and material structure, even at several technological points of the whole activated sludge process (Baroutian, S., Eshtiaghi, N. & Gapes, D.J. (2013);
. Any adverse changes in the fluid structure may cause settling problems, and modify rheology of
the fluid as well (Bakos, V., Kiss, B. &
.
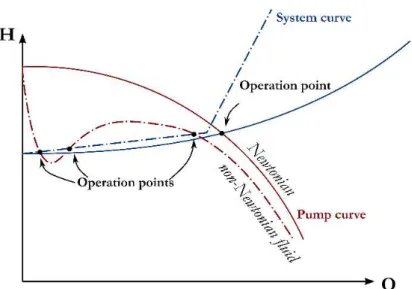
The performance curve of a pump and the characteristic curve of a pipeline system are usually plotted as the head (H [m]) as the function of the volume flow rate (Q [m3/h]).
The intersection of the two curves is the operation point. The hydrodynamic losses of the straight pipes and pipe elements depend on the rheology. In the case of a non-Newtonian fluid, the characteristic curve of a pipeline-system differs from those delivering Newtonian fluids (Chhabra, R.P. & Richardson, J.F. (2008)).
A remarkable deration of the head appears on the non-Newtonian performance pump curve at the lower range of the volume flow rate as well (Walker, C.I. & Goulas, A.
(1984)). This could indicate a second (or a third) intersection of the curves, as Fig. 1 shows based on (Graham, L.J.W. et al.
(2009)).
Fig. 1. System curve (blue lines) and performance curve of centrifugal pump (red lines) for Newtonian (solid lines) and non-Newtonian (chain lines) fluids with the
operation points, based on Graham, L.J.W. et al. (2009)
__________________________________________________________________________________
A large and growing body of literature has investigated the friction factor in straight pipes and the loss coefficients of pipe elements in the case of non-Newtonian fluids. Garcia and Steffe (Garcia, E.J., &
Steffe, J.F. (1986)), Turian et al. (Turian, R.M. et al. (1998A)), Telis-Romero, Telis and Yamashita (Telis-Romero, J., Telis, V.R.N. & Yamashita, F. (1999)), and Haldenwang et al. (Haldenwang, R. et al.
(2012)) investigated the friction losses in straight pipes. Non-Newtonian fluid through valves was presented by Pienaar et al. (Pienaar, V.G. et al. (2004)), through bends, valves, and Venturi-meters by Turian et al. (Turian, R.M. et al. (1998B), and through valves and fittings by Polizelli et al. (Polizelli, M.A. et al. (2003)). The computational fluid dynamics (CFD) has proven to be a reliable tool for the estimation of pipeline system losses
( .
Publications that concentrate on non- Newtonian losses more frequently apply new definitions of friction factor (Garcia, E.J., & Steffe, J.F. (1986)) or Reynolds number (Haldenwang, R. et al. (2012)).
Madlener et al. defined the generalized Reynolds number for power-law, Bingham plastic, and Herschel-Bulkley fluids (Madlener, K., Frey, B., Ciezki, H.K.
(2009)). It has been demonstrated by the authors previously that among the many existing definitions, the generalized Reynolds number (Regen) arranges the friction factor values appropriately (Csizmadia, P. & Till, S. (2018)).
The literature on centrifugal pump delivering non-Newtonian fluid suggests the usage of the standard 12.1-12.6 (2005) formed by the Hydraulic Institute in conjunction with the American National Standard Institute (ANSI/HI) (Addie, G.R.,
Roudnev, A.S. & Sellgren, A. (2007)). In the calculations described in the standard, it is necessary to specify the viscosity of the fluid, which is not evident for non- Newtonian materials (Heywood, N. &
Slatter, P. (2019)). Different methods exist in the literature: the Walker and Goulas method (Walker, C.I. & Goulas, A. (1984)), the Pullum et al. method (Graham, L.J.W.
et al. (2009)), and the method developed by Sery et al. (Heywood, N. & Slatter, P.
(2019)).
As it was shown, a considerable amount of literature has been published on pumping of non-Newtonian fluids. These studies, to date, have not yet determined the effect of the increasing TSS concentration on pumping efficiency and operation point of the system. The purpose of our investigation was to demonstrate its impact through this case study.
MATERIALS AND METHODS
Rheological modelling
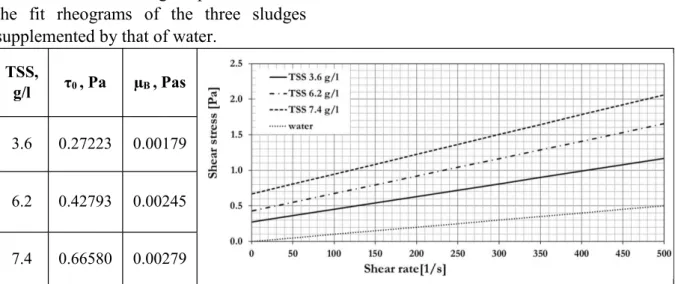
Guibaud et al. (Guibaud, G. et al. (2004)) published measurement data of activated different TSS contents (7.4 g/l; 6.2 g/l; 3.6 g/l). The conditions of the measurement and the fit of the non-Newtonian models were detailed in our previous study (Csizmadia, P. & Till, S. (2018)). For rheological modelling, we used the Bingham model, in which there is a linear relationship between the ] shear stress and the [1/s] shear rate, as , where 0 [Pa] is the yield stress and B [Pas] is the dynamic viscosity. The fitting on the measured value was carried out by the least squares method using MatLab software. Table 1
4 1.
__________________________________________________________________________________
____________________________________________________________________________
shows the exact rheological parameters and the fit rheograms of the three sludges supplemented by that of water.
TSS,
g/l 0 , Pa B , Pas 3.6 0.27223 0.00179 6.2 0.42793 0.00245 7.4 0.66580 0.00279
Table 1. The Bingham plastic rheological parameters of the investigated sludges and the fit rheograms according to Guibaud et al. (Guibaud, G. et al. (2004)) and Csizmadia and Till
(Csizmadia, P. & Till, S. (2018)) The modelled hydrodynamic system
In our case study, we designed a fictive hydrodynamic system (see in Fig. 2) with the static head of Hst=5 m. Our case system consisted of a 30 m long straight pipe with eight elbows on it. The inner pipe diameter was D=0.1 m; the relative
radius of curvature of all the bends was the same as R/D=1, where R [m] is the centreline radius of the curvature. We assumed a hydraulically smooth pipeline.
The selected centrifugal pump operated at revolution number of n=1 420 1/min, the impeller diameter of the pump was Dimp=0.138 m.
Fig. 2. The modelled hydrodynamic system
__________________________________________________________________________________
Estimation of the pressure losses of the pipeline system
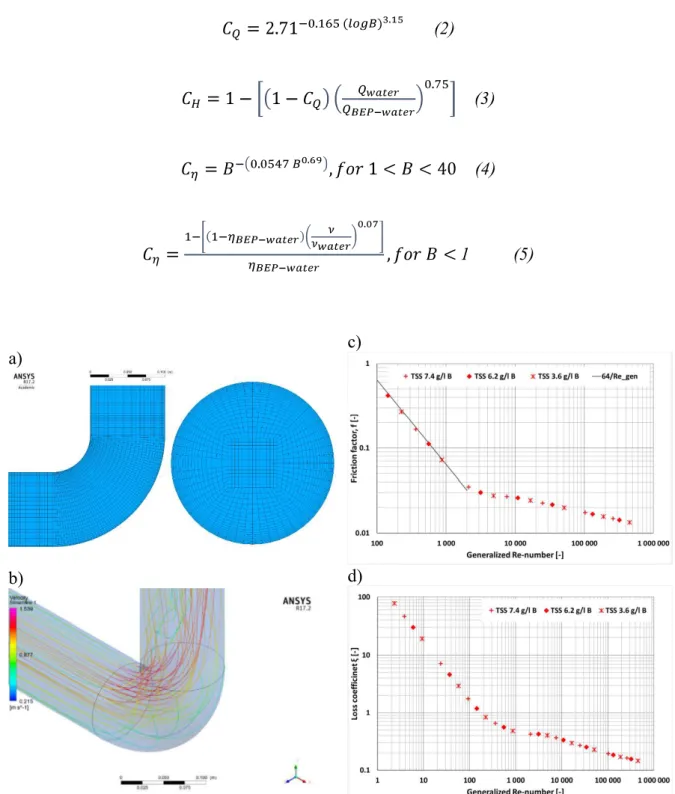
Losses of straight pipe and pipe elements were determined based on our previous work, using computational fluid dynamic (CFD) simulations, for details see
; Csizmadia, P. & Till, S. (2018); and . The geometry of the elbow was built as a fully structured 3D numerical O-grid type mesh (generated in ICEM CFD), including 1.2 million cells, see in Fig. 3a. The pipe section was modelled as a no-slip, hydraulically smooth wall. Steady-state computations were performed with the commercial ANSYS-CFX software (Ansys, C. (2009)), and a high-resolution spatial scheme was used for all equations.
The actual turbulence model was the SST (shear stress transport) turbulence model.
Additional straight pipes with a length of 50D to the upstream and another one with a length of 10D to the downstream sides were added for allowing proper boundary conditions. At the inlet the fully developed turbulent velocity profile, and at the outlet, the average static pressure was prescribed as boundary conditions. Fig. 3b shows the velocity streamlines in terms of TSS 3.6 g/l and a mean velocity of 1 m/s.
Using the generalized Reynolds number (Madlener, K., Frey, B., Ciezki, H.K.
(2009)), the friction factor of the pipe was estimated using the Darcy equation (fD=64/Regen) for laminar flow conditions
and the Blasius equation
(fB=0.316/Regen0.25) for turbulent flows (Csizmadia, P. & Till, S. (2018)), the results are shown in Fig. 3c. The loss coefficients of the elbows were calculated from the total pressure loss caused by the pipe element.
Our CFD calculations were performed on all three rheology models in the mean velocity range of v=0 2 m/s. In Fig. 3d can be seen, that the loss coefficients were determined as the function of the generalized Reynolds number from the simulation results.
Estimation of the pump curve
The calculation of a centrifugal pump performance curve, which is delivering high viscous Newtonian flow, has been well established. This so-called Hydraulic Institute method assumes that the viscosity of the fluid is constant, see (Addie, G.R., Roudnev, A.S. & Sellgren, A. (2007)). For these calculations, a characteristic parameter (B) has to be assessed from the data of the best efficiency point (BEP) with water:
(1)
where -6m2/s] is the kinematic viscosity of the fluid; H [m] is the head; Q [m3/h] is the volume flow rate, and n [rpm]
is the revolution number, see e.g. (Addie, G.R., Roudnev, A.S. & Sellgren, A. (2007).
If B > 40, the fluid properties do not change the performance curve.
The modified values of volume flow rate ( qQwater), head ( HHwater) and efficiency ( water) are derived from those with water using the following multipliers based on e.g. (Kalombo, J.-J.N.
(2014)):
4 1 20)
__________________________________________________________________________________
(2)
(3)
(4)
1 (5)
a) c)
b) d)
Fig. 3. The details of the CFD simulations based on Csizmadia, P. & Till, S. (2018) a) the numerical mesh; b) velocity streamlines plot at TSS 3.6 g/l and v=1 m/s; c) the calculated friction factors as the function of the generalized Re-number; d) the calculated loss
coefficients as the function of the generalized Re-number
In case of non-Newtonian fluids, the kinematic viscosity ( [m2/s], where
is the dynamic viscosity, and [kg/m3] is the density) is not a constant, but depends on the shear rate. This parameter appears in the Eq. (1) and thus indirectly affects all correction factors. Based on the Hydraulic Institute method, the pump curve for non-Newtonian fluids can be calculated only with some modifications. Graham et
al. recommend establishing a representative shear rate; using that, we can determine the representative viscosity for the calculations (Graham, L.J.W. et al. (2009)).
For laminar flow conditions, the equivalent Deq) and from that, the equivalent velocity (veq
is calculated:
(6)
where Dimp [m] is the impeller diameter, and w [1] is a characteristic dimension of the impeller, see (Graham, L.J.W. et al. (2009).
Some researchers (Graham, L.J.W. et al.
(2009); Furlan, J., Visintainer, R., Sellgren, A. (2016); and Aldi, N. et al. (2017)) have attempted to specify the parameter w, but Kalombo et al. (Kalombo, J.-J.N. (2014))
ascertained that it must remain an empirical approach for it. In our study, following the suggestion of Graham et al. (Graham, L.J.W. et al. (2009)), we estimated w, as the 25% of the impeller diameter.
The shear rate is obtained from the Rabinowitsch-Mooney equation:
(7) where is the local gradient of the curve
eq/Deq). In the case of turbulent flow, the typical viscosity is
calculated from the rheogram at the shear rate of (Graham, L.J.W. et al. (2009)).
RESULTS
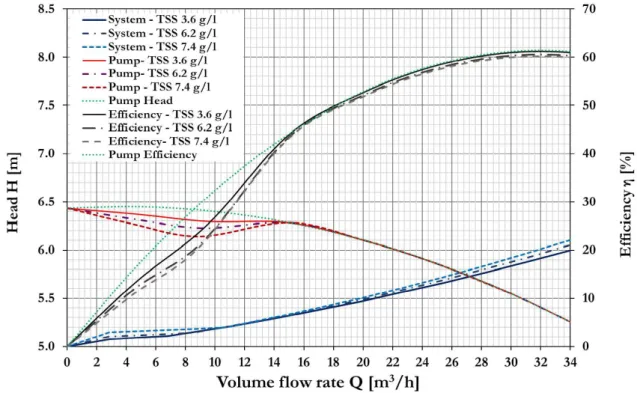
The rheological changes caused by increasing tss content resulted in a barely noticeable change in the characteristic curves of the case system. They generated only a slight increase in the head values around the operation point. Several around the laminar-turbulent transition. in
contrast, the pump curve showed a significant decrease in the head in the range
of low volume flow rates, see Fig. 4. These results are following the curves given in the study of Walker and Goulas (Walker, C.I.
& Goulas, A. (1984)) and Graham et al.
(Graham, L.J.W. et al. (2009)).
4 1 20)
__________________________________________________________________________________
__________________________________________________________________________________
Fig. 4. The system curve (blue lines) and the pump performance curve (red lines) in case of TSS 3.6 g/l (solid lines), TSS 6.2 g/l (chain lines) and TSS 7.4 g/l (dashed
lines)
Fig. 5. Operation points and efficiency curves in case of TSS 3.6 g/l (solid lines), TSS 6.2 g/l (chain lines) and TSS 7.4 g/l (dashed lines);
original head and efficiency curves of the pump (dotted green line)
____________________________________________________________________________
Although there is no significant shift in the operating point of the system, the deterioration in pump efficiency is worth mentioning, as shown in Fig. 5. In the case of TSS content of 3.6 g/l, the pump operated near the point of maximum efficiency; and this fact did not change by the other two fluids, but the efficiency value itself slightly decreased. It can be
seen from the data in Table 2 that in the case of TSS 6.2 g/l, the efficiency reduced to 59%; and to 58.4% in the case of the TSS 7.4 g/l. The specific electric energy consumption of the pump was also estimated. The results showed that the changes in TSS content could cause an up to 3% increase in pump energy consumption.
Q
[m3/h] H [m] Energy consumption [kWh/m3]
TSS 3.6 g/l 27.2 5.73 59.8 0.0261
TSS 6.2 g/l 26.9 5.75 59 0.0266
TSS 7.4 g/l 26.5 5.77 58.4 0.0269
Table 2. Parameters of the operation points and the specific energy consumption of the pump in case of the three suspended solid contents of fluids
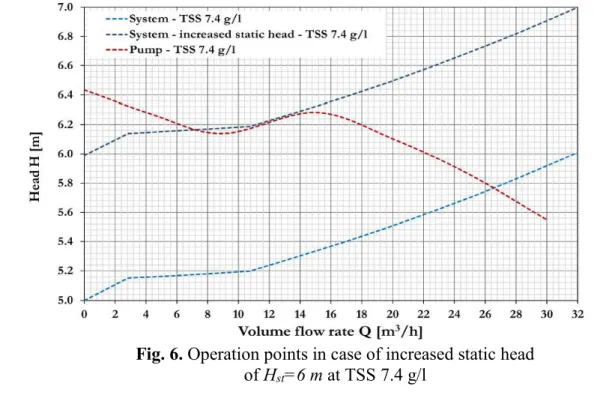
Both the pump performance and the pipeline characteristic curves appeared as expected at high viscous non-Newtonian fluids, especially in the case of TSS 7.4 g/l (see in Fig. 6). It should be noted here that if the static head demand of the system increases at several technological points of
the whole activated sludge process (e.g. the water level on the suction side decreases), the characteristic curve of the pipeline may shift upwards. This may result in unstable operation points, which should be avoided from an operational point of view.
Fig. 6. Operation points in case of increased static head of Hst=6 m at TSS 7.4 g/l
4 1 20)
__________________________________________________________________________________
__________________________________________________________________________________
SUMMARY
Clean water and wastewater technologies play a prominent role in sustainable development. The energy consumption of these essential technologies is significant;
thus, the energy-efficient operation is inevitable from a design and operational growing, but its importance is yet under- recognised, so research gaps remain.
This paper indicates that the changes of total suspended solids (TSS) content of the sludge throughout the activated sludge process influence the hydrodynamic conditions and energy consumption of the sludge pumping circle. In addition to the TSS content, the density and the material structure of activated sludge also change during the WWT process. They should also be taken into account in future research.
We have shown that it is possible to reach an unstable operation during the WWT process. Based on this, it can be concluded that activated sludge pumping systems deserve further investigation from the point of view of operation instability as well.
In our study, the rotational speed of the pump was constant. However, a pump system can operate efficiently with frequency converter speed control. Then the characteristic curve of the pump must be transformed into another revolution number using the affinity laws. In the future, the conditions and limitations for the use of
affinity laws should still be examined in the case of non-newtonian fluids.
ACKNOWLEDGEMENTS
The work was supported by the New National Excellence Programme under the Ministry of Innovation and Technology
-19-4-BME-
Bolyai Research Scholarship.
NOMENCLATURE
B = parameter described in Eq. (1) CH = head correction factor [1]
CQ = volume flow rate correction factor [1]
C = efficiency correction factor [1]
D = inner pipe diameter [m]
Dimp = impeller diameter [m]
Deq = equivalent impeller diameter [m]
f = friction factor [1]
H = head [m]
Hst = static head [m]
n = pump revolution number [rpm]
(7)
R = radius of curvature [m]
Q = volume flow rate [m3/h]
3/h]
v = velocity [m/s]
veq = equivalent velocity [m/s]
w = characteristic dimension of the impeller [1]
= shear rate [1/s]
ciency [%]
= dynamic viscosity [Pas]
B = dynamic viscosity of Bingham plastic fluid [Pas]
3]
0 = yield stress [Pa]
BEP = Best Efficiency Point
CFD = Computational Fluid Dynamics TSS = Total Suspended Solids
WWT = Wastewater Treatment
Keywords: activated sludge, CFD simulations, energy consumption, hydrodynamic losses, non-Newtonian rheology
REFERENCES
Addie, G.R., Roudnev, A.S. & Sellgren, A.
(2007), 'The new ANSI/HI centrifugal slurry pump standard', Journal of the Southern African Institute of Mining and Metallurgy, 107(6), pp. 403 409, viewed 25 January 2020,
<https://www.saimm.co.za/Journal/v10 7n06p403.pdf>.
Aldi, N., Buratto, C., Casari, N., Dainese, D., Mazzanti, V., Mollica, F., Munari, E., Occari, M., Pinelli, M., Randi, S., Spina, P.R., Suman, A. (2017), 'Experimental and Numerical Analysis of a Non-Newtonian Fluids Processing Pump', Energy Procedia, 126, pp. 762 769.
DOI:10.1016/j.egypro.2017.08.247.
Ansys, C. (2009), 'ANSYS CFX-solver theory guide', ANSYS CFX Release, 15317(April), pp. 724 746.
DOI:10.1016/j.ijmultiphaseflow.2011.0 5.009.
'Problems and causes of marginal nutrient availability in winery
wastewater treatment', Acta Alimentaria,
45(4), pp. 532 541.
DOI:10.1556/066.2016.45.4.10.
Baroutian, S., Eshtiaghi, N. & Gapes, D.J.
(2013), 'Rheology of a primary and secondary sewage sludge mixture:
Dependency on temperature and solid concentration', Bioresource Technology,
140, pp. 227 233.
DOI:10.1016/j.biortech.2013.04.114.
Chhabra, R.P. & Richardson, J.F. (2008), Non-Newtonian Flow and Applied Rheology: Engineering Applications (2nd ed.), Elsevier Butterworth- Heinemann, Oxford, UK.
'Predicting the friction factor in straight pipes in the case of Bingham plastic and the power-law fluids by means of measurements and CFD simulation', Periodica Polytechnica Chemical Engineering, 57(1 2), pp. 79 83.
DOI:10.3311/PPch.2174.
- based estimation and experiments on the loss coefficient for Bingham and power- law fluids through diffusers and elbows', Computers and Fluids, 99, pp. 116 123.
DOI:10.1016/j.compfluid.2014.04.004.
Furlan, J., Visintainer, R., Sellgren, A.
(2016), 'Centrifugal pump performance when handling highly non-Newtonian clays and tailings slurries', Canadian Journal of Chemical Engineering, 94(6),
pp. 1108 1115.
DOI:10.1002/cjce.22495.
Kroiss, H. (2018), 'Rheology and friction loss of raw and digested sewage sludge with high TSS concentrations: a case study', Water Science and Technology,
2017(1), pp. 276 286.
DOI:10.2166/wst.2018.111.
Garcia, E.J. & Steffe, J.F. (1986).
'Comparison of Friction Factor
4 1 20)
______________________________________________________________________________
Pipe Flow', Journal of Food Process Engineering, 9(2), pp. 93 120.
DOI:10.1111/j.1745- 4530.1986.tb00120.x.
Graham, L.J.W., Pullum, L., Slatter, P., Sery, G., & Rudman, M. (2009), 'Centrifugal pump performance calculation for homogeneous suspensions', Canadian Journal of Chemical Engineering, 87(4), pp. 526 533. DOI:10.1002/cjce.20192.
Guibaud, G., Dollet, P., Tixier, N., Dagot, C. & Baudu, M. (2004), 'Characterisation of the evolution of activated sludges using rheological measurements', Process Biochemistry, 39(11), pp. 1803 1810.
DOI:10.1016/j.procbio.2003.09.002.
Haaz, E., Fozer, D., Nagy, T., Valentinyi, N., Andre, A., Matyasi, J., Balla, J., Mizsey, P. & Toth, A. J. (2019), 'Vacuum evaporation and reverse osmosis treatment of process wastewaters containing surfactant material: COD reduction and water reuse', Clean Technologies and Environmental Policy, 21(4), pp. 861 870. 2019. DOI:10.1007/s10098-019- 01673-5.
Haldenwang, R., Sutherland, A.P.N., Fester, V.G., Holm, R. & Chhabra, R.P.
(2012), 'Sludge pipe flow pressure drop prediction using composite power-law friction factor Reynolds number correlations based on different non- Newtonian Reynolds numbers', Water SA, 38(4), pp. 615 622.
DOI:10.4314/wsa.v38i4.17.
Heywood, N. & Slatter, P. (2019), 'Deration of Centrifugal Pumps for Non- Newtonian Slurries', paper presented to the 19th International Conference on Transport and Sedimentation of Solid Particles (pp. 219 227), Cape Town, South Africa.
Kalombo, J.-J.N., Haldenwang, R., Chhabra, R., Fester, V. (2014), 'Centrifugal pump derating for non- Newtonian slurries', Journal of Fluids Engineering, 136(3), pp. 1 11.
DOI:10.1115/1.4025989.
Chaparro, A., Cronrath, A., Fatone, F., Lema, J.M., Mauricio-Iglesias, M., Soares, A. & Hospido, A. (2016), 'Monitoring and diagnosis of energy consumption in wastewater treatment plants. A state of the art and proposals for improvement', Applied Energy, 179,
pp. 1251 1268.
DOI:10.1016/j.apenergy.2016.07.043.
Madlener, K., Frey, B. & Ciezki, H.K.
(2009), 'Generalized Reynolds number for non-newtonian fluids', Progress in Propulsion Physics, 1, pp. 237 250.
DOI:10.1051/eucass/200901237.
Pienaar, V.G., Slatter, P.T., Alderman, N.J.
& Heywood, N. I. (2004), 'A review of frictional pressure losses for flow of Newtonian and non-Newtonian slurries through valves', Paper presented to the 16th International Conference on Hydrotransport (p. 189), Santiago, Chile.
Plappally, A.K. & Lienhard V.J.H. (2012), 'Energy requirements for water production, treatment, end use, reclamation, and disposal', Renewable and Sustainable Energy Reviews, 16(7),
pp. 4818 4848. 2012.
DOI:10.1016/j.rser.2012.05.022.
Polizelli, M.A., Menegalli, F.C., Telis, V.R.N. & Telis-Romero, J. (2003), 'Friction losses in valves and fittings for power-law fluids', Brazilian Journal of Chemical Engineering, 20(4), pp. 455
463. DOI:10.1590/S0104-
66322003000400012.
Ratkovich, N., Horn, W., Helmus, F.P., Rosenberger, S., Naessens, W., Nopens, I. & Bentzen, T.R. (2013), 'Activated
sludge rheology: A critical review on data collection and modelling', Water Research, 47(2), pp. 463 482.
DOI:10.1016/j.watres.2012.11.021.
Seyssiecq, I., Karrabi, M. & Roche, N.
(2015), 'In situ rheological characterisation of wastewater sludge:
Comparison of stirred bioreactor and pipe flow configurations', Chemical Engineering Journal, 259, pp. 205 212.
DOI:10.1016/j.cej.2014.07.102.
Telis-Romero, J., Telis, V.R.N. &
Yamashita, F. (1999), 'Friction factors and rheological properties of orange juice', Journal of Food Engineering,
40(1), pp. 101 106.
DOI:10.1016/S0260-8774(99)00045-X.
Turian, R.M., Ma, T.-W., Hsu, F.-L.G., Sung, D.-J. (1998A), 'Flow of concentrated non-Newtonian Slurries 1:
friction, losses in laminar, turbulent and transition flow through straight pipe', International Journal of Multiphase Flow, 24(2), pp. 225 242.
DOI:10.1016/S0301-9322(97)00038-4.
Turian, R.M., Ma, T.W., Hsu, F.L.G., Sung, M.J. & Plackmann, G.W. (1998B), 'Flow of concentrated non-newtonian slurries: 2. friction losses in bends, fittings, valves and venturi meters', International Journal of Multiphase Flow, 24(2), pp. 243 269.
DOI:10.1016/S0301-9322(97)00039-6.
Wakeel, M., Chen, B., Hayat, T., Alsaedi, A. & Ahmad, B. (2016), 'Energy consumption for water use cycles in different countries: A review', Applied Energy, 178, pp. 868 885.
DOI:10.1016/j.apenergy.2016.06.114.
Walker, C.I. & Goulas, A. (1984), 'Performance Characteristics of Centrifugal Pumps When Handling Non-Newtonian Homogeneous Slurries', Proceeding of the Institution of Mechanical Engeneers,198A(1), pp. 41 48.
DOI:10.1243/PIME_PROC_1984_198_
006_02.