Original Study Multiple Myeloma Treatment in Real-world
Clinical Practice: Results of a Prospective, Multinational, Noninterventional Study
Mohamad Mohty,
1Evangelos Terpos,
2Maria-Victoria Mateos,
3Michele Cavo,
4Sandra Lejniece,
5Meral Beksac,
6Mohamed Amine Bekadja,
7Wojciech Legiec,
8Meletios Dimopoulos,
2Svetlana Stankovic,
9Maria Soledad Durán,
10Valerio De Stefano,
11Alessandro Corso,
12Yulia Kochkareva,
13Edward Laane,
14Christian Berthou,
15Hans Salwender,
16Zvenyslava Masliak,
17Valdas Pe celi unas,
18Wolfgang Willenbacher,
19João Silva,
20Vernon Louw,
21Damir Nemet,
22Zita Borbényi,
23Uri Abadi,
24Robert Schou Pedersen,
25Peter Cernel c,
26Anna Potamianou,
27Catherine Couturier,
28Caroline Feys,
29Florence Thoret-Bauchet,
28Mario Boccadoro,
30on behalf of the EMMOS Investigators
Abstract
Multiple myeloma (MM) remains an incurable disease, with little information available on its management in real-world clinical practice. The results of the present prospective, noninterventional observational study revealed great diversity in the treatment regimens used to treat MM. Our results also provide data to inform health economic, pharmacoepidemiologic, and outcomes research, providing a framework for the design of protocols to improve the outcomes of patients with MM.
Poster presented at the 57th Annual Meeting of the American Society of Hematology, December 5-8, 2015, Orlando, FL. Additional presentations of prefinal data were given at the 2014 and 2015 European Hematology Association annual meetings, 2014 European School of Haematology annual meeting, and 2013 and 2015 International Myeloma Workshops.
The full list of EMMOS investigators is provided in the Supplemental Appendix (available in the online version).
1Hematology and Cellular Therapy Department, Saint-Antoine Hospital, Pierre &
Marie Curie University, Paris, France
2Hematology and Medical Oncology, Department of Clinical Therapeutics, National and Kapodistrian University of Athens, School of Medicine, Alexandra General Hos- pital, Athens, Greece
3Servicio de Hematologia, Hospital Universitario de Salamanca, Centro de Inves- tigación del Cáncer, Instituto de Biología Molecular y Cellular del Cáncer (Uni- versitario de Salamanca-Consejo Superior de Investigaciones Científicas), Salamanca, Spain
4Seràgnoli Institute of Hematology, University of Bologna, Bologna, Italy
5Department of Doctoral Studies, Riga Stradin¸s University, Riga, Latvia
6Department of Hematology, Ankara University, Ankara, Turkey
7Hematology and Cell Therapy, Etablissement Hospitalier Universitaire, Oran, Algeria
8Department Hemato-Oncology and Bone Marrow Transplantation, Medical Uni- versity of Lublin, Lublin, Poland
9University Clinic of Hematology, Medical Faculty, Skopje, Macedonia
10Hematologia, Complejo Hospitalario de Jaén, Jaén, Spain
11Institute of Hematology, Catholic University, Rome, Italy
12Fondazione Istituto di Ricovero e Cura a Carattere Scientifico Policlinico San Matteo, University of Pavia, Pavia, Italy
13State Budget Healthcare Institution of Moscow, City Outpatient Clinic, 68 of Healthcare Department of Moscow, Branch 3, Moscow, Russia
14North Estonia Medical Centre Foundation, Tallinn, Estonia
15Université de Bretagne Occidentale, Brest, France
16Multiples Myelom, Asklepios Klinik Altona, Hamburg, Germany
17Institute of Blood Pathology and Transfusion Medicine, Lviv, Ukraine
18Hematology, Oncology, and Transfusion Medicine Center, Vilnius University Hospital, Santariskiu Klinikos, Vilnius, Lithuania
19Universitätsklinik Innsbruck Innere Medizin V, and OncotyroleCenter for Personalized Cancer Medicine, Innsbruck, Austria
20Department of Medical Oncology and Hematology, University Health Network, Toronto, ON, Canada
21Department of Internal Medicine, University of the Free State, Bloemfontein, South Africa
22Internal Medicine, Clinical Hospital Centre Zagreb, Zagreb, Croatia
23Szegedi Tudomanyegyetem, II. Belgyógyászati Klinika, Szeged, Hungary
24Hematology, Meir Medical Center, Kfar Saba, Israel
25Regionshospitalet i Holstebro, Medicinsk Afdeling, Holstebro, Denmark
26Division of Internal Medicine, University Medical Centre Ljubljana, Ljubljana, Slovenia
27Janssen-Cilag, Neuss, Germany
28Janssen-Cilag, Issy-les-Moulineaux, France
29Janssen Research and Development, Beerse, Belgium
30Myeloma Unit, Division of Hematology, Città della Salute e della Scienza, University of Torino, Turin, Italy
Submitted: Mar 31, 2018; Revised: Jun 12, 2018; Accepted: Jun 19, 2018; Epub: Jun 25, 2018
Address for correspondence: Mohamad Mohty, MD, Hôpital Saint Antoine, 184 rue du Faubourg Saint-Antoine, 75571 Paris Cedex 12, France
E-mail contact:mohamad.mohty@inserm.fr
2152-2650/$ - see frontmatterª2018 The Authors. Published by Elsevier Inc. This is an open access article
-
Background:The present prospective, multinational, noninterventional study aimed to document and describe real- world treatment regimens and disease progression in multiple myeloma (MM) patients.Patients and Methods:Adult patients initiating any new MM therapy from October 2010 to October 2012 were eligible. A multistage patient/site recruitment model was applied to minimize the selection bias; enrollment was stratified by country, region, and practice type. The patient medical and disease features, treatment history, and remission status were recorded at baseline, and prospective data on treatment, efficacy, and safety were collected electronically every 3 months.
Results:A total of 2358 patients were enrolled. Of these patients, 775 and 1583 did and did not undergo stem cell transplantation (SCT) at any time during treatment, respectively. Of the patients in the SCT and non-SCT groups, 49%, 21%, 14%, and 15% and 57%, 20%, 12% and 10% were enrolled at treatment line 1, 2, 3, and4, respectively. In the SCT and non-SCT groups, 45% and 54% of the patients had received bortezomib-based therapy without thalidomide/lenalidomide, 12% and 18% had received thalidomide/lenalidomide-based therapy without bortezomib, and 30% and 4% had received bortezomib plus thalidomide/lenalidomide-based therapy as frontline treatment, respectively. The corresponding proportions of SCT and non-SCT patients in lines 2, 3, and4 were 45% and 37%, 30% and 37%, and 12% and 3%, 33% and 27%, 35% and 32%, and 8% and 2%, and 27% and 27%, 27% and 23%, and 6% and 4%, respectively. In the SCT and non-SCT patients, the overall response rate was 86% to 97% and 64%
to 85% in line 1, 74% to 78% and 59% to 68% in line 2, 55% to 83% and 48% to 60% in line 3, and 49% to 65% and 36% and 45% in line 4, respectively, for regimens that included bortezomib and/or thalidomide/lenalidomide.
Conclusion:The results of our prospective study have revealed great diversity in the treatment regimens used to manage MM in real-life practice. This diversity was linked to factors such as novel agent accessibility and evolving treatment recommendations. Our results provide insight into associated clinical benefits.
Clinical Lymphoma, Myeloma & Leukemia,Vol. 18, No. 10, e401-19ª2018 The Authors. Published by Elsevier Inc. This is an open access article
under the CC BY-NC-ND license (http://creativecommons.org/licenses/by-nc-nd/4.0/).
Keywords: Bortezomib, Global, Observational study, Routine practice, Stem cell transplantation
Introduction
Multiple myeloma (MM) is a common hematologic malignancy, with an annual incidence ofw86,000 cases worldwide (6.6 cases/
100,000 persons annually).1,2 Survival outcomes have improved markedly in recent years owing to advances in our understanding of MM disease biology, earlier detection, and improved treatment strategies.3The introduction of novel agents, such as bortezomib, thalidomide, and lenalidomide, has contributed considerably to these improved outcomes.3-5However, despite these advances, MM remains an incurable disease that typically follows a variable, chronically relapsing course.6 Thus, many patients will require multiple lines of therapy.4,5,7
The treatment landscape in MM is rapidly evolving. In 2010, the main novel agents approved for use were bortezomib, lenalidomide (after 1 previous line), and thalidomide. Since then, 6 novel agents (ie, pomalidomide, carfilzomib, panobinostat, daratumumab, ixazomib, elotuzumab) have been approved, and the indications for both bortezomib and lenalidomide have been expanded. Although the focus on the development of new therapies in clinical trials is strong, limited real-world data are available on the treatment of MM from a broad regional perspective.8-13Therefore, the noninterven- tional, multinational Europe, Middle East and Africa Multiple Myeloma Observational Study (EMMOS; ClinicalTrials.goviden- tifier, NCT01241396) was initiated in 2010 to capture real-world data from multiple countries regarding MM treatment practices and outcomes at different stages of the disease. Numerous types of
Patients and Methods
Patients and Study DesignThe present study was a prospective, noninterventional, multi- center, observational study performed to document the use of different treatment protocols and resource usage for MM in routine clinical practice. Adult patients initiating any new therapy for MM from October 2010 to October 2012 were consecutively enrolled in the EMMOS registry, regardless of the therapy type or treatment line at enrollment. Patients who were starting an investigational drug at screening and patients who had received a new line of therapy during the study if that new line was a part of a clinical study were excluded. To minimize the selection bias, a multistage site/patient recruitment model was applied. Enrollment occurred at sites across Europe, the Middle East, and Africa and was stratified by country, region, and practice type (academic, local, private, or regional). The number of sites selected per country was proportional to the overall population estimate of MM prevalence in each country using the GLOBOCAN 2002 data.14,15Each site had an enrollment target to ensure that a representative number of patients from each geographic location and practice type were enrolled. A full list of the EMMOS investigators can be found in the Supplemental Appendix(available in the online version).
Because the present study was a noninterventional study, patient participation had no effect on their treatment course, and all therapy-related questions were decided by the treating physician.
The appropriate independent ethics committees and institutional
Helsinki, Good Clinical Practice guidelines, and applicable regula- tory requirements. An advisory board oversaw the conduct of the study and monitored the data on an ongoing basis. All the patients provided written informed consent.
Objectives and Assessments
The primary objective of the EMMOS was to document and describe current treatment regimens and disease progression in pa- tients with MM. The secondary objectives involved understanding the MM patient population included in the present study (evalua- tion of patient demographic data and disease characteristics), and the extent to which the results of clinical trials can be applied to the wider MM patient community. Additional objectives included documenting and comparing the usage, effectiveness, and safety profiles of the current MM treatment regimens.
The primary efficacy endpoint was the best response to each line of treatment (defined as the greatest level of response achieved with a treatment line). The responses were assessed and recorded after each cycle by the treating physician; no predefined response criteria were mandated. The other efficacy endpoints included time-to- event analyses, such as the time to next treatment (TTNT; start- ing from the beginning of the previous treatment), treatment-free interval (TFI; starting from the end of the previous treatment), and the treatment-free ratio (TFR; ratio of TFI to the duration of the line preceding the TFI). The TFR, calculated as TFI/(TTNT TFI), was used to evaluate the treatment-free time, considering the duration of the preceding treatment. A greater TFR indicates that the patient spent more time treatment free than being treated, which might result in improved quality of life. Overall survival was also assessed; however, these data were not sufficiently mature at the study end and were not included in the present report.
Data Collection
At enrollment in the study (baseline), retrospective data (including patient demographic data and disease features, MM treatment history, and remission status) were captured by a review of the patients’medical records (Supplemental Table 1; available in the online version). During the prospective phase of the study, the data regarding MM treatments and adverse events (AEs) were captured electronically every 3 months, except for serious AEs, which were reported within 24 hours of knowledge of the event.
The responses were captured as close to the start of each cycle as possible, at the investigator’s discretion. Data collection ended 2 years after the last patient was enrolled.
Statistical Analysis
Because the study was observational, no formal statistical hypotheses were tested. The target sample size was 2665 patients, which represents5% of the applicable population of patients with MM treated within the participating countries. The data were analyzed in the full set (defined as all patients meeting the inclusion and exclusion criteria who had received1 prospective line of treatment) and according to whether the patients had undergone stem cell transplantation (SCT) during any prospective or retrospective line of treatment (SCT vs. non- SCT patients). In addition, for the outcomes, the patient data were analyzed stratified by the treatment received (thalidomide- or
lenalidomide-based regimen, no bortezomib; bortezomib plus thalidomide/lenalidomide-based regimen; bortezomib-based regimen, no thalidomide/lenalidomide; other, no bortezomib or thalidomide/
lenalidomide). In each group (SCT vs. non-SCT), the treatment line number was counted from diagnosis rather than from entry into the study. The data were summarized descriptively, except where stated;
time-to-event endpoints were analyzed using the Kaplan-Meier method.
The reported data on treatments, response, safety, and efficacy were from the prospective phase of the study, defined as the period from baseline to patient withdrawal or completion of the study. An MM treatment regimen was defined as1 antineoplastic agent, gluco- corticoid, or other medication prescribed for MM tumor reduction. A line of treatment was defined as1 cycle of a planned MM treatment regimen and could include 1 planned cycle of single-agent or combination therapy or a sequence of combination therapy admin- istered in a planned schedule (eg, induction therapy followed by high- dose chemotherapy/SCT and maintenance).16 We grouped treat- ments within a given line as follows: (1) treatment received during a line was defined according to the regimen received in cycle 1 of that line; and (2) because it was possible to receive multiple drug combi- nations within a single treatment line, the line grouping was also categorized according to the drugs received at any time during that line (eg, during induction, high-dose chemotherapy, and maintenance).
Thefirst method sought to better identify the treatments received during induction, rather than sequentially within a given line; the second method was used for the analyses of efficacy and safety.
Results
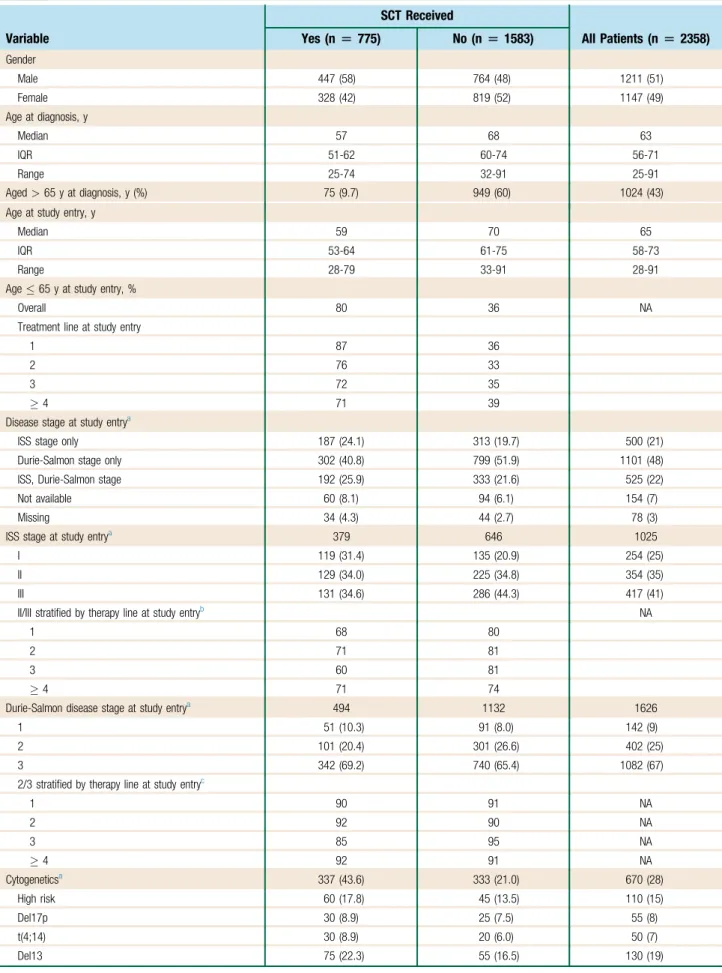
PatientsFrom October 2010 to October 2012, 2358 patients from 22 countries across Europe, the Middle East, and Africa were enrolled (Figure 1). The target enrollment of 2665 patients was not met owing to the high number of interventional studies initiated during this period and the exclusion of patients enrolled in such from the EMMOS reg- istry. Most patients were enrolled in academic (43.7%) or regional (29.1%) study sites, and most were enrolled at sites in Europe. Of the 2358 patients, 51% were male and 43.4% were aged>65 years at diagnosis (Table 1), in line with epidemiologic expectations.
A total of 775 patients (33%) underwent SCT within 1 of their treatment lines (SCT group) and 1583 (67%) did not (non-SCT group;Table 1). The number of evaluable patients in the SCT and non-SCT groups stratified by line of therapy at study entry is listed inTable 1. The median duration of study participation was 27.7 months (interquartile range [IQR], 19.7-32.8 months) in the SCT group and 24.5 months (IQR, 11.8-30.3 months) in the non-SCT group. Thefinal data collection was on November 26, 2014.
As expected, the patients in the SCT group were younger at diagnosis than those in the non-SCT group (90.3% of the SCT patients were aged65 years compared with 40.1% of the non- SCT patients). A lower percentage of SCT patients had Interna- tional Staging System (ISS) stage III disease at baseline compared with the non-SCT population (34.6% vs. 44.3%, respectively). The proportion of patients with a history of bone lesions (71.5% vs.
67.5%) and the proportion of patients requiring dialysis (12.7% vs.
17.5%) in the SCT and non-SCT groups, respectively, were in line with current expectations for the MM population.17 Cytogenetic
-
Figure 1 Patient Disposition and Enrollment Stratified By Country and Site Type.Patients Who Underwent Stem Cell Transplantation (SCT) Within This Line: Line 1, n[299; Line 2, n[133; Line 3, n[76; Line 4, n[21; Line 5D, n[29.yIncluded 1 Patient Who Was Withdrawn From the Study Because of an Undocumented Screen Failure
775 patients who received an SCT at any time during their treatment course*
Line 1 n = 378 Line 2 n = 161 Line 3 n = 107 Line 4 n = 57 Line 5+ n = 63
Completed: n = 491
Prematurely terminated: n = 282
•Adverse event leading to death: n = 199
•Lost to follow up: n = 53
•Withdrawal of consent: n = 10
•Death (not due to AE): n = 7
•Investigator decision: n = 4
•Administration reasons: n = 4
•Other: n = 5
1583 patients who did not receive an SCT at any time during their treatment course Line 1 n = 897
Line 2 n = 319 Line 3 n = 184 Line 4 n = 85 Line 5+ n = 81
Completed: n = 715
Prematurely terminated: n = 867
•Adverse event leading to death: n = 571
•Lost to follow up: n = 137
•Withdrawal of consent: n = 48
•Death (not due to AE): n = 57
•Investigator decision: n = 19
•Administration reasons: n = 23
•Other: n = 12†
Sites, n (%) Patients per site, n (%)
All sites 234 2358
By site type
Academic 95 (40.6) 1031 (43.7)
Regional 72 (30.8) 687 (29.1)
Local 27 (11.5) 266 (11.2)
Private 40 (17.1) 374 (15.9)
By country
Italy 48 (20.5) 467 (19.8)
Germany 43 (18.4) 360 (15.3)
Ukraine 21 (9.0) 212 (9.0)
Spain 25 (10.7) 208 (8.8)
Russia 19 (8.1) 206 (8.7)
Poland 16 (6.8) 182 (7.7)
France 15 (6.4) 155 (6.6)
Turkey 10 (4.3) 126 (5.3)
Algeria 6 (2.6) 81 (3.4)
Greece 4 (1.7) 53 (2.2)
Israel 5 (2.1) 47 (2.0)
Latvia 1 (< 1) 44 (1.9)
Hungary 4 (1.7) 35 (1.5)
South Africa 4 (1.7) 31 (1.3)
Estonia 2 (< 1) 28 (1.2)
Lithuania 2 (< 1) 24 (1.0)
Macedonia 1 (< 1) 23 (1.0)
Austria 2 (< 1) 20 (< 1)
Portugal 2 (< 1) 19 (< 1)
Denmark 2 (< 1) 14 (< 1)
Croatia 1 (< 1) 13 (< 1)
2358 patients enrolled (Full analysis set) Line 1 n = 1275
Line 2 n = 480 Line 3 n = 291 Line 4 n = 142 Line 5+ n = 144
Table 1 Patient Demographics and Disease Characteristics at Baseline
Variable
SCT Received
All Patients (n[2358) Yes (n[775) No (n[1583)
Gender
Male 447 (58) 764 (48) 1211 (51)
Female 328 (42) 819 (52) 1147 (49)
Age at diagnosis, y
Median 57 68 63
IQR 51-62 60-74 56-71
Range 25-74 32-91 25-91
Aged>65 y at diagnosis, y (%) 75 (9.7) 949 (60) 1024 (43)
Age at study entry, y
Median 59 70 65
IQR 53-64 61-75 58-73
Range 28-79 33-91 28-91
Age65 y at study entry, %
Overall 80 36 NA
Treatment line at study entry
1 87 36
2 76 33
3 72 35
4 71 39
Disease stage at study entrya
ISS stage only 187 (24.1) 313 (19.7) 500 (21)
Durie-Salmon stage only 302 (40.8) 799 (51.9) 1101 (48)
ISS, Durie-Salmon stage 192 (25.9) 333 (21.6) 525 (22)
Not available 60 (8.1) 94 (6.1) 154 (7)
Missing 34 (4.3) 44 (2.7) 78 (3)
ISS stage at study entrya 379 646 1025
I 119 (31.4) 135 (20.9) 254 (25)
II 129 (34.0) 225 (34.8) 354 (35)
III 131 (34.6) 286 (44.3) 417 (41)
II/III stratified by therapy line at study entryb NA
1 68 80
2 71 81
3 60 81
4 71 74
Durie-Salmon disease stage at study entrya 494 1132 1626
1 51 (10.3) 91 (8.0) 142 (9)
2 101 (20.4) 301 (26.6) 402 (25)
3 342 (69.2) 740 (65.4) 1082 (67)
2/3 stratified by therapy line at study entryc
1 90 91 NA
2 92 90 NA
3 85 95 NA
4 92 91 NA
Cytogeneticsa 337 (43.6) 333 (21.0) 670 (28)
High risk 60 (17.8) 45 (13.5) 110 (15)
Del17p 30 (8.9) 25 (7.5) 55 (8)
t(4;14) 30 (8.9) 20 (6.0) 50 (7)
Del13 75 (22.3) 55 (16.5) 130 (19)
-
abnormalities assessed by metaphase karyotype andfluorescence in situ hybridization were evaluated in 670 of 2358 patients (28%) overall. These assessments were performed significantly more frequently in the SCT than in the non-SCT patients (337 [43.5%]
and 333 [21.0%] patients, respectively). Approximately one half of the patients in the SCT and non-SCT groups were previously untreated at study entry.
MM Therapies
Frontline Therapy.Of the 380 patients who underwent SCT after study enrollment, 299 (79%) received it as a component of their
received autologous SCT (97%), and most had a single transplant (81%;Table 2). The most common induction therapies for patients with frontline SCT (cycle 1 regimens) were VTD (bortezomib, thalidomide, dexamethasone; n ¼ 95), VD (bortezomib, dexa- methasone; n¼56), VCD (bortezomib, cyclophosphamide, dexa- methasone; n ¼ 49), vincristine, doxorubicin, bortezomib, dexamethasone (n ¼ 26), and CDT (cyclophosphamide, dexa- methasone, thalidomide; n¼26).
During theirfirst cycle, most patients in the overall SCT pop- ulation received a bortezomib-based regimen without thalidomide/
lenalidomide (n¼170; 45%) or a bortezomib plus thalidomide/
Table 1 Continued
Variable
SCT Received
All Patients (n[2358) Yes (n[775) No (n[1583)
Other 108 (32.0) 120 (36.0) 228 (34)
Normal (no specificfindings) 146 (43.3) 157 (47.1) 303 (45)
Baseline laboratory evaluationsd 2332
Serumb2M, mg/L NA NA 1445 (62.0)
<3.5 NA NA 550 (38.1)
3.5 to<5.5 NA NA 375 (26.0)
5.5 NA NA 520 (36.0)
Serum LDH, U/L NA NA 1714 (73.5)
<300 NA NA 1143 (66.7)
300 NA NA 571 (33.3)
MM-related medical history at study entrya
History of bone lesion 554 (71.5) 1068 (67.5) 1622 (69)
History of bone lesion stratified by line at study entry, %
1 66 64 NA
2 74 72 NA
3 77 75 NA
4 80 70 NA
Severe renal impairment 102 (13.2) 292 (18.4) 394 (17)
Dialysis dependent 13 (12.7) 51 (17.5) 64 (16)
History of heart failure 52 (6.7) 280 (17.7) 332 (14)
MM treatment line at study entry
1 378 (49) 897 (57) 1275 (55)
2 161 (21) 319 (20) 480 (21)
3 107 (14) 184 (12) 291 (12)
4 57 (7) 85 (5) 142 (6)
5 63 (8) 81 (5) 144 (6)
Missinge 9 17 26
Data presented as n (%), with all percentages calculated using the total number minus any missing values.
Abbreviations:b2M¼b2-microglobulin; Del¼deletion; IQR¼interquartile range; ISS¼International Staging System; LDH¼lactate dehydrogenase; MM¼multiple myeloma; SCT¼stem cell transplantation; t¼translocation.
aPercentages determined from number of patients with Durie-Salmon stage or number of patients with cytogenetic data.
bPercentages calculated from number of patients with available staging data (SCT: line 1, n¼225; line 2, n¼66; line 3, n¼35; line4, n¼48; total, n¼374; non-SCT: line 1, n¼412; line 2, n¼118; line 3, n¼56; line4, n¼54; total, n¼640).
cPercentages calculated from number of patients with available staging data (SCT: line 1, n¼233; line 2, n¼96; line 3, n¼75; line4, n¼83; total, n¼487; non-SCT: line 1, n¼641; line 2, n¼220; line 3, n¼138; line4, n¼120; total, n¼1119).
dBaselineb2M and LDH summarized for the full analysis set as the number and percentage of patients with an MM treatment line at baseline (75 days) and available results; the percentages for the categories withinb2M and LDH were calculated using the number of subjects with available results.
eMissing patients did not receive treatment at study entry (within the 75-day baseline window) because of the following: treatment planned but not received, observation only (protocol deviation), or start date missing and imputed date therefore outside the baseline window.
lenalidomide-based regimen at any point during their frontline regimen and 131 (35%) received a bortezomib-based regimen without thalidomide/lenalidomide (Table 2). Thus, of the 170 patients who initiated cycle 1 with a bortezomib-based regimen that did not include thalidomide/lenalidomide, 39 (23%) subsequently received thalidomide/lenalidomide in later cycles of their frontline therapy. Of those patients who initiated cycle 1 with an “other”
regimen (not containing bortezomib or thalidomide/lenalidomide), 13 (26%) received bortezomib (n ¼ 6) or thalidomide/lenalido- mide (n ¼ 7) during subsequent cycles of frontline therapy. The patients were treated for a median of 7.5 months (IQR, 4.4-13.9 months).
In the non-SCT population, more than one half of patients received a frontline bortezomib-based regimen without thalidomide/
lenalidomide during their first cycle (54%) and 24% of patients received a combination of“other”agents (Table 2). The most com- mon combinations in the non-SCT group were VMP (bortezomib, melphalan, prednisone) and VD. More than one half of the patients received bortezomib at any time during their frontline therapy (59%), including 53% who received a bortezomib-based regimen without thalidomide/lenalidomide (Table 2). Of those patients who received a bortezomib-based regimen without thalidomide/lenalidomide during cycle 1, 13 subsequently received thalidomide/lenalidomide in later cycles of their frontline therapy as maintenance. Of those patients Table 2 Frontline Therapy for SCT and Non-SCT Patients Recorded During Prospective Data Collection Phasea
Treatment SCT Patients (n[380) Non-SCT Patients (n[906)
Regimens received during cycle 1 of frontline therapy
Thalidomide/lenalidomide-based, no bortezomib 46 (12.1) 160 (17.7)
MPT 0 (0) 68 (7.5)
CDT 34 (8.9) 56 (6.2)
Bortezomib plus thalidomide/lenalidomide-based 114 (30.0) 34 (3.8)
VTD 100 (26.3) 28 (3.1)
VRD 5 (1.3) 2 (0.2)
Bortezomib-based, no thalidomide/lenalidomide 170 (44.7) 491 (54.2)
VD 70 (18.4) 122 (13.5)
VCD 56 (14.7) 61 (6.7)
VMP 3 (0.8) 218 (24.1)
Other, no bortezomib or thalidomide/lenalidomide 50 (13.2) 221 (24.4)
MP 0 65 (7.2)
Vincristine, doxorubicin, dexamethasone 29 (7.6) 37 (4.1)
Regimens received at any point during frontline therapy
Thalidomide/lenalidomide-based, no bortezomib 53 (13.9) 177 (19.5)
Bortezomib plus thalidomide/lenalidomide-based 159 (41.8) 61 (6.7)
Bortezomib-based, no thalidomide/lenalidomide 131 (34.5) 478 (52.8)
Other, no bortezomib or thalidomide/lenalidomide 37 (9.7) 190 (21.0)
Agents received during frontline therapy, n
Median 4 3
IQR 3-5 3-3
Range 1-10 1-7
Treatment duration, mo
Median 7.5 6.4
IQR 4.4-13.9 3.0-10.6
Range 0.1-132.5 0.03-51.9
SCT within frontline therapyb
Any SCT 299 NA
Autologous 291 (97.3) NA
Allogeneic 8 (2.7) NA
SCTs NA
1 242 (80.9) NA
2 57 (19.1) NA
For cycle 1 regimens, any combination for10% of patients in SCT or non-SCT group was provided, with2 regimens (most frequent) for each grouping.
Abbreviations: C¼cyclophosphamide; D¼dexamethasone; IQR¼interquartile range; M¼melphalan; P¼methylprednisolone/prednisolone/prednisone; R¼lenalidomide; SCT¼stem cell transplantation; T¼thalidomide; V¼bortezomib.
aFor example, among the patients who entered the study at the point of receiving theirfirst therapy line.
bSCT was counted once per separate date recorded; a patient could have undergone>1 (overall if in different lines and per line as a planned tandem transplant) during the study period.
-
who initiated cycle 1 with an“other”regimen, 31 were later treated with either bortezomib (n ¼ 14) or thalidomide/lenalidomide (n ¼ 17). Patients were treated in the frontline for a median of 6.4 months (IQR, 3.0-10.6 months).
Because the patient numbers were insufficient to analyze the data for frontline regimens per country, the data from countries classified as having a high or low 60-year-old life expectancy using the World Health Organization’s Global Health Observatory data, with the patients grouped according to age (65 years vs.>65 years) in the SCT and non-SCT populations are listed inSupplemental Table 2 (available in the online version).
Salvage Therapies.In the SCT population, of the patients with data collected prospectively for treatment lines 2, 3, or4 (first, second, or later salvage, respectively), 45%, 33%, and 27% had received a bortezomib-based regimen without thalidomide/lenali- domide during that line, 12%, 8%, and 6% had received a borte- zomib plus thalidomide/lenalidomide-based regimen, 30%, 35%, and 27% had received a thalidomide/lenalidomide-based regimen without bortezomib, and 13%, 24%, and 40% had received an
“other”regimen, respectively (Table 3). The most common com- bination in lines 2, 3, and4 was RD (lenalidomide, dexameth- asone; 20%, 21%, and 13%, respectively;Table 3).
In the non-SCT group, 37% of the patients received a bortezomib-based regimen without thalidomide/lenalidomide and 37% received a thalidomide/lenalidomide-based regimen without bortezomib in their second-line treatment, with only 3% receiving a second-line regimen containing both types of agents (Table 3). In lines 3 and 4, 32% and 23%, respectively, received a thalidomide/lenalidomide-based regimen without bortezomib, and 39% and 46%, respectively, were treated with a combination of
“other”agents. The frequently observed other salvage regimens in lines 2, 3, and 4 included MP (melphalan plus methylprednis- olone or prednisolone or prednisone;Table 3).
Data for salvage regimens from countries with either a high or low 60-year-old life expectancy for both SCT and non-SCT populations are listed in Supplemental Table 3 (available in the online version).
Treatment Response
Frontline Therapy.In the SCT group, the best overall response rate (ORR) at any time during frontline therapy was>85% for patients receiving bortezomib and/or thalidomide/lenalidomide, including 50% rates of a very good partial response (VGPR) or better (Table 4).
The ORR for patients receiving other therapies was 71% and the VGPR or better rate was 29%. In the non-SCT population, the ORR was 80%, with 40% of the patients achieving a VGPR or better. For patients treated with a thalidomide/lenalidomide-based regimen without bortezomib, the ORR and VGPR or better rate was 64%
and 24%, respectively (Table 4). In those patients receiving other combinations, the ORR was 51%, with only 10% achieving a VGPR or better.
Salvage Therapy. In the SCT group, the ORR for patients
respectively. Similar data were observed across the other regimen groups (Table 4). For treatment lines 2, 3, 4, and5 in the non- SCT group, the ORR was 68%, 60%, 45%, and 35%, respec- tively, for patients treated with a bortezomib plus thalidomide/
lenalidomide-based regimen. Again, the data for the other regimen groups were largely similar (Table 4). As seen with the frontline regimens, the ORRs for the SCT group were greater than those for the non-SCT population through line 4; however, in later lines ( 5), the ORRs were similar overall in the SCT and non-SCT groups.
Efficacy: Time-to-event Endpoints
Frontline Therapy.The patients in the SCT group who received a thalidomide-based regimen, a bortezomib plus thalidomide-based regimen, a bortezomib-based regimen without thalidomide/lenali- domide, or‘other’regimens had a median TTNT of 29.4, 38.4, 23.6, and 5.7 months and a median TFI of 14.6, 28.5, 16.5, and 1.7 months, respectively (Table 5). The TFR appeared greater for regimens typically not using a maintenance component or a treat- to-progression approach, such as the ‘other’ category, which was primarily vincristine, doxorubicin, dexamethasone induction in this setting. Both the median TTNT and the median TFI were shortest in this subgroup.
In the non-SCT population, the median TTNT for the patients treated with a thalidomide-based regimen, a bortezomib plus thalidomide-based regimen, a bortezomib-based regimen without thalidomide/lenalidomide, or‘other’regimens was 17.7, 18.5, 22.0, and 13.3 months, respectively (Table 5). The median TFI for the patients who received a thalidomide-based regimen, a bortezomib plus thalidomide-based regimen, or a bortezomib-based regimen without thalidomide/lenalidomide was 3.71, 6.11, and 11.2 months, respectively. For the patients treated with‘other’regimens, the me- dian TFI was only 2.7 months, corresponding to a TFR of 0.91.
Salvage Therapy.In the SCT population, the patients who received a bortezomib plus thalidomide-based regimen had a TTNT of 34.4 and 14.1 months in treatment lines 2 and 3, respectively (Table 5).
In lines 2, 3, 4, and5, the patients treated with a thalidomide- based regimen without bortezomib had a TTNT of 17.7, not evaluable, 13.7, and 4.7 months, respectively. The corresponding TTNT for patients receiving lenalidomide-based regimens without bortezomib was 19.3, 22.6, 22.7, and 35.8 months. The corre- sponding TTNT for patients receiving ‘other’ regimens was 17.2, 13.2, 7.4, and 10.4 months (Table 5). The TFR decreased with each subsequent line, suggesting that patients were increasingly in need of continuing with treatment as they received subsequent lines of therapy. In the non-SCT group, a similar pattern of declining TTNT and TFI with subsequent lines was observed (Table 5). The TFR also decreased with each subsequent line of therapy.
Safety
In the SCT group, 77% of patients who had received a bortezomib- based regimen without thalidomide/lenalidomide recorded 1 treatment-emergent AE (Supplemental Table 4; available in the on- line version). Similar rates were observed for patients who received
30% of patients who had received a bortezomib-based regimen without thalidomide/lenalidomide, a bortezomib plus thalidomide- based regimen, or a bortezomib plus lenalidomide-based regimen, respectively (Supplemental Table 4; available in the online version).
Similar rates were also observed in non-SCT patients in these treat- ment groups, although the numbers were small in some cases. The rates of AEs were lower for patients who had received regimens without bortezomib, thalidomide, or lenalidomide (43% in the SCT and 53% in the non-SCT patients;Supplemental Table 4; available in the online version). In the SCT group, the incidence of peripheral neuropathy (PN) or peripheral sensory neuropathy (PSN) in those regimens without bortezomib (all lines) was < 5%. For patients receiving a bortezomib-based regimen with thalidomide, with lena- lidomide, or without thalidomide/lenalidomide, the corresponding rates were 12.9% (PN; PSN 10.8%), 6.3% (PSN), and 5% (PN; PSN 6.2%), respectively. In the non-SCT group, a similar pattern was observed. The incidence of PN (or PSN) for patients receiving a bortezomib-based regimen with thalidomide, with lenalidomide, or without thalidomide/lenalidomide were<5% (PN), 7.0% (PSN), and 6.6% (PN; PSN 6.0%), respectively. However, the incidence of
PN for patients receiving thalidomide without bortezomib was 9.7%.
Owing to the cumulative dose-related nature of both bortezomib- induced and thalidomide-induced PN and the absence of data on the duration of treatment for individual regimens, it is possible that the PN rates were affected by the treatment durations used for different regimens in different settings, and these data should be interpreted accordingly.
Discussion
To the best of our knowledge, the results from the EMMOS provide the first comprehensive information on the baseline characteristics and treatment of patients with MM treated in multiple countries across Europe, the Middle East, and Africa. This real-world evidence, which differs, by definition, from the evidence obtained through clinical trials, permits an evaluation of the safety and efficacy of MM treatments in daily practice compared with those reported from controlled clinical trials and allows for interpretation on the generalizability of results obtained from such trials compared with those achievable in routine practice. As a prospective, multinational registry, the EMMOS also provides an opportunity to evaluate real- Table 3 Salvage Therapies for SCT and Non-SCT Patients Recorded During Prospective Data Collection Phaseaand Based on Agents
Received During Cycle 1 of Each Line
Treatment
SCT Patients (n[395) Non-SCT Patients (n[677) Line 2
(n[345)
Line 3 (n[288)
Line‡4 (n[486)
Line 2 (n[805)
Line 3 (n[590)
Line‡4 (n[935) Regimens received during cycle 1 of each salvage
therapy line
Thalidomide/lenalidomide-based, no bortezomib 103 (29.9) 101 (35.1) 131 (27.0) 295 (36.6) 189 (32.0) 215 (23.0) Bortezomib plus thalidomide/lenalidomide-based 41 (11.9) 23 (8.0) 30 (6.2) 20 (2.5) 13 (2.2) 34 (3.6) Bortezomib-based, no thalidomide/lenalidomide 156 (45.2) 95 (33.0) 132 (27.2) 296 (36.8) 158 (26.8) 255 (27.3) Other, no bortezomib or thalidomide/lenalidomide 45 (13.0) 69 (24.0) 193 (39.7) 194 (24.1) 230 (39.0) 431 (46.1) Most prevalent combinations
First RD: 69 (20.0) RD: 61 (21.2) RD: 63 (13.0) RD: 163 (20.2) RD: 100 (16.9) VD: 92 (9.8)
Second VD: 65 (18.8) VCD: 25 (8.7) VD: 38 (7.8) VD: 140 (17.4) VD: 57 (9.7) RD: 71 (7.6)
Third VCD: 43 (12.5) ADV: 11 (3.8) VCD: 31 (6.4) VMP: 44 (5.5) MP: 39 (6.6) MP: 50 (5.4)
Fourth VTD: 25 (7.2) VRD: 9 (3.1) CD: 19 (3.9) VCD: 40 (5.0) VCD: 32 (5.4) VCD: 47 (5.0)
Treatment duration, mo
Median 4.4 3.7 3.5 4.6 3.9 3.0
IQR 2.3-8.8 1.6-7.0 1.1-7.2 2.3-8.2 1.6-7.9 1.0-6.6
Range 0.03-37.1 0.03-32.1 0.03-50.9b 0.03-44.0 0.03-46.9 0.03-36.1b
SCT within each line of salvage therapy
Any SCT 133 76 50 NA NA NA
Autologous 126 (94.7) 66 (86.8) 42 (84) NA NA NA
Allogeneic 7 (5.3) 10 (13.2) 8 (16) NA NA NA
SCTsc NA NA NA
1 123 (92.5) 71 (93.4) 47 (94) NA NA NA
2 10 (7.5) 5 (6.6) 3 (6) NA NA NA
Most prevalent treatment combinations (counted in50 lines within each therapy line) for prospective MM treatment lines during thefirst cycle in SCT or non-SCT group shown stratified by treatment line; SCTs were counted only once per separate date recorded; thus, a patient could have undergone>1 SCT (overall and per line) during the study period.
Abbreviations: A¼doxorubicin; C¼cyclophosphamide; D¼dexamethasone; M¼melphalan; MM¼multiple myeloma; P¼methylprednisolone/prednisolone/prednisone; R¼lenalidomide;
SCT¼stem cell transplantation; T¼thalidomide; V¼bortezomib.
aFor example, if a patient entered the study to begin treatment line 3, these data included the treatment regimens received by the patient at line 3 (and any subsequent lines) but not the information collected retrospectively for previous treatment (line 1, line 2) before study enrollment.
bData for treatment line 4 only.
cTandem SCT.
-
world data on MM that are robust and reliable. Thefindings from this large, multinational, multisite analysis provide important evidence to add to the increasing number of reports from analyses of MM treat- ment in the real-world setting.8-13
The reliability of the EMMOS registry is supported by the baseline demographic data and clinical characteristics of the study cohort, which were as expected for a MM population. For example, almost 80% of patients with MM have been reported to have radiologic evidence of skeletal involvement.18In our study,w70% of patients reported a history of bone lesions at study entry. Equally, MM is well known as a disease that predominantly occurs in an older popula- tion.10In the non-SCT group in the EMMOS, the median age at study entry was 70 years, with that in the SCT group slightly younger at 59 years, as expected, given that younger age can be a key factor in determining SCT eligibility.10Nevertheless, we acknowledge that a reporting bias might be present toward patients who were younger or fitter at diagnosis owing to the inclusion of patients who had received multiple previous lines of therapy—older or more frail patients might not have survived long enough to receive several lines of treatment. In
number of prospective studies taking place concurrently, who potentially might have been younger and/orfitter than the nonclinical trial population eligible for the EMMOS.
In terms of treatment, data from the EMMOS have shown that bortezomib was the most commonly used backbone agent in the frontline setting, with 75% and 58% of SCT and non-SCT patients receiving a bortezomib-based regimen with or without thalidomide/
lenalidomide. Patients in the SCT group were more likely to receive a frontline combination of VTD than were their counterparts in the non-SCT group (30% vs. 4%, respectively). In contrast, the VMP regimen was more commonplace in the latter group (1% vs. 24%), reflecting the different standard-of-care regimens in these settings in Europe. In the salvage setting, the use of bortezomib-based and thalidomide/lenalidomide-based regimens appeared similar, with the exception of second-line therapy for SCT patients. In both the SCT and the non-SCT groups, the receipt of‘other’treatments and the diversity of combinations within this category were increasingly common in later lines, suggesting a lack of overall consensus for the best treatment practices in advanced disease. These findings also Table 4 Best Response for SCT and Non-SCT Patients Stratified by Treatment Line and Type (at Any Point in Line) in Prospective
Study Phase (Patients With Available Response Data)
Response
SCT Patients Non-SCT Patients
Patients, n OR
VGPR or
Better Patients, n OR
VGPR or Better Line 1
Thalidomide/lenalidomide-based, no bortezomib 48 45 (94) 29 (60) 140 90 (64) 34 (24)
Bortezomib plus thalidomide/lenalidomide-based 119 115 (97) 92 (77) 40 34 (85) 21 (53)
Bortezomib-based, no thalidomide/lenalidomide 111 95 (86) 57 (51) 380 302 (79) 148 (39)
Other, no bortezomib or thalidomide/lenalidomide 28 20 (71) 8 (29) 153 78 (51) 15 (10)
Line 2
Thalidomide/lenalidomide-based, no bortezomib 69 52 (75) 25 (36) 223 132 (59) 61 (27)
Bortezomib plus thalidomide/lenalidomide-based 40 31 (78) 22 (55) 22 15 (68) 7 (32)
Bortezomib-based, no thalidomide/lenalidomide 117 87 (74) 54 (46) 233 153 (66) 67 (29)
Other, no bortezomib or thalidomide/lenalidomide 28 20 (71) 15 (54) 146 74 (51) 18 (12)
Line 3
Thalidomide/lenalidomide-based, no bortezomib 74 41 (55) 19 (26) 134 64 (48) 23 (17)
Bortezomib plus thalidomide/lenalidomide-based 18 15 (83) 9 (50) 20 12 (60) 4 (20)
Bortezomib-based, no thalidomide/lenalidomide 66 38 (58) 22 (33) 116 66 (57) 30 (26)
Other, no bortezomib or thalidomide/lenalidomide 41 22 (54) 11 (27) 176 72 (41) 20 (11)
Line 4
Thalidomide/lenalidomide-based, no bortezomib 37 24 (65) 9 (24) 76 27 (36) 9 (12)
Bortezomib plus thalidomide/lenalidomide-based 10 6 (60) 1 (10) 11 5 (45) 3 (27)
Bortezomib-based, no thalidomide/lenalidomide 45 22 (49) 14 (31) 89 39 (44) 16 (18)
Other, no bortezomib or thalidomide/lenalidomide 38 10 (26) 7 (18) 116 33 (28) 4 (3)
Line5
Thalidomide/lenalidomide-based, no bortezomib 46 20 (43) 8 (17) 96 39 (41) 13 (14)
Bortezomib plus thalidomide/lenalidomide-based 12 4 (33) 4 (33) 17 6 (35) 2 (12)
Bortezomib-based, no thalidomide/lenalidomide 55 23 (42) 8 (15) 111 39 (35) 4 (4)
Other, no bortezomib or thalidomide/lenalidomide 83 24 (29) 12 (15) 196 37 (19) 5 (3)
Percentages calculated from total number per type of therapy, excluding any missing or not evaluable patients.
Abbreviations: OR¼overall response; SCT¼stem cell transplantation; VGPR¼very good partial response.
Variable
SCT Patients Non-SCT Patients
Line, n/N (%)
Median TTNT, mo (95% CI)
Median TFI,
mo (95% CI) TFR Line, n/N (%)
Median TTNT, mo (95% CI)
Median TFI,
mo (95% CI) TFR
Line 1b
Thalidomide-based 26/51 (51) 29.4 (15.51-NE) 14.6 (0.99-NE) 1.55 89/158 (56) 17.7 (15.1-22.1) 3.71 (2.30-5.13) 0.71
Bortezomib plus lenalidomide-based 6/27 (22) NE (NE-NE) NE (NE-NE) 0.67 4/19 (21) NE (NE-NE) 16.4 (0.07-16.4) 0.35
Bortezomib plus thalidomide-based 42/124 (34) 38.4 (38.4-NE) 28.5 (17.9-34.2) 1.68 18/35 (51) 18.5 (8.28-31.4) 6.11 (1.38-24.2) 1.56
Bortezomib-based, no thalidomide/
lenalidomide
69/125 (55) 23.6 (21.5-37.6) 16.5 (15.4-23.0) 2.52 236/450 (52) 22.0 (20.0-24.2) 11.2 (10.0-13.8) 1.71
Other,cno bortezomib or thalidomide/
lenalidomide
25/32 (78) 5.7 (2.6-9.7) 1.7 (1.0-2.7) 2.80 102/167 (61) 13.3 (9.5-17.1) 2.7 (1.7-5.5) 0.91
Line 2d
Thalidomide-based 10/19 (53) 17.7 (10.3-NE) 11.8 (0.13-NE) 2.29 42/80 (53) 15.2 (10.5-23.6) 2.96 (1.22-7.49) 0.72
Lenalidomide-based 39/80 (49) 19.3 (13.2-36.1) 2.37 (1.25-5.09) 0.56 64/182 (35) 27.1 (17.6-NE) 7.23 (2.53-14.5) 0.64
Bortezomib plus lenalidomide-based 8/18 (44) 21.3 (5.62-NE) 5.29 (0.76-NE) 0.89 3/8 (38) 20.1 (10.7-NE) 14.8 (0.33-14.8) 0.49
Bortezomib plus thalidomide-based 12/31 (39) 34.4 (13.9-NE) 19.4 (10.3-NE) 2.36 13/18 (72) 9.86 (5.42-14.9) 1.22 (0.49-2.86) 0.80
Bortezomib-based, no thalidomide/
lenalidomide
83/138 (60) 14.7 (10.5-19.1) 7.7 (4.6-11.7) 2.82 151/260 (58) 13.6 (11.2-14.9) 6.3 (4.6-8.1) 1.62
Other,cno bortezomib or thalidomide/
lenalidomide
12/26 (46) 17.2 (8.2-NE) 7.8 (1.3-NE) 2.28 79/141 (56) 15.4 (10.5-18.2) 4.3 (2.5-6.7) 1.26
Line 3
Thalidomide-based 5/14 (36) NE (NE-NE) NE (NE-NE) 0.92 24/50 (48) 11.6 (6.90-NE) 4.27 (0.92-8.71) 0.75
Lenalidomide-based 28/79 (35) 22.6 (18.2-NE) 4.44 (1.91-NE) 0.80 43/105 (41) 21.1 (13.0-26.0) 3.78 (1.61-7.66) 0.52
Bortezomib plus lenalidomide-based 4/12 (33) NE (NE-NE) NE (NE-NE) 1.32 5/10 (50) 36.1 (3.81-36.1) 7.89 (0.07-24.0) 0.78
Bortezomib plus thalidomide-based 6/11 (55) 14.1 (5.95-22.8) 6.74 (0.26-21.0) 1.72 6/11 (55) 8.16 (1.54-NE) 2.66 (0.20-4.11) 0.39
Bortezomib-based, no thalidomide/
lenalidomide
46/79 (58) 14.2 (9.4-19.5) 7.3 (4.0-12.6) 2.17 71/129 (55) 13.8 (9.7-17.1) 6.1 (3.3-9.9) 1.86
Other,cno bortezomib or thalidomide/
lenalidomide
17/39 (44) 13.2 (11.0-NE) 9.6 (2.2-NE) 1.97 102/174 (59) 12.0 (9.5-14.8) 3.4 (2.6-4.6) 1.08
Line 4e
Thalidomide-based 4/7 (57) 13.7 (3.94-NE) 1.05 (0.30-NE) 0.79 14/30 (47) 13.3 (9.23-NE) 6.74 (0.39-NE) 0.77
Lenalidomide-based 19/44 (43) 22.7 (14.8-28.9) 2.07 (1.28-12.1) 0.38 19/50 (38) 15.7 (10.5-27.0) 1.87 (1.38-4.70) 0.38
Bortezomib-based, no thalidomide/
lenalidomide
23/47 (49) 15.9 (9.0-26.7) 7.1 (2.3-20.4) 1.53 62/92 (67) 10.0 (7.6-12.3) 4.3 (2.5-5.3) 1.22
Other,cno bortezomib or thalidomide/
lenalidomide
23/36 (64) 7.4 (5.1-10.8) 2.2 (1.0-3.7) 1.26 46/105 (44) 10.1 (8.5-15.9) 2.6 (1.9-7.1) 0.74
Mohamad Mohty et al
ClinicalLymphoma,Myeloma&LeukemiaOctober2018