1
A comparative study of -N-pyridyl thiosemicarbazones: spectroscopic properties, solution stability and copper(II) complexation
Orsolya Dömötöra,b, Nóra V. Mayc, Karla Pelivand, Tamás Kissa,b, Bernhard K. Kepplerd,e, Christian R. Kowold,e, Éva A. Enyedya*
a Department of Inorganic and Analytical Chemistry, University of Szeged, Dóm tér 7, H-6720 Szeged, Hungary
b MTA-SZTE Bioinorganic Chemistry Research Group, University of Szeged, Dóm tér 7, H-6720 Szeged, Hungary
c Research Centre for Natural Sciences Hungarian Academy of Sciences, Magyar tudósok körútja 2, H-1117 Budapest, Hungary
d University of Vienna, Institute of Inorganic Chemistry, Währinger Strasse 42, A-1090 Vienna, Austria
e Research Cluster “Translational Cancer Therapy Research” University of Vienna, Währinger Strasse 42, A-1090 Vienna, Austria
* Corresponding author. Address: Department of Inorganic and Analytical Chemistry, University of Szeged, Dóm tér 7, H-6720 Szeged, Hungary. Tel.: +36 62 544 334.
E-mail address: enyedy@chem.u-szeged.hu
ABSTRACT
The effects of methyl substituents at different positions on the 2-formylpyridine thiosemicarbazone (FTSC) core structure on various physico-chemical properties were investigated. Proton dissociation processes, aqueous solution stability, isomer distribution in different solvents, fluorescence properties and lipophilic character of FTSC, pyridine-2- carboxaldehyde N4,N4-dimethylthiosemicarbazone (PTSC), 2- acetylpyridinethiosemicarbazone (AcFTSC) and 2-acetylpyridine N4,N4- dimethylthiosemicarbazone (AcPTSC) were studied and compared under the same conditions.
There are more and more indications that Cu(II) ions play an important role in the biological activity of anticancer thiosemicarbazones. Therefore, the complex formation equilibria of FTSC with Cu(II) ions were studied by pH-potentiometry, UV-visible spectrophotometry and electron paramagnetic resonance (EPR) spectroscopy to determine stoichiometry, stability
2
constants and solution structures of the complexes formed in aqueous solution (with 30%
DMSO). Mono-ligand complexes in different protonation states were identified such as [CuLH]2+, [CuL]+ and [CuL(OH)] with (Npyridyl,N,S)(H2O), (Npyridyl,N,S‒)(H2O) and (Npyridyl,N,S‒)(OH) coordination modes, respectively. At ligand excess two kinds of isomers of a bis complex [CuL2] were detected at pH > 7, in which binding of the ligands via (Npyridyl,N,S‒)(N) and (Npyridyl,N,S‒)(S‒) donor sets is probable at the equatorial positions.
Based on the stability data, [CuL]+ complexes of the -N-pyridyl thiosemicarbazones are predominant at pH 7.4 at 1:1 metal-to-ligand ratio possessing such high solution stability that their decomposition is not likely even at biologically relevant micromolar concentrations. In addition, FTSC and all methylated derivatives investigated show similar Cu(II) binding abilities which is in contrast to the respective Fe(II)/(III) complexes where terminal dimethylation distinctly increases the solution stabilities.
Keywords: thiosemicarbazones; Cu(II) complexes; isomers; fluorometry; speciation
1. Introduction
Thiosemicarbazones (TSCs) are versatile compounds regarding their structures, metal binding abilities and pharmacological properties including anticancer activity [1-3]. Among the TSCs the most studied representative is Triapine (3-aminopyridine-2-carboxaldehyde thiosemicarbazone, 3-AP) which has already been evaluated in several clinical phase I and II trials [4-6]. Two novel promising TSCs, namely COTI-2 (an orally available third generation TSC) and di-2-pyridylketone 4-cyclohexyl-4-methyl-3-thiosemicarbazone (DpC) have recently entered into human clinical studies [7,8]. These compounds (Chart 1) belong to the family of -N-pyridyl TSCs, thus share a common 2-formylpyridine thiosemicarbazone (FTSC, Chart 2) core unit possessing a tridentate (Npyridyl,N,S) donor set.
N
N N H
S NH2 NH2
N N H
S N
N N
N N
N N H
S N N
Triapine (3-AP) COTI-2 Dpc
Chart 1. Chemical structures of thiosemicarbazones currently undergoing clinical trials.
3
Notably FTSC was the first discovered representative of this class of compounds with in vivo antitumor activity [9]. Ribonucleotide reductase, an iron-containing enzyme catalyzing the rate-determining step in DNA synthesis, is considered as the main target for Triapine and related compounds due to their chelating properties [10-12]. The species being responsible for the inhibition of the enzyme are not the free ligands but their in vivo formed redox-active iron complexes [10-12].
In general, the coordination of -N-pyridyl TSCs to certain metal ions [e.g. Cu(II), Pt(II), Pd(II), Ni(II)] can result in complexes with increased anticancer activity and different mechanisms of action [13]. Especially Cu(II) complexes of TSCs often show enhanced antitumor effect where it is generally assumed that their efficacy is frequently based on intracellular reductant-induced reactive oxygen species (ROS) formation [14-16]. Some compounds have been also reported to efficiently inhibit topoisomerase-II[17Notably, TSCs which possess a N-terminal dimethylation often reveal a more than 100-fold enhanced anticancer activity in vitro [19,20]. In our recent work such highly cytotoxic derivatives also showed a very strong synergistic activity with Cu(II) accompanied by induction of ROS production and massive necrotic cell death [19]. This is also true for Richardson type complexes like di-2-pyridylketone-4,4,-dimethyl-3-thiosemicarbazone (Dp44mT) or DpC where coordination to cellular Cu(II) seems to play an important role in the mode of action [21,22]. The latter examples reflect that the substituents on the TSC backbone can alter the physico-chemical properties and metal binding abilities which in turn has a strong impact on the bioactivity of the compounds. However, in order to investigate such structure-activity relationships the knowledge of the solution speciation and the most plausible chemical forms of TSCs and their metal complexes under physiological conditions is of primary importance.
Characterizations of these compounds are often only performed in solid phase or in the organic solvents, but not enough information is available in aqueous solution.
Herein we report on a comparative study of various derivatives of the simplest -N- pyridyl TSC (FTSC) to gain insight into the effects of methyl substituents at different positions on various physico-chemical properties: proton dissociation processes, aqueous solution stability, isomer distribution in different solvents, fluorescence properties, lipophilicity and Cu(II) binding ability. As derivatives of FTSC the stepwise methylated pyridine-2-carboxaldehyde N4,N4-dimethylthiosemicarbazone (PTSC), 2- acetylpyridinethiosemicarbazone (AcFTSC or AcTSC), and 2-acetylpyridine N4,N4- dimethylthiosemicarbazone (AcPTSC) (Chart 2) were investigated and compared under the
4
same conditions. Although, several of these data have been already reported in literature, the comparability in most cases is insufficient due to the application of different settings and solvents. Solution chemistry of Cu(II) complexes formed with some -N-pyridyl TSCs has been characterized in some of our former publications [23-25] and also by others research groups [26-30], however surprisingly no comparable stability data are available for the standard thiosemicarbazone compound FTSC. Therefore, stoichiometry, stability and structure of Cu(II) complexes of FTSC were determined in aqueous solution in this study via a combined approach using pH-potentiometry, UV-visible (UV-vis) spectrophotometry and electron paramagnetic resonance (EPR) spectroscopy. This enabled now a well-founded comparison of the properties and Cu(II) binding affinities of different biologically active -N- pyridyl thiosemicarbazones.
Ra Rb FTSC (FpT) H H PTSC (Fp44mT) H CH3 AcFTSC (HApT) CH3 H AcPTSC (Ap44mT) CH3 CH3 N
N N H
S N Ra
Rb Rb
Chart 2. Chemical structures of studied thiosemicarbazones (in brackets the abbreviations used by D.R. Richardson and coworkers are shown).
2. Experimental Section
2.1. Chemicals
FTSC, PTSC, AcFTSC and AcPTSC were prepared as described previously [31,32]. 2- Acetylpyridine, 4,4-dimethyl-3-thiosemicarbazide (DMTS), KCl, NaH2PO4, Na2HPO4 HCl, KOH, 4,4-dimethyl-4-silapentane-1-sulfonic acid (DSS), dimethyl sulfoxide (DMSO) and 4- (2-hydroxyethyl)-1-piperazineethanesulfonic acid (HEPES) were purchased from Sigma- Aldrich in puriss quality. CuCl2 stock solution was made by the dissolution of anhydrous CuCl2 in water and its exact concentration was determined by complexometry through the EDTA complex. All solvents were of analytical grade and used without further purification.
Doubly distilled Milli-Q water was used for sample preparation.
2.2. Potentiometric measurements and calculations
5
The pH-potentiometric measurements for the determination of the proton dissociation constants of FTSC and the overall stability constants of the Cu(II) complexes were carried out at 25.0 ± 0.1 oC in DMSO:water 30:70 (w/w) as solvent and at an ionic strength of 0.10 M (KCl) used in order to keep the activity coefficients constant. The titrations were performed with carbonate-free KOH solution of known concentration (0.10 M). The concentrations of the base and the HCl were determined by pH-potentiometric titrations. An Orion 710A pH- meter equipped with a Metrohm combined electrode (type 6.0234.100) and a Metrohm 665 Dosimat burette were used for the titrations. The electrode system was calibrated to the pH =
−log[H+] scale in the DMSO/water solvent mixture by means of blank titrations (strong acid vs. strong base: HCl vs. KOH), similarly to the method suggested by Irving et al. [33] in pure aqueous solutions. The average water ionization constant pKw was 14.52 ± 0.05, which corresponds well to the literature data [23-25,34]. The reproducibility of the titration points included in the calculations was within 0.005 pH. The pH-metric titrations were performed in the pH range 2.0 − 12.5. The initial volume of the samples was 10.0 mL. The ligand concentration was 1 mM and metal ion-to-ligand ratios of 1:1 − 1:3 were used. The accepted fitting of the titration curves was always less than 0.01 mL. Samples were deoxygenated by bubbling purified argon through them for approximately 10 min prior to the measurements.
Argon was also passed over the solutions during the titrations. The exact concentration of the ligand stock solutions together with the proton dissociation constants were determined by pH- potentiometric titrations with the use of the computer program HYPERQUAD [35].
HYPERQUAD [35] was also utilized to establish the stoichiometry of the complexes and to calculate the stability constants (log(MpLqHr)). (MpLqHr) is defined for the general equilibrium pM + qL + rH MpLqHr as (MpLqHr) = [MpLqHr]/[M]p[L]q[H]r, where M denotes the metal ion and L the completely deprotonated ligand. In all calculations exclusively titration data were used from experiments in which no precipitate was visible in the reaction mixture.
2.3. UV-vis spectrophotometric, lipophilicity and spectrofluorimetric measurements
A Hewlett Packard 8452A diode array spectrophotometer and a Thermo Scientific Evolution 220 spectrophotometer were used to record the UV-vis spectra in the 200 to 950 nm window.
The path length was 0.5, 1 or 2 cm. Stability constants of the complexes and the molar absorbance spectra of the individual species were calculated with the computer program PSEQUAD [36]. The spectrophotometric titrations were performed on samples containing the
6
ligands with or without Cu(II) ions and the concentration of the ligands was 50M ‒ 1 mM.
The metal-to-ligand ratios were 1:1 and 1:2 in the pH range from 2 to 12.5 at 25.0 ± 0.1 °C in DMSO:water 30:70 (w/w) at an ionic strength of 0.10 M (KCl). Measurements for 1:1 Cu(II)- to-FTSC system were also carried out by preparing individual samples in which KCl was partially or completely replaced by HCl and pH values, varying in the range ca.1.0–2.0, were calculated from the strong acid content. Time-dependence of UV‒vis absorption spectra were recorded for ligands FTSC, PTSC, AcFTSC and AcPTSC at pH 7.4, 2.3–2.8 and 11.0 in pure water. UV-vis spectra for AcPTSC were also recorded in DMSO, CHCl3, n-octanol, methanol, and for FTSC and AcFTSC in DMSO, 30% (w/w) DMSO/H2O and in n-octanol.
Distribution coefficients (D7.4) values of FTSC, AcFTSC and AcPTSC were determined by the traditional shake-flask method in n-octanol/buffered aqueous solution at pH 7.40 (20 mM HEPES, 0.10 M KCl) at 25.0 ± 0.2 °C as described previously [37]. The ligands were dissolved in n-octanol pre-saturated aqueous solution of the buffer at 50 M concentrations. The aqueous solutions and n-octanol (1:1 ratio) were gently mixed with 360°
vertical rotation (~20 rpm) for 3 h to avoid emulsion formation, and the mixtures were centrifuged at 5000 rpm for 3 min. After separation, UV−Vis spectra of the compounds in the aqueous phase were compared to those of the original aqueous solutions and D7.4 values of the complexes or ligands were calculated as follows: [Absorbance (original solution) / Absorbance (aqueous phase after separation) – 1].
The fluorescence spectra were recorded for FTSC, PTSC, AcFTSC and AcPTSC containing samples on a Hitachi-4500 spectrofluorimeter with the excitation at 310–330 nm.
The emission spectra were recorded using 10 nm/10 nm slit widths in 1 cm quartz cell in water at pH 7.4 (adjusted by the addition of HCl, KOH solutions) at 25.0 ± 0.1 oC. Samples contained 5 M TSC ligand.
2.4. 1H NMR spectroscopic measurements
1H NMR studies for the TSC ligands were carried out on a Bruker Ultrashield 500 Plus instrument. DSS was used as an internal NMR standard and WATERGATE method was used to suppress the solvent resonance. pH-dependency of the spectra of FTSC and AcPTSC was followed in a 30% (v/v) DMSO-d6/H2O mixture in a concentration of 1.5 and 1.2 mM respectively at ionic strength of 0.10 M (KCl). Time-dependence of the spectra of the selected TSCs was followed in various solvents or solvent mixture: CDCl3, CD3OD, DMSO-d6, D2O and 30% (v/v) DMSO-d6/H2O.
7
2.5. EPR spectroscopic measurements and deconvolution of the spectra
All EPR spectra were recorded with a BRUKER EleXsys E500 spectrometer (microwave frequency 9.81 GHz, microwave power 10 mW, modulation amplitude 5 G, modulation frequency 100 kHz). The isotropic EPR spectra were recorded at room temperature in a circulating system. The stock solution contained 1 mM FTSC and 0.5 mM or 1 mM CuCl2 in 30% (w/w) DMSO/H2O at an ionic strength of 0.10 M (KCl). KOH solution was added to the stock solution to change the pH, which was measured with a Radiometer PHM240 pH/ion Meter equipped with a Metrohm 6.0234.100 glass electrode. A Heidolph Pumpdrive 5101 peristaltic pump was used to circulate the solution from the titration vessel through a capillary tube into the cavity of the instrument. The titrations were carried out under an argon atmosphere. The pH range covered was 2–12.5. For several pH values 0.10 mL of sample was taken out of the stock solution and was measured individually in a Dewar containing liquid nitrogen (at 77 K).
The series of room-temperature CW-EPR spectra were simulated simultaneously by the „two-dimensional” method using the 2D_EPR program [38]. Each component curve was described by the isotropic EPR parameters go, AoCu
copper hyperfine and AoN
nitrogen hyperfine couplings, and the relaxation parameters , , which define the linewidths in the equation MI=+MI+MI2, where MI denotes the magnetic quantum number of copper nucleus. The concentrations of the complexes were varied by fitting their formation constants
MpLqHr). For each spectrum, the noise-corrected regression parameter (Rj for the jth spectrum) is derived from the average square deviation (SQD) between the experimental and the calculated intensities. For the series of spectra, the fit is characterized by the overall regression coefficient R, calculated from the overall average SQD. The details of the statistical analysis were published previously [38].
The anisotropic spectra were analyzed individually with the EPR program [39], which gives the anisotropic EPR parameters (gx, gy, gz, AxCu, AyCu, AzCu, AxN, AyN, AzN, and the orientation dependent linewidth parameters). Since a natural CuCl2 was used for the measurements, the spectra were calculated as the sum of the spectra of 63Cu and 65Cu weighted by their natural abundances. The copper and nitrogen coupling constants and the relaxation parameters were obtained in field units (Gauss = 10−4 T).
2.6. HPLC measurements
8
HPLC/UV-vis chromatograms were recorded on samples containing AcPTSC, 2- acetylpyridine, or DMTS using an Atlantis T3 C18 reversed-phase column (100 Å, 3 µm, 2.1×150 mm) from Waters (Milford, USA) on a 1260 Infinity system equipped with a diode array detector controlled by an Agilent ‘OpenLAB CDS ChemStation Edition Rev. C.01.06 [61]’ software (Agilent Technologies). As a mobile phase a gradient prepared from water containing 1% (v/v) acetonitrile and 0.1% (v/v) formic acid (eluent A) and acetonitrile containing 1% (v/v) water and 0.1% (v/v) formic acid (eluent B) was used. The mobile phase was kept constant at 10% B for 1 min. Then, B was increased to 50% within 5 min and kept for 2 min. Subsequently, B was increased to 90 % within 0.1 min and kept for 0.9 min to flush the column, followed by reconstitution of the starting conditions within 0.1 min and re- equilibration with 10% B for 5.9 min (total analysis time = 15 min). Stock solutions were prepared in DMSO (5 mM), and the final samples contained 48 M compound(s), 4 mM HCl and 1% DMSO. Samples were measured (UV-vis detection at 280 nm) after their preparation within 10–20 min, and after 24 h incubation period.
3. Results and Discussion
3.1. Proton dissociation processes, solution stability and isomerism of the studied TSCs FTSC is the simplest -N-pyridyl TSC, thus it can serve as a reference compound for its derivatives (Chart 2). In the present work the influence of the methyl substituents on the FTSC backbone at various positions was studied to reveal differences and similarities in the proton dissociation processes, solution stability at various pH values, isomer distribution in different solvents, fluorescence properties, lipophilicity and Cu(II) binding ability. pKa values of FTSC, PTSC and AcFTSC have already been determined by pH-potentiometry and UV-vis spectrophotometry in our previous publications [23,40], and are collected in Table 1. Values for FTSC were redetermined and are in a good agreement with the published data. Due to the insufficient water solubility of the ligands studies were performed in a 30% (w/w) DMSO/H2O solvent mixture. These -N-pyridyl TSCs (Chart 2) possess two dissociable protons, and pK1 values are attributed to deprotonation of the pyridinium nitrogen (H2L+ HL + H+), while pK2 values belong to the hydrazinic nitrogen of the thiosemicarbazide moiety (HL L‒ + H+). Notably, the negative charge in the completely deprotonated forms is mainly localized on the sulfur atom due to the thione–thiol tautomeric equilibrium. The presence of the electron-donating methyl group at Ra position (AcFTSC)
9
results in significant increase in both pKa values. On the other hand the N-terminally dimethylated derivative, PTSC, has a somewhat higher pK1, but considerably lower pK2 value compared to FTSC. The pH-potentiometric titration of AcPTSC revealed some changes of the compound as it was found that a second titration of AcPTSC with strong base following back- acidification of the initially titrated sample did not provide identical titration curves. This hampered the determination of reliable pKa values.
Table 1
Proton dissociation constants (pKa) of FTSC and selected -N-pyridyl TSCs determined by pH- potentiometry in 30% (w/w) DMSO/H2O and their logD7.4 values. {T = 25 C; I = 0.1 M (KCl)}
TSC ligand pK1 pK2 logD7.4
FTSC 3.10 ± 0.01 11.22 ± 0.03 +0.73 ± 0.01
PTSC 3.38 a 10.54 a +1.15 b
AcFTSC 3.64 a 11.52 a +1.02 ± 0.01
AcPTSC ‒ ‒ +1.16 ± 0.02
a Data taken from Ref. 40. b Data taken from Ref. 41.
Consequently, as a next step the stability of the different ligands in aqueous solution in the presence of 30% DMSO was investigated at various pH values.
▲ ●
♦ ■
▲
♣
●
■ ▲♣a ♣b ▲
● ♦
■ ♣a ♣b▲
●
■
■ ● ▲ ▲ ♦
▲
▲
♦
▲
♦
pH 12.0 24 h pH 12.0 5 min pH 7.4 24 h pH 7.4 5 min pH 2.3 24 h pH 2.3 5 min
9.0 8.7 8.4 8.1 7.8 7.5
/ ppm
■
■
■
♣b
♣a ▲●
▲
■ ♣a ♣b ▲
▲
●
●
●
pH 12.50 12.00 10.99 10.62 9.37 8.45 7.87 6.95 6.33 4.16 3.74 3.25 2.79 2.29 1.76 1.32
9.0 8.7 8.4 8.1 7.8 7.5
/ ppm
(a) (b)
▲ ●
♦ ■
▲
♣
E isomer
Z isomer
10
Fig. 1. (a) 1H NMR spectra of FTSC at the indicated pH values at 5 min and 24 h and (b) pH titration spectra at various pH values. Peak assignation shown in the figure: E (black symbols) and Z (grey symbols) isomers. {cL = 1.5 mM; 30% (v/v) DMSO-d6/water; I = 0.1 M (KCl); T = 25 °C}
First of all the “reference” compound FTSC was investigated at pH 2.3, 7.4 and 12.0 up to 24 h and revealed no signs of decomposition (Fig. 1a). Also the UV-vis spectra recorded for AcPTSC in pure water and the 1H NMR spectra in 30% (w/w) DMSO/H2O solvent mixture at neutral pH do not change within 48 h (Fig. S1). However, significant changes can be observed at acidic (pH 2.7) and basic (pH 10.5) pH values, whereas the changes are much faster in the acidic pH range. Representative UV-vis spectra are shown in Fig. 2a for AcPTSC recorded as a function of time in pure water at pH 2.7. Similar, but much slower changes were observed in the case of the other studied TSCs under identical conditions (Fig. 2b). For PTSC and AcFTSC the absorbance at 330 nm becomes a constant value suggesting that an equilibrium state was reached. The rate of the acid catalyzed reaction gives the following trend: AcPTSC
> PTSC > AcFTSC > FTSC (Fig. 2b), which means that the stability in the acidic medium decreases with the increasing number of methyl groups present in the TSC molecule. The significant decrease of the absorbance band at 330 nm is most likely the consequence of the less extended conjugation system in the molecule due to the cleavage of the C=N Schiff base bond. To support this assumption time-dependent 1H NMR spectra for AcPTSC and for the synthesis precursors 2-acetylpyridine and 4,4-dimethyl-3-thiosemicarbazide (DMTS) were recorded (Fig. S2). The same compounds were also investigated by HPLC (Fig. S3). With both methods the formation of 2-acetylpyridine could be proved undoubtedly in the acidic solution of AcPTSC, although signals belonging to DMTS could not be found neither in the
1H NMR spectra nor in the HPLC chromatograms. Also no other peaks emerged in the chromatogram with time suggesting further decomposition of DMTS.
0.0 0.3 0.6 0.9 1.2 1.5
250 300 350 400 450
Absorbance
/ nm
0 1
0 60 120 180
Abs. at 330 nm
t / min
(a) (b)
0.0 0.2 0.4 0.6 0.8 1.0
0 20 40 60
A / A0at 330 nm
t / h
11
Fig. 2. (a) UV-vis absorption spectra of AcPTSC recorded over 3.5 h at pH 2.73 in pure water. The inset shows the absorbance changes at 330 nm. (b) Time dependence of the acid catalyzed decomposition of AcPTSC (▲), PTSC (●), AcFTSC (■) and FTSC (♦) in pure water followed by UV- vis spectrometry at 330 nm. {cL = 100 µM; pH = 2.73; T = 25 °C}
TSCs are known to be able to appear as E and Z isomers about the C=N double bond and they exhibit thione-thiol tautomerism. Numerous papers reported on the identification and characterization of such isomers of particular TSCs, where the isomer patterns were usually determined on the basis of 1H NMR spectroscopic studies and DFT calculations [23,42-49].
The dominant formation of the E isomer was reported for FTSC in pure DMSO by several authors [45,49]. This is in agreement with our measurements in 30% DMSO-d6/water solvent mixture, although the appearance of a minor amount of the Z isomer was observed in the recorded NMR spectra (Fig. 1b). Notably, the Z isomer is present only in the pH range from 3.2 to 11.0, and its molar fraction is ~5% between pH 6 and 8. The pH-dependency of the chemical shifts of the protons of the E/Z isomers (Fig. S4) reveals that the Z isomer appears mostly when the ligand is present in its neutral HL form with formation of an intramolecular hydrogen bond between the pyridine nitrogen and the NH group of the thiosemicarbazone moiety (Fig. 1a). Also for the other thiosemicarbazones AcFTSC, PTSC and AcPTSC the distribution of the isomers was investigated by 1H NMR spectroscopy in DMSO-d6 and in the 30% DMSO-d6/water solvent mixture at the pH range 6.0–7.4, where no degradation occurs for at least 24 h.
The isomers are in a slow interconversion processes with regard to the NMR time scale (t1/2(obs) >∼1 ms) and the integrated signals of the different ligand protons belonging to the E and Z isomers could be converted to molar fractions. The identification of the isomers was mostly based on the chemical shifts of the NH proton of the hydrazinic moiety (in the cases of pure DMSO-d6 and CDCl3 samples), that is highly sensitive to the formation of the hydrogen bonding in the Z form, and those of N=CH and N=C-CH3 protons, and/or by comparison to literature data [42,44,47]. Distribution data are collected in Table 2.
Table 2
Distribution of isomers of FTSC, AcFTSC, PTSC and AcPTSC in different solvents or solvent mixture based on the 1H NMR spectroscopic measurements.
TSC ligand solvent E% Z% E’%
12
FTSC DMSO-d6
a 100 0 0
30% DMSO-d6 /H2O (pH = 6) 95 5 0
PTSC DMSO-d6
b 79 21 0
30% DMSO-d6 /H2O (pH = 6) 58 42 0 AcFTSC DMSO-d6 c
100 0 0
30% DMSO-d6 /H2O (pH = 6) 95 5 0 AcPTSC DMSO-d6
d 55 18 27
30% DMSO-d6 /H2O (pH = 6) 36 56 8
D2O (pH = 6) 45 49 6
CD3OD 28 55 17
CDCl3 30 36 34
a E: 100% in Ref. 49.; b E: 78% in Ref. 49.; c E: 95%, E’: 5% in Ref. 42.
d E: 53%, Z: 16%, E’: 32% in Ref. 44. and E: 55%, Z: 15%, E’: 30% in Ref. 42.
AcFTSC has a similar isomer distribution as FTSC, while the N-terminally dimethylated derivative PTSC possesses a significantly different isomer ratio under the given conditions.
The ratio of the isomers of PTSC is undoubtedly changing due to the deprotonation and protonation steps [40]. Namely in the strongly acidic and basic pH values only one type of isomer is present similarly to the behavior of FTSC. However at neutral pH and in pure DMSO-d6 both the E and Z isomers are present (a fast exchange process between the isomers resulting in one set of signals in the acidic pH range cannot be excluded).
The isomerization pattern for AcPTSC is more complicated in the DMSO-d6/H2O mixture (Fig. 3) and in D2O as it was expected based on the literature data obtained in pure DMSO-d6 [42,44] and CDCl3 [46]. The isomer ratios were reevaluated in the latter two solvents as well, and our data are in a good agreement with literature.
13
● ♣
▲
♥
♦
■▲
♣
Z E’ E Z E E’ E’ E Z Z E’ E E’ Z E
●
Z E’ E ZE E Z Z E E’ Z E
Z E’ E E Z ZE Z E’ E E’ Z E
ZE’ E ZE E Z Z E E’ Z E
E’ Z E E E Z E’ E Z E’ Z E’ E E’ Z E
■ ▲▲ ♦
■ ▲▲ ♦ ♣ ●
♣
■ ▲▲ ♦ ♣ ●
■ ▲▲ ♦ ♣ ●
■ ▲▲ ♦ ♣ ●
♥
8.8 8.5 8.2 7.9 7.6 7.3 3.4 3.0 2.6
/ ppm
//
#
#
#
#
#
CDCl3
DMSO-d6
30% DMSO- d6/H2O CD3OD
D2O
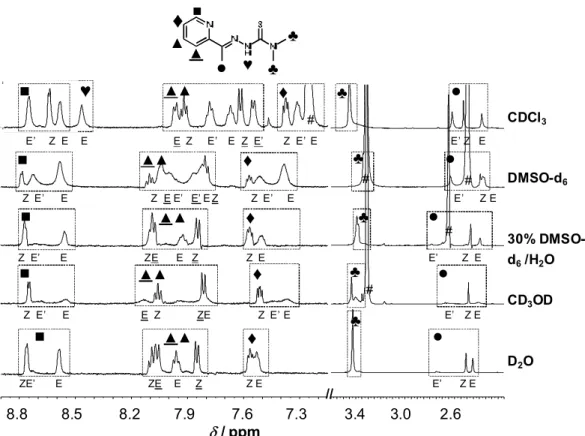
Fig. 3. 1H NMR spectra of AcPTSC in various solvents. Peak assignation shown in the figure for the E, Z and E’ isomers, and solvent residual or water peaks (#). Chemical shift ( / ppm) of NH of the thiosemicarbazone moiety: 8.47 (E), 15.47 (Z) and 14.89 (E’) in CDCl3, 9.62 (E), 15.43 (Z) and 14.72 (E’) in DMSO-d6, 9.39 (E) in DMSO-d6/H2O, (not seen in CD3OD and D2O). {cL = 1 mM in CDCl3, DMSO-d6, 30% (v/v) DMSO-d6/water, CD3OD and 200 M in D2O; pH ~6 in D2O, DMSO-d6/H2O}.
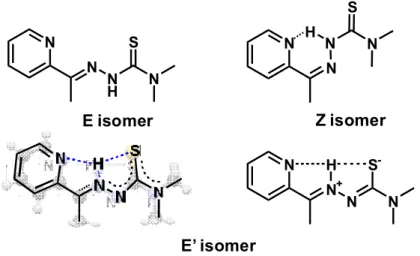
The most important difference between the behavior of AcPTSC and the other studied TSCs is that three isomeric forms (E, Z and E’, Chart 3) co-exist in the different solutions, and the proportion of the Z form is fairly high. E’ is a hydrogen-bonding thioamide type isomer with an extended delocalized -electron structure. The structure of the E’ isomer has been identified in solid phase characterized by X-ray crystallography [44]. For the E’ isomer two possible resonance structures are shown in Chart 3, the formation of the zwitter ionic form (formula on the right side) is less probable in nonpolar solvent. The ratio of the isomers is very sensitive to the type of solvent, namely in water and in the DMSO/water mixture the amount of the E’ isomer is considerably lower than in the non-aqueous solutions. Also UV-vis spectra of AcPTSC were recorded in various solvents for comparison (Fig. 4). The ligand has much stronger bands in the wavelength range from 350 to 450 nm in non-aqueous solutions, in which more E’ isomer is formed. The bathochromic shift of the max and the higher absorbance at this wavelength range are most probably due to the more extended conjugated
14
electron system in the E’ form (Chart 3). Notably, this band is not found in the spectra of FTSC and AcFTSC where the E isomer is predominant (Fig. S5).
N
N N
H N
S N
N
N N
S
N N+
N N
S- H N
N N N S H
H
Z isomer
E’ isomer E isomer
Chart 3. Proposed chemical structures of the E, Z and E’ isomers of AcPTSC based on Refs [42,44].
The formula of the E’ isomer on the left side corresponds to the X-ray structure of the ligand [44].
0.0 0.2 0.4 0.6 0.8 1.0
250 300 350 400 450 500
Normalized absorbance
/ nm
water 30% DMSO/water
CHCl3 DMSO n-octanol methanol
Fig. 4. Normalized UV-vis spectra of AcPTSC measured in the indicated solvents. {cL = 100 µM; T = 25 °C, pH = 6 (in water and 30% (w/w) DMSO/water)}.
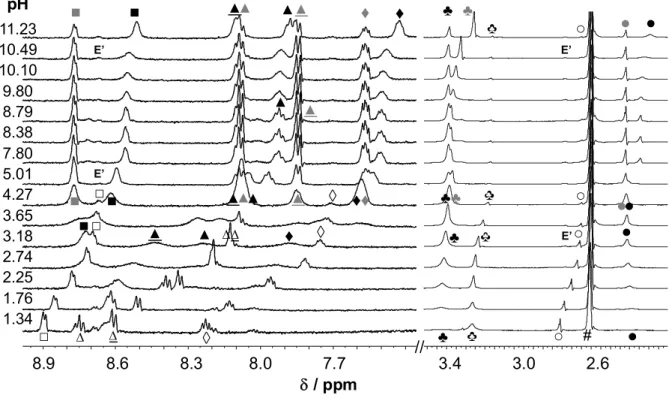
The pH-dependency of the isomeric ratio of AcPTSC in 30% DMSO-d6/water was studied by the addition of strong acid or base to a sample with pH 7.80 (Fig. 5). The appearance of the decomposition products was observed at pH < 4.2 and > 10.5 hindering the determination of microscopic constants for the isomers. In the whole pH range the ratio of the E’ isomer is fairly low and both the E and Z isomers are always present, this is a distinct difference from the behavior of FTSC (Fig. 1b). Signals of the E and Z isomers are well- separated at the neutral and basic pH range; however, the resonance lines collapse to a single broad peak at pH < 4, most probably as a result of the rapid interconversion of the isomers.
15
This is in good agreement with the findings of Bernhardt et al. on the accelerated E Z isomerization process by decreasing the pH of the solution [42]. It can be also concluded on the basis of the pH-dependence of the chemical shifts of the isomers that the Z isomer seems to have somewhat higher pK2 values due to the stabilized structure of its HL form by the intramolecular hydrogen bonding, which makes the deprotonation of HL more difficult compared to the E isomer.
■
●
♦
♣
■
□
□ ♦♦
♦
■
■
▲▲ ▲▲
▲ ▲
▲ ▲▲ ▲ ◊
◊
∆ ∆
□ ∆∆ ◊
■ ▲ ▲ ♦
●
●
○
○
●
●
♣♣
♣ ♣♣
●
♣♣ ♣♣ ○
♣ ♣
♣♣ ○
pH 11.23 10.49 10.10 9.80 8.79 8.38 7.80 5.01 4.27 3.65 3.18 2.74 2.25 1.76 1.34
8.9 8.6 8.3 8.0 7.7 3.4 3.0 2.6
/ ppm
E’
E’
E’
E’
// #
Fig. 5. 1H NMR spectra of AcPTSC at the indicated pH values (pH = 7.80 → 1.34, 7.80 → 11.23).
Peak assignation shown in Fig. 3: E (black symbols), Z (grey symbols) and E’ (E’) isomers, decomposition products (empty symbols) and solvent residual peaks (#). {cL = 1.2 mM; 30% (v/v) DMSO-d6/water; I = 0.1 M (KCl); T = 25 °C}
3.2. Lipophilicity and fluorescence of the studied TSCs
Based on the above reported pKa values (Table 1) it can be concluded that the studied TSCs are present in their neutral HL form at pH 7.4 in aqueous solution and are stable. Thus, the HL species can be considered as the actual chemical forms present under physiological condition.
The lipo-hydrophilic character is an important property as it strongly influences the passage via biological membranes. In order to compare the lipophilic character of the ligands, distribution coefficients of FTSC, AcFTSC and AcPTSC were determined and compared with the already reported value of PTSC [41]. The traditional shake flask method at pH 7.4 was
16
used, and logD7.4values were determined (collected in Table 1), which represents the actual partitioning between n-octanol and water. The logD7.4values (being equal to the logP values in these cases) show the following lipophilicity trend: FTSC < AcFTSC < PTSC, AcPTSC.
As expected the presence of the methyl substituents increases the lipophilicity, whereas the similarity between PTSC and AcPTSC can most likely be explained by the different isomers formed in solution. It is worth noting that for AcFTSC and AcPTSC higher logP values were reported in literature [43], probably due to a somewhat different experimental approach (the ligands were dissolved in n-octanol first and fairly long incubation times of 1 week were used).
TSCs often possess intrinsic fluorescence properties due to their rigid structure and the extended conjugated electron system. This advantageous feature allows the monitoring of the cellular accumulation and distribution in biological samples like cancer cells by fluorescence microscopy [50]. In order to compare the fluorescence of the investigated TSCs, their excitation, emission and UV-vis spectra were recorded under identical conditions. Spectra recorded for FTSC, PTSC, AcFTSC and AcPTSC in pure aqueous solution at pH 7.4 are shown in Fig. 6. Notably, except for FTSC a well-defined difference is observed between the maxima of the excitation and the UV-vis wavelengths. Interestingly, the fluorescence of AcFTSC and AcPTSC is practically negligible which indicates that the methyl group at the Ra
position significantly diminishes the fluorescent emission. Therefore, this type of TSCs is not appropriate for fluorescence microscopic studies.
17
0.0 0.1 0.2
0 100 200 300
210 310 410
Absorbance
Intensity / a.u.
/ nm
0.0 0.1
0 20 40
210 310 410
Absorbance
Intensity / a.u.
/ nm
0.0 0.1
0 20 40
210 310 410
Absorbance
Intensity / a.u.
/ nm
0.0 0.1
0 300 600 900
210 310 410
Absorbance
Intensity / a.u.
/ nm
(a) (b)
(c) (d)
Fig. 6. Fluorescence emission (black solid lines) and excitation (black dashed lines) spectra of TSC ligands and their UV-vis absorbance spectra (grey lines) recorded for the same sample in water at pH 7.4. FTSC (a) λEX = 310 nm, λEM = 390 nm; PTSC (b) λEX = 330 nm, λEM = 415 nm; AcFTSC (c) λEX = 320 nm, λEM = 410 nm; AcPTSC (d) λEX = 320 nm, λEM = 420 nm. {cL = 5 µM; T = 25 °C}
3.3. Copper(II) complexation of FTSC and comparison to other -N-pyridyl TSCs
Complex formation processes of FTSC with Cu(II) ions were studied by the combined use of pH-potentiometry, UV-vis spectrophotometry and EPR spectroscopy in a 30% (w/w) DMSO/H2O solvent mixture. The main aim was to characterize the stoichiometry and solution stability of the Cu(II) complexes especially at physiological pH, and to compare the speciation data to other TSCs containing methyl substituents. The overall stability constants () and pKa values of the Cu(II) complexes of FTSC furnishing the best fits to the experimental data are listed in Table 3.
18 Table 3
Overall stability constants (log) and pKa values of the Cu(II) complexes formed with FTSC determined by various methods. {T = 25 C; I = 0.1 M (KCl) in 30% (w/w) DMSO/H2O}
method log pKa
[CuLH]2+ [CuL]+ [CuLH‒1] [CuL2] [CuLH]2+ [CuL]+ UV-vis
via d-d bands
16.44 ± 0.05 14.76 ± 0.01 5.46 ± 0.02 ‒ 1.68 9.30
UV-vis via CT bands
‒ ‒ 5.53 ± 0.03 ‒ ‒ 9.23
pH-metry ‒ ‒ 5.58 ± 0.04 20.97 ± 0.04 ‒ 9.18
EPR 17.04 ± 0.05 14.78 ± 0.02 5.51 ± 0.03 21.49 ± 0.02 a ‒ 9.27
a Calculated with the equation logβ = log(βisomer 1 + βisomer 2) /2 where logisomer 1 = 21.37 ± 0.02 and logisomer 2 = 20.86 ± 0.02.
2 4 6 8 10 12
-2 -1 0 1 2 3 4
pH
base equivalent ((nKOH-nHCl)/nligand)
Fig. 7. pH-potentiometric titration curves of the Cu(II) ‒ FTSC system at various metal-to-ligand ratios (ligand alone: ♦; Cu(II):L = 1:3: ▲, 1:2: ×, 1:1.5: ●, 1:1: ○). {cL = 1.0 mM; 30% (w/w) DMSO/H2O; I = 0.1 M (KCl); T = 25 °C}
The pH-potentiometric titration data (Fig. 7) reveal that proton displacement by the metal ion due to complex formation is almost complete already at the starting pH value (∼2), and a fairly low amount of free Cu(II) was detected by EPR at this pH in a good accordance with the findings of Antholine et al. in pure water [30]. Therefore the overall stability constants for the species were determined by UV-vis spectrophotometric titrations (at pH between 1 and 12) following the changes of the d-d bands partly overlapped by the S→Cu charge transfer (CT) bands in the visible region (Fig. 8a). Spectra were recorded for individual samples in the pH range from 1.0 to 2.5, in which the KCl was partially or
19
completely replaced by HCl keeping the ionic strength constant, and the actual pH values were calculated based on the strong acid content.
580 600 620 640 660 680
0.0 0.2 0.4 0.6 0.8 1.0
1 3 5 7 9 11
max/ nm
molar fraction
pH
Cu(II) [CuLH]2+
[CuL]+
[CuL(OH)]
0.00 0.05 0.10 0.15 0.20 0.25
450 550 650 750 850 950
Absorbance
/ nm
Cu(II) alone pH = 1.23 11.5
3.0 -8.0
(a) (b)
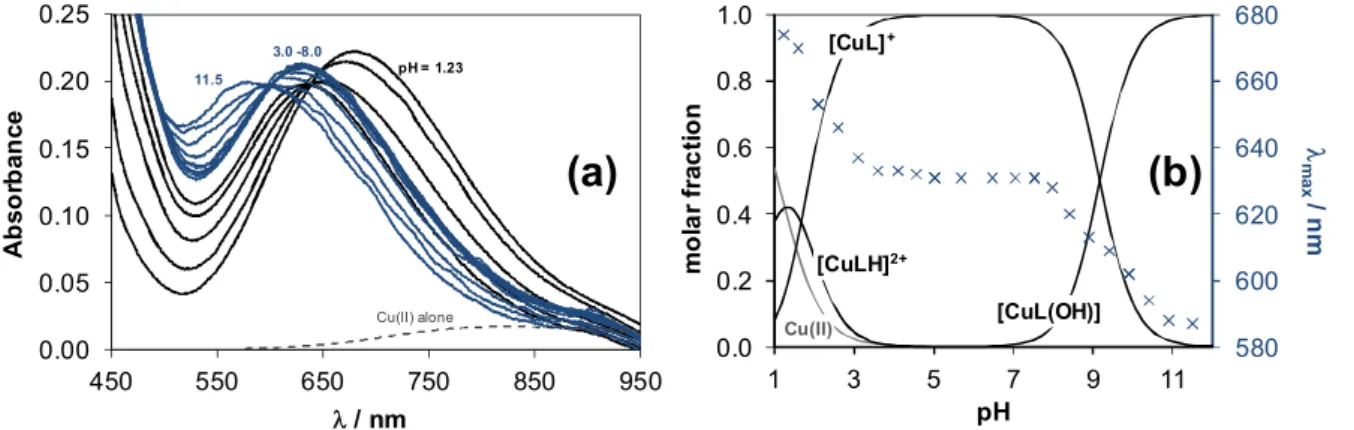
Fig. 8. UV-vis absorbance spectra recorded for the Cu(II) ‒ FTSC system at 1:1 metal-to-ligand ratio at pH = 1.2 – 11.5 (a). Concentration distribution curves for the same system together with the max
values plotted against the pH (b). {cCu(II) = 0.5 mM; l = 2 cm; 30% (w/w) DMSO/H2O; I = 0.1 M (KCl); T = 25 °C}
The spectrum recorded at pH 1.2 represents significant complex formation as it is reasonably different from that of the free Cu(II) ions (Fig. 8a). It is seen that the max value is shifted to lower wavelengths at the pH range from 1.2 to 3 representing changes in the coordination sphere, and becomes constant at pH between 3.5 and ~8 (Fig. 8b). A further decrease of max
is observed at pH > ~8 indicating another rearrangement in the coordination mode. By deconvolution of the recorded spectra stability constants for [CuLH]2+, [CuL]+ and [CuLH‒1] complexes could be calculated (Table 3) and concentration distribution curves were computed for the Cu(II) ‒ FTSC (1:1) system using these constants (Fig. 8b). In the [CuL]+ complex the ligand most probably coordinates via the typical (Npyridyl,N,S‒) tridentate chelating mode.
[CuLH]2+ contains the protonated ligand in which the proton is attributed to the non- coordinating N2 atom. The coordination modes were confirmed in solid state by X-ray crystallography for FTSC complexes containing HL or L‒ forms of the ligand [51,52].
Complex [CuLH‒1] is most probably a mixed hydroxido complex (= [CuL(OH)]) formed by the deprotonation of the water molecule that coordinates in the fourth equatorial position.
From the determined overall stability constants the pKa values for the [CuLH]2+ and [CuL]+ complexes were calculated (Table 3), which are somewhat different from the inconsistent values determined in aqueous solution (with 1% DMSO) by Ainscough et al. (pKa = 3.6 and 11.5) [26] or by Antholine et al. (pKa = 2.40 and 8.30) [28]. A log value of 16.90 for [CuL]+
20
was reported in the latter paper, and the constant was determined spectrophotometrically in aqueous solution via displacement reaction with ethylenediamine [28]. However, the formation of ternary complexes and the mixed hydroxido complex [CuL(OH)] at the chosen pH (pH = 8.5) could make the accurate determination of the constant difficult.
For the further evaluation of our experimental data the log values of the [CuLH]2+
and [CuL]+ complexes (in Table 3) were kept constant. Log values for the [CuLH‒1] complex (and thus pKa for the [CuL]+ species) could be calculated based on the deconvolution of the spectra recorded in the wavelength range from 250 to 450 nm via the ligand and CT bands (Fig. S6), as well as from the pH-potentiometric titration data (Table 3). The pKa values at ~9.2 obtained by the different experimental methods are in good agreement with each other.
Measurements were also performed at ligand excess and the UV-vis spectra recorded in the visible wavelength range (Fig. S7) were found to be different compared to those of samples of 1:1 Cu(II)-to-ligand ratio at pH > ~7. This phenomenon indicates the formation of a new species with a different type of coordination mode compared to those found in the mono-ligand complexes. Based on this finding the formation of a bis complex [CuL2] could be assumed and its stability constant was determined by pH-potentiometry (Table 3). It is worth mentioning that bis complexes were also detected in the case of Triapine and PTSC ligands, but additionally formation of a dinuclear species [Cu2L3]+ could be proved by the means of EPR spectroscopy and electrospray ionization mass spectrometry [23], which could not be observed for FTSC.
In order to confirm the speciation model obtained by the UV-vis and pH- potentiometric measurements and to elucidate the coordination modes EPR spectroscopy was applied at room temperature and at 77 K. A pH-dependent series of experimental and simulated EPR spectra are depicted in Figs. 9a,c and S8, and EPR spectroscopic data obtained from the simulation are given in Table 4. The component isotropic and anisotropic EPR spectra calculated from the simulations are shown in Fig. 9b,d. Overall stability constants determined by EPR spectroscopy for the Cu(II) ‒ FTSC complexes are collected in Table 3.
The nitrogen splitting, caused by the equatorial coordination of the nitrogen atoms, is well resolved in all component spectra.
21
(a) (b) (c) (d)
Fig. 9. Experimental (black) and simulated (red) solution EPR spectra recorded for the Cu(II) – FTSC system at 1:2 metal-to-ligand ratios at room temperature (a) and in frozen solution at 77 K (c).
Calculated component EPR spectra obtained for the different complexes by the decomposition of room temperature solution spectra (b) and frozen solution spectra (d). {cCu(II) = 0.5 mM, cL = 1.0 mM;
30% (w/w) DMSO/H2O; I = 0.1 M (KCl)}
22 Table 4
Isotropic and anisotropic EPR parameters of the components obtained for Cu(II) – FTSC complexes
Complex isotropic EPR data anisotropic EPR dataa Calc. datab
go AoCu(G) AoN (G) gx gy gz AxCu (G) AyCu(G) AzCu(G) AxN(G) AyN(G) AzN(G) go,calc [CuLH]2+ 2.1030(2) 70.5(3) 15.2(4)
7.1(5)
2.028 2.053 2.205 23 19 169 14
8
16 11
11 13
2.095
[CuL]+ 2.0962(1) 74.5(1) 15.9(2) 10.4(2)
2.034 2.047 2.180 22 23 174 10
14
17 11
10 10
2.087
[CuLH‒1] 2.0924(1) 76.3(1) 13.9(1) 11.5(1)
2.023 2.058 2.191 7 37 179 10
14
14 10
11 14
2.091
[CuL2] isomer 1 2.0988(5) 61.2(6) 12.0(9) 9.5(9) [CuL2] isomer 2 2.0808(2) 71.5(3) 13.4(3)
13.3(3) 13.0(4)
2.017 2.054 2.179 15 34 178 11
15 15
15 12 12
9 16 16
2.083
a The experimental error were ±0.001 for gx, gy and gz, ± 1 G for Ax, Ay Az. b go,calc=(gx+gy+gz)/3
23
Based on the EPR spectra a similar speciation model emerged as in the case of the measurements by pH-potentiometry and spectrophotometry. The EPR spectra also suggest that at pH < 4 the presence of the free Cu(II) ions is low and the metal ion mostly exists as [CuLH]2+ and [CuL]+ complexes. The [CuL]+ species predominates in a wide pH range between 3.5 and 8, and the species [CuL(OH)] can be assigned at the more basic pH values.
At ligand excess formation of a bis-ligand complex [CuL2] was assumed in good accord with the results of the other two methods. The obtained EPR parameters of the mono complexes are similar to those of other related -N-pyridyl TSCs such as Triapine [23]. In [CuLH]2+ the coordination of two nitrogens and the thioamide S can be suggested, while the lower g0 and higher A0 values of [CuL]+ are most probably the result of the deprotonation of the non- coordinating NH group, and the coordination through (Npyridyl,N,S–) is suggested. The further changes of the parameters agree well with the deprotonation of the coordinated water molecule in the equatorial plane. The isotropic EPR spectra of complex [CuL2] were decomposed into two component spectra indicating that coordination isomers exist in the solution. The major isomer (isomer 1, 74%) has higher go value and lower Ao value and unresolved EPR spectra, while the minor isomer (isomer 2, 26%) has significantly lower go
and higher Ao value and well resolved nitrogen splitting caused by the equatorial coordination of three nitrogen donor atoms (Fig 9c). The two component spectra and their EPR parameters are very similar to those obtained for the related -N-pyridyl TSCs, reported previously [23].
At frozen solution only one component could be detected. Averaged go value can be calculated from the anisotropic gx,gy and gz parameters and can be compared to the measured go values of the two components (Table 4) from which we concluded that at low temperature probably the minor component becomes predominant. If we assume that the monomeric ligation (Npyridyl,N,S–) is remaining in the complex [CuL2] the second ligand can coordinate via the N or S– donors in the fourth equatorial position resulting in different nitrogen splitting of the EPR spectra. Both the room temperature and frozen solution spectra of the minor component reflects three nitrogens, thus the coordination of N donor atom of the second ligand is supposed for this isomer, while the major isomer most probably formed with the ligation of the S– group at the equatorial positions. A possible completed coordination with axial ligations (and therefore bidentate coordination of the second ligand) is suggested by the batochromic shift of the max values parallel to the formation of the complex [CuL2] (Fig.
S7a).
24
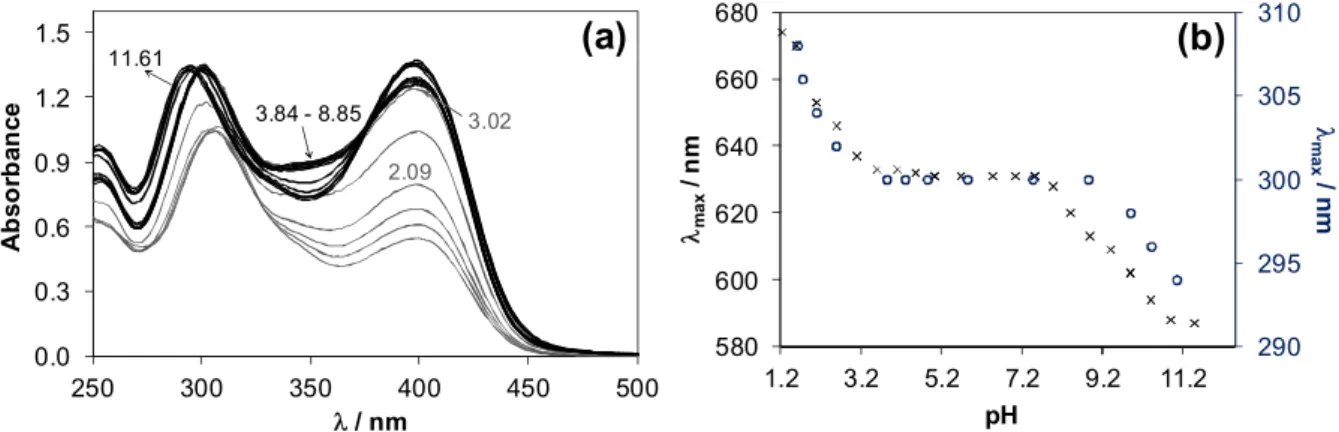
The decomposition process of AcPTSC hindered the exact speciation studies with Cu(II) ions, however the pH range of the complex formation could be compared to that of FTSC. UV-vis spectra were recorded by the addition of HCl or KOH to a sample of neutral pH (Fig. 10a), which show the predominant formation of a complex, most probably [CuL]+ in the pH range between 3.9 and 8.9. The spectrum at neutral pH does not change over a 24 h period. The changes of the spectra in the basic pH range were similar as observed for the FTSC complex, but in the acidic pH range the decomposition of the ligand resulted in altered features as the decomposed ligand is not able to chelate the Cu(II) ions anymore. The insufficient metal binding ability of AcPTSC followed by decomposition was confirmed by the large difference in the spectra of samples containing ligand kept at neutral or acidic pH prior to the addition of Cu(II) ions (Fig. S9). max values are plotted against the pH in Fig. 10b for the Cu(II) complexes of AcPTSC and FTSC for comparison. The figure shows a similar (only slightly wider) pH range for the AcPTSC complex representing a similar metal binding ability of the ligands at the pH range between ca. 4-8.
290 295 300 305 310
580 600 620 640 660 680
1.2 3.2 5.2 7.2 9.2 11.2
max/ nm
max/ nm
pH
(b)
0.0 0.3 0.6 0.9 1.2 1.5
250 300 350 400 450 500
Absorbance
/ nm 11.61
3.84 - 8.85 3.02 2.09
(a)
Fig. 10. UV-vis absorbance spectra recorded for the Cu(II) ‒ AcPTSC system at 1:1 metal-to-ligand ratio at indicated pH values. (pH = 7.0 → 1.7 and 7.0 → 11.6) (a). max values plotted against the pH for AcPTSC (○) and FTSC (×) complexes (b). {cCu(II) = 0.1 mM; cL = 0.1 mM; l = 1 cm; 30% (w/w) DMSO/H2O; I = 0.1 M (KCl); T = 25 °C}
Together with our recently reported solution speciation data for PTSC, Triapine and APTSC (3-aminopyridine-2-carboxaldehyde N4,N4-dimethylthiosemicarbazone the terminally dimethylated derivative of Triapine) [23] it can be concluded that all the studied -N-pyridyl TSCs predominantly form [CuL]+ complexes in a wide pH range involving the physiological pH. In order to compare the solution stability of the Cu(II) complexes of FTSC to other TSCs p[Cu(II)] (negative logarithm of the equilibrium concentration of the unbound metal ion)


![Fig. 11. p[Cu(II)] (= ‒log [Cu(II)]) values at pH 7.4 calculated for Cu(II) complexes of some selected](https://thumb-eu.123doks.com/thumbv2/9dokorg/1290354.103417/25.892.263.639.550.769/fig-cu-ii-log-values-calculated-complexes-selected.webp)
