Special problems of quality data
in low economy countries: focusing on Eritrea
Henock Ghebrehiwot Berhe
Lecturer
Eritrea Institute of Technology, Eritrea
E-mail: henacharity@gmail.com
Kamlesh Kumar Shukla
(corresponding author) Associate Professor
Eritrea Institute of Technology, Eritrea
E-mail: kkshukla22@gmail.com
The accuracy of age statistics is an indispensable aspect of planning and estimating demographic rates of any country. The objective of this study is to evalu- ate the quality of age reported by respondents in the EPHS (Eritrean Population and Health Survey) 2010.
The data are collected from the survey, whereas Whipple’s index and Myers’ blended index are used to calculate the extent of age heaping and digit prefer- ence. The authors compare the patterns of digital pro- pensity in an Eritrean setting using Turner’s hypothet- ical ranking. The quality of the survey’s age statistics is found to be rough according to the standard
.
KEYWORDS: Age heaping.
Myers’ blended index.
Whipple’s index.
DOI: 10.35618/hsr2019.01.en040
I
n demographic studies, personal features of age and sex hold positions of prime importance (Siegel–Swanson [2004]). The information thereof is obtained through personal interviews. The data on sex can be collected with less difficulty by asking the persons to report their gender. However, with age data, direct inquiry may lead to less accurate information, perhaps because a question on age is more prone to esti- mated responses. Most demographic analyses and developmental planning depend on the age–sex composition of a population. According to Siegel and Swanson [2004], the age–sex structure is used as a vital tool in the study of population dynamics.Within this field, fertility, mortality, migration, nuptiality, and certain other areas of demographic analysis are key subjects. The age–sex structure can significantly affect the population’s current and future social and economic state. We place emphasis on age data because we know that it is one of the most important variables in the study of demography, epidemiology, actuaries, and other economic areas. According to Pardeshi [2010], age is a socio-demographic variable related to a host of descriptive studies, but also a commonly assessed risk factor in analytical studies.
Various national development programs for the provision of social services such as education, health, employment, housing, and food hinge on the vital socio- demographic structure classified by age and sex. Accurate age and sex data are evi- dently important; therefore, they are undoubtedly a relevant issue and must be pains- takingly addressed in demographic analyses.
Demographic indicators such as fertility, mortality, and nuptiality are age–sex de- pendent (Siegel–Swanson [2004], Kpedekpo [1982]). Spurious inferences can be drawn when misreporting of age data occurs. Misreporting age in years by respond- ents has become a challenging problem for demographers globally. Siegel and Swanson [2004] argue that misreporting may be caused by the following: age is er- roneously reported by the respondent, erroneously estimated by the enumerator, or erroneously allocated by the census office.
Sources of inaccuracies in age reporting in censuses and surveys have been recog- nized in the past by researchers. These comprise unawareness of the precise age, aware or unaware fondness for certain ages, negligence in reporting and recording, and pro- pensity to round up ages (Kpedekpo [1982], Stockwell–Wicks [1974], Ewbank [1981]).
Thus, systematic irregularities often plague the age distribution of a population in cen- suses and surveys through overstatement or understatement of certain preferred or avoided digits.
In many cases, data from surveys and censuses portray significant piling or ex- cesses at ages ending in digits 0 and 5, and to a lesser extent in even digits, and defi-
ciencies at ages ending in digits 1 and 9. This kind of tendency to report certain ages at the expense of other ages is known as age heaping, age preference, or digit pref- erence. Age heaping is most noticeable among population sub-groups with low liter- acy rates (Myers [1940], Agrawal–Khanduja [2015], Pal–Mukhopadhyay–Tewari [2015], Bekele [2006]).
The Eritrean situation in age reporting resembles the current state in developing societies in Africa and other third-world countries. The need for strategies and pragmatic involvement to obtain accurate age statistics is uncontested. Thus, it entails a sound understanding of the factors affecting age misrepresentations, and there is a dearth of methodical examination with respect to this topic in the context of Eritrean surveys. The main objective of the present study is to evaluate age heaping and assess the accuracy of age data of respondents, which was reported during the EPHS in 2010.
The paper is divided into four sections. After this brief introduction of age accu- racy, Section 1 discusses data and methodology. In Section 2, important techniques of evaluating the accuracy of age data are presented and analysed. Based on the re- sults, conclusions are drawn in Section 3. Finally, policy and future recommenda- tions are proposed.
1. Data and methodology
Two methods of analyses have been used to evaluate quality of age reporting in the EPHS 2010: graphical assessment of misreporting and summary indices to measure age misreporting, such as Whipple’s index and Myers’ blended index (also known as Myers’ index). Turner’s hypothetical ranking has been used to compare reported ages.
For this study, data were collected from the EPHS conducted between January and July 2010. The EPHS 2010 dataset was the latest national dataset available for the whole nation. It was designed as a sequel to two national surveys in order to up- date the information from those previous surveys as well as provide results on addi- tional topics. The data are anticipated to be used by researchers, decision-makers, and program managers for advancing demographic and health related programs.
The sample for the EPHS 2010 was selected in two stages. In the first stage, 900 clusters were selected among the list of clusters (525 from rural areas and 375 from urban areas) in the country. The selection of clusters was carried out through the linear systematic random sampling procedure, with the probability of selection being proportionate to the number of households in each cluster. A com-
plete household listing operation was carried out in the selected clusters to provide a frame for the final linear systematic random selection of households during the second stage of sampling in the EPHS 2010. The study had a household response rate of 97.8%.
Table 1 describes the population composition in the survey. It shows that young population age groups dominated the sample. The distribution across age groups was 43% for the younger age category (less than 15 years of age) and 6% for the older age category (over 65 years). The survey comprised 51.1% female respondents and 48.9% male respondents.
Table 1 Distribution of the number of respondents by age group in the EPHS, 2010
Age group Number of respondents Distribution of the number of respondents
<10 42,721 28.3
10–19 38,256 25.3
20–29 20,314 13.4
30–39 15,563 10.3
40–49 11,821 7.8
50–59 9,287 6.1
60–69 7,278 4.8
70–79 4,242 2.8
80+ 1,726 1.1
Total 151,208 100.0
Note. Deviation from 100.0% results from rounding.
Source: EPHS 2010 data.
2. Analysis and discussion
This section provides the evaluation of age preference through different detecting methods. First, a descriptive analysis is introduced to assess the extent of digit pref- erence by the count of each terminal digit of age. Then visual assessment is carried out through the population pyramid to spot irregularities in reporting of ages. Finally, various demographic measures, such as Whipple’s index and Myers’ blended index, are presented to determine the extent of age heaping in the EPHS 2010.
2.1. Descriptive analysis
A simple cross-tabulation of the percentage of individuals by age ending in mul- tiples of 0 and 5 as well as even and other terminal digits of the survey should shed light on the patterns of age heaping.
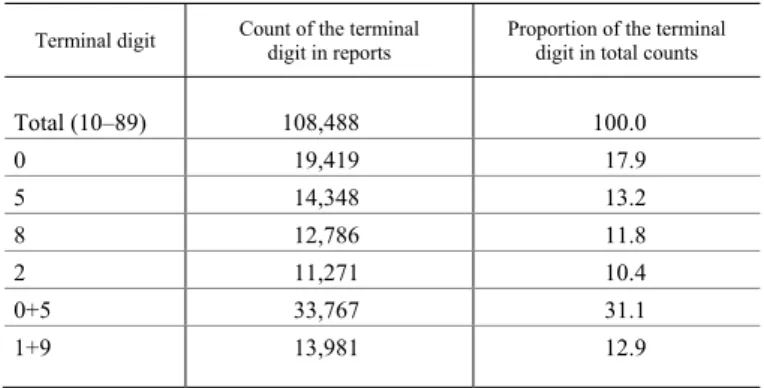
Table 2 presents the counts and proportions of the reported terminal digits in the survey. The digit preference for terminal digits 0 and 5 was evident, followed by terminal digits 8 and 2. However, 1 and 9 were least favoured as terminal digits, being counted about 13%.
Table 2 Reported terminal digit – counts and proportions in the EPHS, 2010 Terminal digit Count of the terminal
digit in reports Proportion of the terminal digit in total counts
Total (10–89) 108,488 100.0
0 19,419 17.9
5 14,348 13.2
8 12,786 11.8
2 11,271 10.4
0+5 33,767 31.1 1+9 13,981 12.9
Source: EPHS 2010 data.
2.2. Graphical assessment of age heaping
Graphical assessment was adopted to visually detect the extent of anomalies in age data. In this section, one of the techniques of graphical evaluation, the population pyramid, is presented. However, not all age data irregularities assessed are attributed to data errors, and caution should be exercised to see if any unusual events occurred in the past (Siegel–Swanson [2004]).
2.2.1. Population pyramid
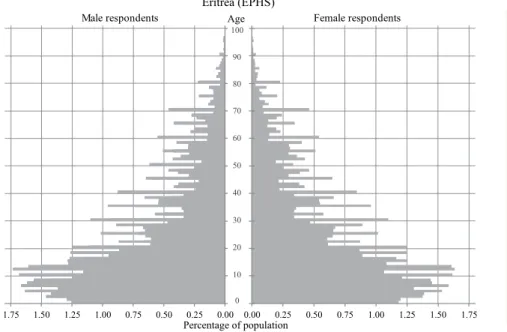
Age heaping can be assessed using a population pyramid that depicts single years of age. The single-year population pyramid displays the size of the population enumer- ated in each year of age by sex. The base of the pyramid is primarily affected by the extent of fecundity in the population, while the degree of convergence to the top is determined by preceding levels of mortality and fertility. The presence of age heaping
is characterised by longer bars at preferred terminal digits and shorter bars at avoided terminal digits. The procedure involves both sexes displayed in the same graph, which then enables us to detect the gender-specific propensity of age misreporting.
Detecting age heaping through a population pyramid can only tell the overall pat- terns of digit preferences prevalent in the Eritrean survey. However, the magnitude of age heaping is yet to be known at this stage.
Figure 1 illustrates the age–sex structure of the EPHS 2010. The figure reveals no- ticeable patterns with strong propensity particularly at certain ages. The choice of ages stated in the survey was not entirely random. This fact can be easily verified by quickly scanning the pyramid: misreporting mostly occurred at regular patterns. The pattern of the pyramid – that is known as hedgehog distribution (Boonstra [2011]) at the ten-year and five-year interval – displays irregularities. This phenomenon is characterised by exhibiting single-year age distribution of adjacent digits and sizeable discrepancies in magnitude. For both sexes, the irregularities persist even to the old ages.
Figure 1. Population pyramid by single year of age, 2010 Eritrea (EPHS)
70 60 50 40 30 80
Male respondents Female respondents
100 90
20 10
0
0.00 0.25 0.50 0.75 1.00 1.25 1.50 1.75 0.00
0.25 0.50 0.75 1.00 1.25 1.50 1.75
Source: EPHS 2010 data.
2.3. Demographic techniques of measuring age heaping
This section presents the description of demographic methods that have been em- ployed in measuring the accuracy of age and sex data.
Age
Percentage of population
To gauge the accuracy of age reporting, various techniques are proposed in litera- ture. They are used for measuring irregularities in age data. The most common tech- niques include the calculation of Whipple’s index, Myers’ blended index as well as the modified Whipple’s index. These indices reveal the degree of preference or avoidance of certain terminal digits.
In the present study, Turner’s hypothetical ranking has been applied to assess the patterns of the heaping format with the proposed ranking of terminal digits. Addi- tionally, Whipple’s index and Myers’ blended index have been used to assess the degree of erroneousness in age reporting by the respondents in EPHS 2010 data.
2.3.1. Turner’s hypothetical ranking
Turner [1958] proposed a hypothetical ranking of preferences of individuals re- porting their age (numerical data), with highest terminal digit preferences in order of 0, 5, and 2 in censuses in Western countries at the time of survey. Next to the most preferred digits (0 and 5), even terminal digits were favoured, followed by terminal digits 3 and 7. The most avoided terminal digits were 1 and 9. First, Turner [1958]
graphically displayed the heaping formats for all the digits and made a calculation of the rank of each terminal digit of age using Spearman’s rank correlation coefficient (ρ). Then, the observed rank order was compared with the expected rank from the hypothesis. A significant corpus of literature has cited Turner’s [1958] approach; this includes studies by Stockwell–Wicks [1974] and Ewbank [1981]).
Table 3 reports the hypothetical ranking proposed by Turner [1958]. This methodology was applied particularly for Western nations at the time of its develop- ment. Today age heaping can be ruled out in the developed countries but the quality of age data is still a perennial cause of concern in the less developed countries.
Table 3 Turner’s hypothetical ranking
Digit 0 1 2 3 4 5 6 7 8 9
Turner’s ranking 1 9.5 3.5 7.5 4.5 2 4.5 7.5 3.5 9.5
Source: Turner [1958].
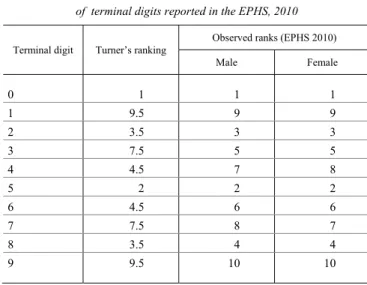
Table 4 presents the calculation of Spearman’s correlation (ρ) between Turner’s ranking and the observed ranks of terminal digits reported in the EPHS 2010. ρ was 0.89 for male respondents, 0.85 for female respondents, and highly significant for both. Thus, Turner’s hypothetical ranking fairly describes the patterns of age heaping in the 2010 Eritrean survey.
Table 4 Comparison of Turner’s hypothetical ranking with preferences
of terminal digits reported in the EPHS, 2010
Terminal digit Turner’s ranking Observed ranks (EPHS 2010)
Male Female
0 1 1 1
1 9.5 9 9
2 3.5 3 3
3 7.5 5 5
4 4.5 7 8
5 2 2 2
6 4.5 6 6
7 7.5 8 7
8 3.5 4 4
9 9.5 10 10
Source: EPHS 2010 data.
2.3.2. Whipple’s index
Whipple’s index is a measure of digit preference proposed by the American de- mographer George Chandler Whipple. The magnitude of preference for avoidance of a certain terminal digit can be detected by various indices (Siegel–Swanson [2004]).
This index is a commonly employed index to measure age misreporting.
Whipple’s index is the ratio of the total number of individuals between the ages of 23 and 62 years who have reported their age ending in 0 and 5 to one-fifth of the entire population in the same age group, multiplied by 100. It offers the comparative inclination for digits 0 and 5 and is calculated as:
Whipple’s index =
2325 2430 2535 6260
5 ....
.... 100
N N N N
N N N N
, /1/
where Nx is the population of age
x
.To assess age data terminating with 0 – that is, 30, 40, 50, and 60 – the index is computed as:
Whipple’s index =
23 3024 4025 50 6062
10 100
....
N N N N
N N N N
. /2/
To assess age data terminating with 5 – that is, 25, 35, 45, and 55 – the index is computed as:
Whipple’s index =
23 2524 3525 45 6255
10 100
...
N N N N
N N N N
. /3/
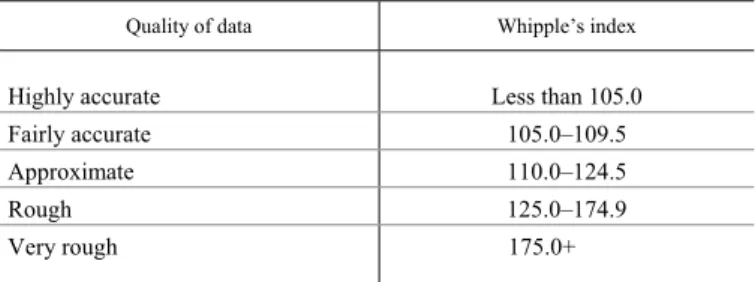
The range from 23 to 62 years is essentially subjective. Young and old ages are of- ten omitted in calculating indices of heaping, as they are more likely to be prone to other types of misreporting errors than the ones caused by preference for particular terminal digits. Mostly early ages (0 to 4 years of age) are understated, whereas older ages (60 and above) may be overstated, and due to high mortality, there are less per- sons in these age groups than in other ones (UNFPA [2016]). If there is no heaping at terminal digits 0 and 5 in ages reported, the index will be 100. If all reported ages of respondents end with 0 and 5 (i.e. complete heaping), the index will have a maximum value of 500. In our research, we have used a Whipple-index-based scale (Siegel–
Swanson [2004]) to assess the degree of consistency of age data. (See Table 5.)
Table 5 Accuracy of age reporting based on Whipple’s index
Quality of data Whipple’s index
Highly accurate Less than 105.0 Fairly accurate 105.0–109.5
Approximate 110.0–124.5 Rough 125.0–174.9 Very rough 175.0+
Source: Siegel–Swanson [2004].
Table 6 presents the Whipple’s index values to measure the extent of age heaping in the EPHS 2010. The age data of 151,210 individuals from 34,423 households were collected.
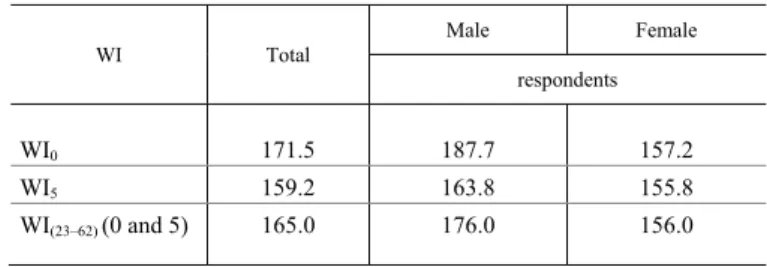
The total population for the age group 23–62 is 52,319. Among them, the popula- tion reporting age ending with 0 was 19,419, which accounts for 17.9%, while those reporting age with the terminal digit of 5 were 14,348 (13.2%). Thus, according to Table 6, Whipple’s index for the 10-year age range, that is, for those reporting age with terminal digit 0, was 171.5 (187.7 for male and 157.2 for female respondents).
While the quality of data was coarse for both sexes, male respondents tend to prefer terminal digit ‘0’ more than their female counterparts.
Table 6 Whipple’s index for terminal digits 0 and 5 reported in the EPHS, 2010
WI Total Male Female
respondents
WI0 171.5 187.7 157.2 WI5 159.2 163.8 155.8
WI(23–62) (0 and 5) 165.0 176.0 156.0
Note. WI: Whipple’s index.
Source: EPHS 2010 data.
Whipple’s index for the five-year range, that is, for those reporting age with ter- minal digit 0 or 5, was 165 (176 for male and 156 for female respondents).
The overall quality of age data was rough. A possible explanation of the gender dis- parity in age heaping could be that 81% of the responses from the households (proxy responses for men about their age) were provided by female respondents.
2.3.3. Myers’ blended index
Myers’ blended index is a time-honoured indicator of age heaping. It is a modifi- cation of the index of dissimilarity that summarises the deviancy of any observed data on age reporting from a distribution that is expected under a particular model (Pullum–Staveteig [2017]).
This index avoids the inherent biases of Whipple’s index (i.e. it does not include all digits except for 0 and 5) to measure age data for some heaping or preference. Myers’
index plays the role of balancing the proportion of individuals that would have to be moved from the inflated category to the deflated category for obtaining the expected distribution. Myers’ blended index is calculated for ages within 10–89 years.
The method for calculation is as follows:
1. Sum the population ending in each terminal digit over the entire range from the ages 10–89; e.g. 10, 20, 30, …, 80; 11, 21, 31, …, 81.
2. Sum the population ending in each terminal digit over the entire range from the ages 20–89; e.g. 20, 30, 40, …, 80; 21, 31, …, 81.
3. Multiply the sum of ages at each terminal digit in 1. above by weights 1, 2, 3, 4, 5, 6, 7, 8, 9, 10.
4. Multiply the sum of ages at each terminal digit in 2. by weights 9, 8, 7, 6, 5, 4, 3, 2, 1, 0.
5. Add the product of 3. and 4. to obtain the blended population at every terminal digit.
6. Convert the distribution in 5. into percentages for each terminal digit.
7. Take the deviation of the percentage of each digit from 10%
(i.e. theoretical distributions) (Siegel–Swanson [2004]).
Table 7 Calculation of preference indices for terminal digits
by Myers’ blended method, for the entire population, 2010
Terminal digit (a)
Population with terminal digit Weight for Blended population
Deviation from 10%
(%) (7)=(6)–10%
Ages 10 + (a)
(1) Ages 20 + (a)
(2) Column 1
(3) Column 2 (4)
Number (5)=(1)*(3)+
+(2)*(4)
Percentage distribution
(%) (6)
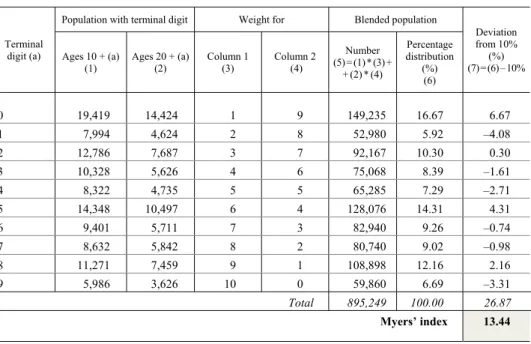
0 19,419 14,424 1 9 149,235 16.67 6.67 1 7,994 4,624 2 8 52,980 5.92 –4.08 2 12,786 7,687 3 7 92,167 10.30 0.30 3 10,328 5,626 4 6 75,068 8.39 –1.61 4 8,322 4,735 5 5 65,285 7.29 –2.71 5 14,348 10,497 6 4 128,076 14.31 4.31 6 9,401 5,711 7 3 82,940 9.26 –0.74 7 8,632 5,842 8 2 80,740 9.02 –0.98 8 11,271 7,459 9 1 108,898 12.16 2.16 9 5,986 3,626 10 0 59,860 6.69 –3.31 Total 895,249 100.00 26.87 Myers’ index 13.44
Note. Deviation from 100.00 results from rounding.
Source: EPHS 2010 data.
Table 7 reports the calculation of Myers’ blended index for the entire population.
Using this index, a 14.1% deviation was found for male respondents and a 12.9%
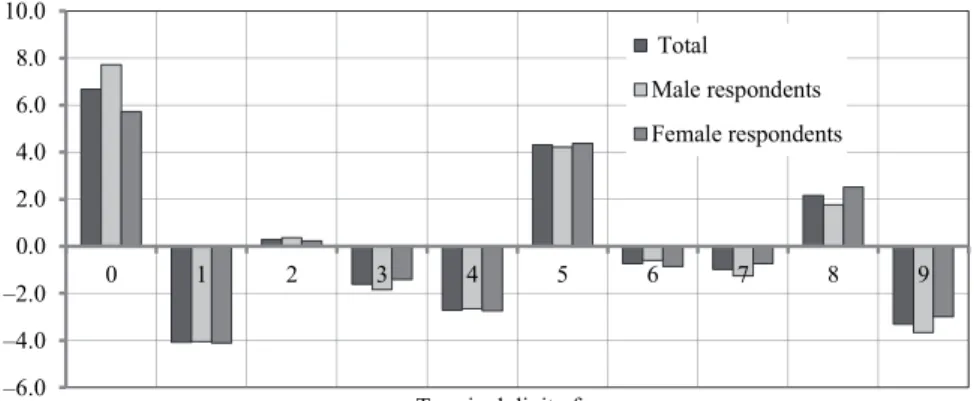
deviation for female respondents. Moreover, 13.5% of misreported data for both genders. The highest positive deviation was witnessed for the terminal digit 0 (6.7%), followed by terminal digit 5 (4.3%). Contrariwise, the highest negative devi- ations were spotted in terminal digit 1 (4.1%), followed by 9 (3.3%).
Table 7 reports that the highest preference was for terminal digits 0 and 5.
The negative figures indicate avoidance of a particular terminal digit.
Figure 2 illustrates the percentage deviations of the blended population from 10 (expected distribution) along each terminal digit. The most favoured terminal digits in reporting age were 0 and 5, while the most shunned were particularly 1, 9, and to a lesser degree, terminal digit 4.
Figure 2. Myers’s index by terminal digit of age, 2010
–6.0 –4.0 –2.0 0.0 2.0 4.0 6.0 8.0 10.0
0 1 2 3 4 5 6 7 8 9
Terminal digit of age Total
Male respondents Female respondents
Source: EPHS 2010 data.
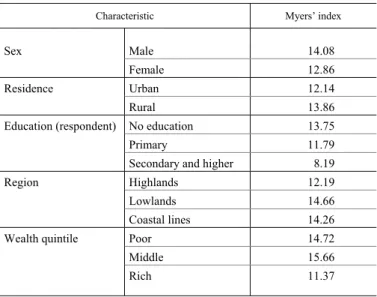
Table 8 presents the socio-demographic differentials in reporting of ages using Myers’ index to determine their levels of misreporting. As shown in the table, the gender gap in reporting marginally favours female (MI1 = 12.86) to male respondents (MI = 14.08). This finding conflicts with the conventional wisdom that women in developing countries are well behind men in numeracy and in stating their ages accu- rately. However, this finding is by no means comprehensive until the quality of age data for women is evaluated based on only unmarried women.
We found urban–rural variations in age misreporting. Rural respondents (MI = 13.86) tend to misreport their ages more than their urban counterparts (MI = 12.14). There are also regional disparities in age reporting based on Myers’
index. Generally, the accuracy of age statistics was higher for the highland popula- tion (MI = 12.19) which is characterized by higher literacy rates compared with the lowland (MI = 14.66) and Red sea coastal lines (MI = 14.26) populations.
Socio-economic factors were assessed through the educational level of the house- hold respondent and the relative economic standing of the household as expressed in their wealth quintiles. Table 8 also reveals that an increase in educational level of the household respondent reduces the level of age misreporting. Those with no education (MI = 13.75) show higher misreporting compared with primary (MI = 11.79) and
1 MI: Myers’ index.
secondary and higher educated (MI = 8.19) respondents of other households.
An increase in relative economic standing of the household also indicates minor improvement in age reporting, as indicated by the higher MI value (14.72) for the poor compared with the rich (MI = 11.37).
Table 8 Socio-demographic variations in quality of EPHS age reporting, 2010
Characteristic Myers’ index
Sex Male 14.08
Female 12.86 Residence Urban 12.14
Rural 13.86 Education (respondent) No education 13.75
Primary 11.79 Secondary and higher 8.19
Region Highlands 12.19 Lowlands 14.66 Coastal lines 14.26
Wealth quintile Poor 14.72
Middle 15.66 Rich 11.37
Source: EPHS 2010 data.
Table 9 Comparison of indices for Eritrea and selected African countries Country Year Whipple’s index Myers’ index
Eritrea* 2010 167 14
Somalia 2014 227 22
Ethiopia** 2000 140 12
Kenya 2009 147 7
Sudan 2008 239 23 South Sudan 2008 174 16
Uganda 2002 135 8
Rwanda 2002 107 2
* Derived from EPHS 2010.
** Derived from Bekele [2006].
Source:UNFPA [2016].
Table 9 reports the comparison of Whipple’s and Myers’ indices for selected African countries with respect to Eritrea. Age heaping, especially at terminal digits 0 or 5, is a pervasive African phenomenon. All Whipple’s values, except for that of Rwanda (WI2 = 107), lie in the range of either rough or very rough data quality ac- cording to the United Nations’ proposed cut-off scores of accuracies of ages.
The relative standing of age data quality of the Eritrean survey (WI = 167) resembles the scores of other African nations. Myers’ index values refer to the percentage of individuals who reported their ages incorrectly. For instance, for Eritrea, 14% of all individuals misreported their ages as opposed to only 2% for Rwanda.
3. Conclusion
We studied the accuracy of age data reported by respondents in the EPHS 2010.
We analysed the subject from multiple angles to test the quality of age reporting, starting from single-year age data and the corresponding graph, to measuring age heaping values using Myers’ blended index, Whipple’s index, and Turner’s ranking on the Eritrean survey.
Whipple’s index for the survey was 172 for the decadal age band (terminal digit 0), and 165 for those who reported age with terminal digits 0 or 5. Thus, age statis- tics had rough quality of data; age heaping in the Eritrean survey follows the classic patterns at ages with terminal digits 0 or 5, similar to previous surveys (Pardeshi [2010], Bailey–Makannah [1996], Agrawal–Khanduja [2015]).
Myers’ blended index for the EPHS 2010 indicates that a minimum of around 14% of all individuals in the survey misreported their ages with an incorrect terminal digit. Turner’s hypothetical ranking also showed high correlation with reported ages in the EPHS 2010, with the Spearman’s rank correlation coefficient being 0.89 for male and 0.85 for female respondents. Thus, Turner’s ranking fairly describes the patterns of age heaping in the EPHS 2010.
Based on the analysis of the graphical and demographic indices, we can state that the Eritrean survey conducted in 2010 was plagued with age misreporting. The sys- tematic tendency of favouring certain terminal digits, such as those ending in 0 or 5, and to a lesser extent even numbers, can indicate the level of numeracy and degree of awareness of one’s age in the Eritrean society.
Higher values of the measures of age heaping at certain preferred ages might be associated with high innumeracy and illiteracy levels. The current state of age re- porting of the survey was very rough, which reflects the results of surveys from many developing countries. The reason for this may be that the information of the
2 WI: Whipple’s index.
entire household was provided by one person – the household respondent. Hence, the odds of misreporting could be higher.
Understandably, the quality of age data is an important facet of demographic es- timation. Thus, any bias with regard to this variable can lead to erroneous conclu- sions. Inventive measures should be implemented, starting from data collection all the way through the final stages to safeguarding the quality of age data.
Regarding the execution of surveys, it is highly recommended that extra checking mechanisms are developed and implemented throughout the data collection process.
Though demographic and health surveys are recognized for their quality standard procedures, there is always room for progress, especially in surveys conducted in less developed countries.
4. Policy and future recommendations
Many recommendations can be suggested based on our findings. First, greater scru- tiny should be enforced throughout the implementation of future surveys. Even with demographic and health surveys, improvements are critical, especially in less devel- oped countries such as Eritrea which have obvious prevalence of age irregularities.
Second, survey implementers should consider using the technique of referencing national, religious, or historical landmarks for estimating age to improve the accura- cy of age statistics in surveys and censuses. Concerted effort should be made to au- thenticate data collected in surveys with additional sources of data, such as Civil Registration and vital statistics or other social services records. Possibly, the anoma- lies in the reported age data can be adjusted by standard smoothing procedures to mitigate some of the adverse consequences of misreporting. Due emphasis should be placed on making birth registration compulsory, and awareness sensitising cam- paigns should be organised regularly to highlight the significance of correct age data in our daily life.
We explored the prevalence of age heaping problems in less developed countries, such as Eritrea. We established a preliminary step to a comprehensive plan on the issue. Our work contributes to the extant literature by expounding the importance of household background characteristics as potential determinants of digits preference, and by relating the prevalence of age heaping to educational level of the household head and/or respondent.
Future research should strive to identify more factors between cultural, familial, and demographic scopes, as well as the degree of age misrepresentation. Assessing age heaping in Eritrean surveys among women based on their marital status, as well as among different ethnic groups, is prospective subject of research.
References
A’HEARN,B.–BATEN,J.–CRAYEN,D. [2009]: Quantifying quantitative literacy: age heaping and the history of human capital. The Journal of Economic History. Vol. 69. No. 3. pp. 783–808.
https://doi.org/10.1017/S0022050709001120
AGRAWAL,G.–KHANDUJA,P. [2015]: Influence of literacy on India’s tendency for age misreport- ing: evidence from Census 2011. Journal of Population and Social Studies. Vol. 23. No. 1.
pp. 47–56. https://doi.org/10.14456/jpss.2015.1
BAILEY,M.–MAKANNAH,T.J. [1996]: An evaluation of age and sex data of the population census- es of Sierra Leone: 1963–1985. Genus. Vol. 52. Nos. 1–2. pp. 191–199.
BEKELE,S. [2006]: Analysis on the quality of age and sex data collected in the two population and housing censuses of Ethiopia. Ethiopian Journal of Science. Vol. 29. No. 2. pp. 123–132.
BOONSTRA, O. [2011]: A Method for Calculating the Strength and Shape of Age Heaping.
https://doi.org/10.13140/RG.2.1.1618.2649
EWBANK,D. [1981]: Age Misreporting and Age-selective Under-enumeration: Patterns and Con- sequences for Demographic Analysis. Report of the Committee on Population and Demogra- phy. National Academy Press. Washington, D.C. https://doi.org/10.17226/19649
JOWETT,A.J.–LI,Y. [1992]: Age-heaping: contrasting patterns from China. Geo-Journal. Vol. 28.
No. 4. pp. 427–442.
KPEDEKPO,G.M.K. [1982]: Essentials of Demographic Analysis for Africa. Hernerman Educa- tional Books, Inc. London, Exeter.
MUKHOPADHYAY,B.K.–MUKHERJEE,B.N. [1988]: A study of digit preference and quality of age data in Turkish censuses. Genus. Vol. 44. Nos. 1–2. pp. 201–227.
MYERS,R.J. [1940]: Errors and bias in the reporting of ages in census data. Transaction of the Actuarial Society of America. Vol. XLI. Part 2. No. 104. pp. 411–415.
NATIONAL STATISTICS OFFICE (ERITREA)–FAFO-AIS(FAFO INSTITUTE FOR APPLIED INTERNATIONAL
STUDIES) [2013]: Eritrea Population and Health Survey 2010. Asmara.
PAL,J.K.–MUKHOPADHYAY,B.K.–TEWARI,H.R. [2015]: Age reporting error and effect of edu- cation: a village study. American Journal of Social Science Research. Vol. 1. No. 3.
pp. 158–162.
PARDESHI,G.S. [2010]: Age heaping and accuracy of age data collected during a community sur- vey in the Yavatmal district, Maharashtra. Indian Journal of Community Medicine. Vol. 35.
No. 3. pp. 391–395.
PULLUM,T.W.–STAVETEIG,S. [2017]: An Assessment of the Quality and Consistency of Age and Date Reporting in the DHS Surveys, 2000–2015. DHS Methodological Reports. No. 19. Inner City Fund. Calverton. http://dhsprogram.com/pubs/pdf/MR19/MR19.pdf
SIEGEL, J.S. –SWANSON, D.A. [2004]: The Methods and Materials of Demography. Second Edition. Elsevier Academic Press. San Diego.
SPOORENBERG,T. [2009]: Assessing the Quality of Age Reporting at a Time of General Data Quali- ty Improvement: Going beyond the Original Whipple’s Index. Paper presented at the XXVI IUSSP (International Union for the Scientific Study of Population) International Population Conference. 27 September – 2 October. Marrakech.
STOCKWELL,E.G.–WICKS,J.W. [1974]: Age heaping in recent national censuses. Biodemography and Social Biology. Vol. 21. No. 2. pp. 163–167.
TURNER,S.H. [1958]: The Pattern of Heaping in the Numerical Data. Proceedings of the Social Statistics Section. American Statistical Association. Washington, D.C. pp. 248–251.
UNFPA(UNITED NATIONS POPULATION FUND) [2016]: Methodology and Assessment of Data Qual- ity of the Somali People. https://www.academia.edu/29092438/Methodology_and_
Assessment_of_Data_Quality_of_the_Somali_People

