73 ACTA CLASSICA
UNIV. SCIENT. DEBRECEN.
LVI. 2020.
pp. 73–97.
FRAMEWORKS OF REFERENCE IN THE IDENTIFICATION OF LATIN DIALECTS
1BY ATTILA GONDA
MTA Research Institute for Linguistics, Budapest gonda.attila@nytud.hu
Abstract: Various studies proved that the methodology of J. Herman produces plausible and veri- fiable results in the field of Latin dialectology, but certain methodological questions remained still unanswered regarding our points of reference in the decision which proportions of the data of the inscriptional faults are classified significant; how to decide on the basis of the proportion of a certain error type if a certain linguistic change was in progress, if it was completed, or if it was not active in the examined territory; which types of errors can serve as base or bases of comparison for a specific examined error type; which periods and territories should be the point of reference in comparisons. In the present study, we attempt to give answers to these questions by running statis- tical surveys using different points of reference in statistical significance and different bases of comparisons in the error types, and we set up a list of expected results based on the known tenden- cies of sound changes in Vulgar Latin against which we will measure the actual results of the survey in order to determine which methods were the most effective in meeting the expected pic- ture that we already know about the development of Romance languages.
Keywords: vulgar Latin, dialectology, methodology, regional diversification, phonology, inscriptions
Introduction and methodology
After the incomplete and erroneous approaches of scholars like P. A. Gaeng, W.
Omeltchenko, J. L. Barbarino and J. N. Adams,2 a functioning methodology for sta- tistical analyses in inscriptional Latin dialectology was devised by J. Herman and improved by B. Adamik,3 which resulted in the establishment of the Computerized
1 The present paper was prepared within the framework of the project NKFIH (National Research, Development and Innovation Office) No. K 124170 titled “Computerized Historical Linguistic Database of Latin Inscriptions of the Imperial Age” (see: http://lldb.elte.hu/) and of the project entitled “Lendület (‘Momentum’) Research Group for Computational Latin Dialectology”
(Research Institute for Linguistics of the Hungarian Academy of Sciences).The author expresses his gratitude to Dr. Dorottya Virág Mák for her valuable assistance in the tables and statistics.
2 These methods are applied in their works, see Gaeng 1968, Omeltchenko 1977, Barbarino 1978 and Adams 2008. The refutation of their methodology is found in Adamik 2012.
3 See the detailed explanation of the methodology in Herman 2000b and Adamik 2012.
74
Historical Linguistic Database of Latin Inscriptions of the Imperial Age or (also known as “Late Latin Database”, and henceforward abbreviated as LLDB).4 In the previous years, various studies proved that the Herman-methodology is capable of producing plausible and verifiable results in the field of Latin dialectology, but cer- tain inherent problems in this methodology presented themselves, as well. In linguis- tic analyses conducted according to the Herman–method, a certain misspelling within a given territory is measured and compared to other types of misspellings in the same territory or in several other territories. However, since the proportions of a certain misspelling may be greatly varied in different territories of the empire and can further vary through time, a significant problem emerges regarding our point of reference in comparisons: what degree of the proportion of a certain misspelling in a given territory can be considered low or high, weak or intensive? Which geograph- ical areas and which periods of time should be the point of reference in comparisons?
Does the average proportion of that certain phenomenon, if counted from the totality of the data of the entire empire, suffice as an “imperial average” to serve as a neutral point of reference? Which types of errors can a linguistic phenomenon be measured against? These questions are of highest importance, because in the study of Latin dialectology the linguistic variations and changes always manifest themselves over the course of time, and the researcher needs to know not only whether a certain phe- nomenon was prominent in a given period, but also whether it is prominent in com- parison to other periods and to the other territories of the empire. In order to look closer into these methodological questions, we will conduct an experimental analysis in this paper with different statistical methods.
From the testimony of the documented Romance languages, we have a fairly complete knowledge about the different results of certain Latin sound changes in different parts of the Roman empire, even though in many cases the time or the exact place of origin, the progress or other details of the sound change are still unclear. However, these generally well-known regional results of a sound change in the Romance languages can allow us to make very probable predictions about the intensity of phenomena related to the specific Vulgar Latin sound change in areas of the empire where that specific sound change has occurred, which means that, according to the Herman–method, we can logically expect a higher proportion of certain misspellings related to that specific sound change in areas where the surviving Romance language inherited that sound change, and we can expect lower proportions of the same kind of misspelling where the local Romance language did not inherit it. If we select some very characteristic Vulgar Latin sound changes which resulted in different outcomes in different Romance languages, and about which outcomes we have reliable knowledge from all Romance languages, we can
4 Web address is given in note 1.
75
set up the list of those Roman provinces where we would expect higher and lower proportions of inscriptional faults related to the selected sound changes. Thus we will obtain a way to measure the effectivity of different statistical methodologies:methods which are able to demonstrate high proportions in those provinces where we expect to have higher values, and low proportions where we expect low, can be considered successful methods. The more provinces a method identifies with high proportions or low proportions according to our expectations, the better the method is. The best statistical method of dialect identification will be the one which will have the best scores in matching the expected list of provinces. In order that our conclusions be as uncompromised as possible, we exclude those provinces from the list of expected results where the presence and degree of the examined sound change is unknown or highly uncertain, and we analyze them separately, because in many of them certain outcomes are still more plausible than others, and if our results confirm a more plausible outcome, we can add this as corroborating evi- dence to the efficacy of the given statistical method.
1.1. Testing criteria of provinces
According to the principles that we have laid down, our first step is to select those ubiquitous and linguistically very well-known and very well evidenced phenomena from the history of Romance languages which will serve as sub- jects of our experiment on methodology. In this study, we choose to examine four characteristic Vulgar Latin sound changes, two of which were universal, and two of which were specific only to certain dialects which later became different Romance languages. The monophthongization of the /ae/ diphthong into simple /e/, and the loss of word ending /-m/ were Pan-Romance phenom- ena. We can measure the general degree of Vulgar Latin development with these. The loss of word final /-s/ and the change of the stressed short /u/ velar vowel to /o/ are dialect specific: Romance languages north of the Massa–Seni- gallia line plus Sardinia originally retained the word ending /-s/, Southern and Eastern Romance lost it, and during later developments almost all Northern Italian dialects lost it, as well.5 We differentiate these as Western and Eastern Vulgar Latin, or later, Western and Eastern Romance dialects. The stressed short /u/ in most contexts changed6 to /o/ in the aforementioned Western Vulgar Latin, and it changed to /o/ also in the Vulgar Latin of the entire Italian penin- sula, therefore part of the Eastern Vulgar Latin block belongs here, too. We call this extended Western block the Italo–Western group. On the other hand, the
5 More about the elimination of the word-final /-s/, see Adamik 2017b.
6 Tamás 1983, 45–48 on the various developments of the velar vowels.
76
stressed short /u/ was persevered in the rest of the Eastern group, and we call this diminished Eastern group as Balkan Romance or Balkan Vulgar Latin block. Within this block, Dalmatia was a mixed territory between the Italo–
Western and the Balkan dialects, because the Dalmatian languages did not pre- serve the stressed short /u/ in open syllables, but it merged with the /o/ the same way as it did in the Italo–Western group. Sardinian Vulgar Latin, where none of these vowels merged, will be grouped together with the Balkan Vulgar Latin block, because the stressed short /u/ has the same outcome here. African Vulgar Latin is usually supposed to have had the same vowel system as Sardinia, there- fore we put it in this second group, as well.
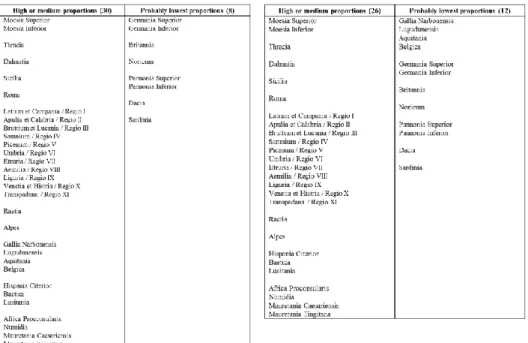
After the selection of the dialect-differentiating sound changes, the second step is to categorize the provinces according to the expected outcomes of the statistical survey: where do we expect higher and where lower proportions according to the Romance dialectal classifications detailed in the previous paragraph. We exclude the Greek speaking provinces from the analysis, although we include Thracia be- cause large parts of it were on the Latin speaking side from the Jireček Line which divides the Latin and Greek speaking provinces of the empire. The expected sta- tistical results of the provinces are shown in Tables 1–2 below:
Table 1. Expected results for the /-s/ > ø faults
77
Table 2. Expected results for the /ú/ > O faults
The allocation of most of the provinces in Tables 1–2 above does not require fur- ther explanation, but we must say a few words about some of them. Moesia Infe- rior, Superior and Thracia did not bequeath Romance languages to us, but accord- ing to some theories,7 Romanian language might have been (in part) originated in the territories of Thracia and Moesia. This — and their geographical vicinity which makes their linguistic similarity more likely — is the reason why we group them together with Dacia. As for Raetia, although Rhaeto-Romance dialects exist, they are not exactly covering the ancient territory of Raetia, therefore we relied only on the assumption that Rhaeto-Romance is (in part) a descendant of Raetian Latinity, but the theory that links ancient Raetian language to the Etruscan language also connects Raetian Latinity to Northern Italian Vulgar Latin which had a significant Etruscan substrate. Africa Proconsularis, Numidia, Mauretania Caesariensis and Tingitana are always grouped together, because when our sources speak about “Af- rican Latinity”, we do not know if this could refer to other African provinces or just to Africa Proconsularis (as “African” usually refers to that province alone).
Again, their vicinity and similarity in culture bring us to categorize them together,
7 About the possible origin of Romanian language from the south of the Danube, Thracia, Moesia Inferior and Superor and even Pannonia Inferior, see Rosetti 1978 77, 215, Izzo 1986, 144–
145 and Schramm 1997, 326, 340–342.
78
but we expect differences at least in the case of the two Mauretaniae which are very close and socio-politically very connected to the Iberian Peninsula and could have been influenced by Ibero-Romance tendencies (and vice versa). In the classi- fication of /-s/ dropping and /-s/ keeping territories, the African provinces are marked as “unknown”, but there have been indications that African Latinity might have been characterized by /-s/ dropping,8 so these provinces are labelled as “prob- ably high” regarding the proportion of word-final /-s/ elimination. The two Ger- maniae, Britannia, and the two Pannoniae and Noricum are always put into the
“unknown” category, because there is no surviving Romance language in these territories, and we generally know very little about their Vulgar Latin. We can sup- pose that Pannonia Inferior, Superior and Noricum were linguistically somewhere between the Northern Italian and the Balkan Vulgar Latin,9 their degree of /-s/
elimination was probably high as they are Eastern provinces, and because both Northern Italian and Balkan dialects eliminated the /-s/. With respect to the /ú/ > O phenomenon, they probably should produce low proportions, because all Balkan Romance languages were conservative regarding this change, however, we can expect the Pannoniae and Noricum to be more intensive in this phenomenon, be- cause this is more intensive in the neighbouring Dalmatia, and even more intensive in Raetia and Northern Italy. The case of the Germanic provinces and Britannia is very similar, they are classified as “unknown”, but as the Germaniae are neigh- bours to the Gallic provinces and Britannia is both close to Gallia and is of Celtic substrate like Gallia, it seems plausible for me to expect them to give similar results like the Gallic provinces, therefore they are expected to give higher or lower pro- portions in concert with the Gallic provinces.
The situation with the elimination of the word-final /-m/ and the E~AE confu- sions is both simpler and more complicated. Simpler, because as pan-Romance phe- nomena we expect them to be mostly invariable across the provinces, but more com- plicated, because they evidently are not entirely uniform, and there were a number of historical and cultural factors which caused these errors to increase or decrease in certain provinces. Nevertheless, we will expect them to be largely within the cate- gory of high and medium degree of proportion, but we set apart the Gallic provinces in the case of the /-m/ dropping, which we expect to be somewhat less intensive, more conservative, due to the fact that Gallo-Romance retained the distinction be- tween nominative and accusative cases, even if not by preserving the singular accu- sative ending “-m”, but by keeping the singular nominative “-s” endings. For speak- ers of the Gallic Vulgar Latin, observing the different orthography — even if not the
8 Adamik 2017b doesn’t prove this but the discussion of frequent /-s/ omissions points to this direction.
9 Gonda 2017a and 2017b.
79
pronunciation (but to a certain degree, maybe that, too) — for singular accusatives with the word ending “-m” was probably easier, and consequently we can expect a better retention ratio for the singular accusative word ending “-m” in the Gallic prov- inces. Because it is possible to give an easy justification about them, we also expect the isolated provinces, the islands, and those troubled frontier provinces to have a lower degree in these two pan-Romance phenomena, where Latin was not continued after the collapse. This includes Dacia, because it was not only relatively isolated from the rest of the empire, but also the shortest living province, Britannia (both an island and a less Romanized,10 stormy province) and Sardinia (the latter one being not only an island, but also the most conservative territory regarding sound changes), the two Germaniae (in case of the /-m/ dropping, the influence from Gallia and their partially shared population is also an argument), the two Pannoniae and Noricum, all of which are war zones, and their inhabitants — we might suppose — probably weren’t latinized enough to keep Latin as their language. The result can be seen in Tables 3 and 4:Table 3. Expected results for the /ae/ > E faults Table 4. Expected results for the /-m/ > ø faults Note: Here the lowest proportions are not expected but allowed, as there can be a justification for their low degree.
10 Gutkind 1971, 146–148 demonstrates a low degree of Romanization in Britain.
80
In the case of the AE > E and -M dropping faults, as these were pan-Romance phenomena, and our analysis is focused on showing if they were present in all provinces with a relatively uniform proportion, we don’t explicitly look for where they are higher and where lower than the imperial total or average by provinces or the proportion of Classical Rome, but we expect them to be more uniform, and we are only registering the extremely low proportions, those prov- inces where the activity of this process didn’t seem to reach the normal level in the empire. In order to find the extremely low proportions, we calculate the value of population standard deviation11 from the average of the provinces, and we register those provinces which have a lower value than the lower limit of the standard deviation. Scores are given for those provinces which fall in the ex- tremely low (under standard deviation) category but are indeed expected to be in the low category according to Tables 3–4.
1.2. Points of reference in measuring the significance of error proportions
The third necessary step before we could run our survey is to determine some universal, empire-wide points of reference in respect to which a certain propor- tion of inscriptional faults can be considered higher or lower. The “imperial av- erage”, i.e. the average proportion of a certain phenomenon in the empire, counted from the totality of the data of the entire empire, was already applied in a number of studies12 as a basic point of reference to determine the degree of intensity of the phenomenon. It is obvious that, when we investigate faults in the inscriptions which are of different degrees of frequency in the various provinces of the empire, we need to determine what degree of frequency is significantly high. We need to know what the average proportion of that phenomenon was in the Latin speaking world. In previous attempts, researchers used the total number of mistakes in the inscriptions of the whole Roman empire for the purpose of counting the average proportions of various linguistic phenomena: we took all kinds of data from all provinces and counted the proportion of the misspellings indicating final /-s/ or /-m/ drop or the degree of /ae/ monophthongization or the stressed short /u/~/o/ merger, and we compared the same types of spelling faults to these imperial average numbers.
11 Standard deviation is a statistic measure of dispersion in a frequency distribution, equal to the square root of the mean of the squares of the deviations from the arithmetic mean of the distribution. The population standard deviation is a parameter, which is a fixed value calculated from every individual value in the “population” (data values).
12 For example, in Adamik 2017b or recently in Gonda 2019.
81
What might be the problem with this method? It completely neglects the fact that certain provinces or Italian regions, or the city of Rome, which is treated as a region, too, produce so high numbers of data that they overshadow the data of the majority of the provinces of the empire. It wouldn’t be a problem if we didn’t want to count a mean value of a certain misspelling for the purpose of using it as a point of reference, the geographical average of the regional diversification of Vulgar Latin variants. This method does give an average: the mean value of a certain misspelling per the total number of Latin speakers; however, not the mean value of the regional variants of Latin, but the mean value of all Latin speakers.To give a clear and very simplified example: let’s imagine an empire consisting of two provinces, Province A and Province B. If the proportion of 250 misspell- ings caused by a sound change X to the 500 total data of all kinds of spelling faults is 50% in Province A, and the same value is 14% in Province B, where 10 of the same faults are measured to 70 total number of errors, then by counting the imperial average we have to add up 250 plus 10, the number of all faults indicating sound change X and divide it by 500 plus 70, the number of the total number of all types of errors in both territories. The result is 46%. It’s so high because Province A (which had 50%) overshadowed Province B with its great number of data. The value we got here is the value of the average degree of sound change X per speakers, represented by the inscriptions they erected. The average form of vernacular as the theoretical middle ground between the two dialects of this experimental empire isn’t realistically represented by this percentage. 46%
represents only Province A and its strong 50% value. Province B which had 14%
has almost disappeared in the result. 46% is not a mean value of the two dialects, but a mean value of all inscriptional faults, and thus, of all speakers who made them, and because Province A has probably more speakers, the dialect of Prov- ince B is relegated to insignificance and doesn’t affect the value of the average.
Province A Province B Errors indicating sound change X 250 data = 50% 10 data = 14%
Total number of errors 500 data = 100% 70 data = 100%
Imperial total average by totality of data 260/570 = 46%
Average by provinces of the empire 50% ~ 14% = 32%
Table 5. Counting the “imperial average” with two different methods
What could be the solution to this problem? We have to count the average not from the sum of all errors X of the empire, but from the proportion of error X to all data within each province, which was 50% in Province A and 14% in Province B. Thus we receive 32%, which is a faithful representation of the mean value of the dialects of the two provinces. Note that the difference between the two types
82
of average is very significant, 14%. This clearly demonstrates how much the method of calculation matters, and how flawed the calculation of the total num- ber of data could be at certain extreme cases, where by “flawed”, we mean the 46% didn’t show the average value of sound change X of the territorial dialects, but it showed the average value per all speakers (all erectors of inscription). In the following survey, we will obtain information about which type of “imperial average” proves to be in practice more efficient point of reference to determine if a certain province has a higher or lower value of an error in comparison to the other provinces.
However, according to our hypothesis, the imperial average as a point of ref- erence will not be enough, because it can only inform us about the mean value of an error type within the empire at a given period, and if most of the provinces have a high proportion of that error type, the imperial average will be high, and it will not accurately reveal all the provinces which had a high degree of that phenomenon, only the provinces with the most prominent degree. The high but not most prominent values will appear as average or even below average values.
This means that the imperial average is only good for telling us about which provinces produced a higher or lower value from a certain phenomenon than the average of the empire in the examined time frame, but it doesn’t inform us whether that certain phenomenon was high enough or significant enough to be considered a real phonetical process of permanent impact in respect to that basic degree of its occurrences which could have been expected as technical engraving mistakes (which didn’t originate from a sound change in the language but from negligence, clerical lapsus calami, or from an individual habit in writing or pro- nunciation) in non-Vulgar but standard Classical Latin environment. Only if we know about an error type that it was of significant proportion in comparison to what we could have expected if the examined territory had not had that sound change which that error type indicates, only then we can more confidently con- clude that the sound change in question was likely occurring or had occurred in the examined territory. In order to know that, we need another point of reference, we need to know what the proportions of spelling faults were in the non-dialectal, i. e., standard Classical Latin inscriptions. According to our suggestion, we can find this Classical Latin reference point of the basic value of spelling faults in the spelling mistakes of the inscriptions of the city of Rome in the early principate.
We will specifically use the data of Rome from between 50 BC and 100 AD, because the LLDB is focused on the inscriptions of the imperial period, and the collection is very scant in respect to the republican era. However, we will not miss those earlier inscriptions: it’s better to leave out the inscriptions of earlier decades, because if we went into the past beyond 50 BCE, the distribution of
83
errors would be starting to be dominated by all kinds of archaisms and phenom- ena peculiar to Old Latin rather than Classical. According to our hypothesis, the statistical data of the city of Rome from the Classical Latin period will be able to provide that basic, non-dialectal values and proportions of inscriptional errors that can serve as the point of reference in determining which values of a certain province are high enough to indicate a real sound change, and we expect it to work better than the imperial total or the average of the provinces. Classical Latin was quite stable and well preserved until 100 AD in Rome, while the imperial average from the same period would contain the various territorial discrepancies, as well, which would not give such a clear picture about the non-dialectal profile of inscriptional faults. Even Italy was too colourful in local variations, and rustic areas had interesting features which we wouldn’t want to be represented in the basic non-dialectal point of reference, which explains why we choose only Rome, and not the whole Italy or the empire in the Classical Latin period.1.3. Error types and groups serving as bases of comparison The fourth essential step before we can run our survey addresses the question which types of errors a linguistic phenomenon can be measured against. In the practice of the Herman-school, researchers of Latin dialectology compare an er- ror type to the total number of all types of errors (referred to as omnes errores in our tables), or to the number of those errors which had a true phonetical back- ground (errores phonologici), in contrast to technical errors of the engraving pro- cess such as poorly designed letters (errores technici). The advantage of com- paring our examined error type to all types of errors is that the errors of morpho- syntax and technical errors fine-tune the result by important aspects of the lin- guistic reality; the disadvantage is the same — the technical mistakes and the errors of morphology distort the proportion of an error type indicating sound change. The errores phonologici are used as the basis of comparison in order to eliminate the aforementioned distortion: we expect to receive clearer results with this method, but its weakness is that the results are not calibrated by the other aspects of the corpus of inscriptional errors. We will run our surveys with a third, intermediate variant, too: comparing the examined error type to all linguistically relevant mistakes (phonology, morphology, syntax and semantic combined, which excludes the errors of writing technics only) which we will call the errores grammatici. This method might unite the virtues of comparison to the omnes errores and to the errores phonologici, as comparison in this happens to all phe- nomena that are linguistically relevant.
84
The problem with all of these methods, however, is that the variety and degree of intensity of linguistic developments change over time, and when we examine a certain phenomenon in the early and the late period, comparing it to the rest of the misspellings, if the other types of data are increased or decreased in number excessively between the compared periods, this change in the proportions can cause a distortion which makes our examined phenomenon appear less signifi- cant or more significant than it was. Let’s see a simplified example. Error type X is present with 20 occurrences in the early period, which is 5% of all linguistic data from the period, and it is found that it increased to 50 occurrences in the later period, but it’s just 1% of the data of the later period. According to our usual method, we were obliged to suppose a decrease in frequency in this case. But is it truly a decrease in frequency? We examine the rest of the data types, and we find that the overwhelming majority of the rest of the data consists of some typ- ical and very characteristic late period sound changes (81%, indicated by errors Y, Z, V, W), which had such a big increase in data occurrence that it overshadows the proportion of our examined error X (1%). However, if we consider that 81%
of the errors come from only a few, very “aggressively” increased error types, and this 1% of error X is actually 12,5% in comparison to the 8% of the other phonetical errors, while its earlier value 5% was just 11,36% compared to the 44% of other phonetical errors, we could argue that the seemingly five-fold de- crease of error X in percentage (5% > 1%) might really have been a small in- crease of the intensity of this phenomenon, but it was unfortunately shadowed by some even bigger increase of a few other, more virulent phenomena.
Early Period Later Period
Errors indicating sound change X 20 data = 5% 50 data = 1%
Vehemently increased errors Y, Z, V, W 4 data = 1% 4050 data = 81%
Rest of the error types 44% Other phonetical errors 50% Technical errors
8% Other phonetical errors 10% Technical errors Table 6. Example for distortion in the overall proportion of one error type
due to extremely increased value of a small group of other errors
How can we circumvent this problem? Comparing the proportion of error X to its imperial total proportion, to its imperial average by provinces and to Classical Rome can certainly refine the picture, but we are trying to explore additional solutions at this chapter by finding the best bases of comparison. It’s quite ap- parent that it’s better to compare our examined error type to more than one ref- erence points, and to find those reference points among the error types which are more or less static from period to period. One of the most static error types is the
85
errores technici13 (although in the interest of emphasizing the extremities, its proportion was set increased and then lowered unrealistically in the previous ex- ample in Table 6). These types of errors don’t depend on the status or develop- ments of the changing Latin language. These types of technical errors can occur in Archaic Latin just as well as in the Classical Period or in the Late Vulgar Latin.Its proportion among the rest of the error types may depend in some degree on the intensity of the other error types, so if there are too many intensive sound changes at the same time they will overshadow the proportion of the errores technici. Another factor influencing the proportion of the errores technici can be the standard of civilization in the given province: if it is in poor condition and the populace is overwhelmingly barbaric in comparison to better Romanized provinces, the proportion of technical errors might be higher. However, we should not attribute too much significance to this factor, because higher civiliza- tion or economical standard can also mean an increase in the number of inscrip- tions which in turn increases the number of technically spoiled inscriptions.
The other most reliably static component of data in every period during the empire is the faults caused by the monophthongization process of the /ae/ diph- thong. This process had started in the time of the mid-republic and was part of Vulgar Latin ever since. The educated classes tried to preserve its correct pro- nunciation for quite some time over the imperial era, but very high degrees of its proportion among the inscriptional errors make it sure that it was nothing more than an orthographic convention for the common people from at least the 1st cen- tury AD. Its consistently high proportion in every province makes it an excellent point of reference, similar to the errores technici.
Once we have got the results from comparing our examined error type to the omnes errores, to the errores grammatici, to the errores phonologici, to the er- rores technici and to the faults regarding the AE diphthong, and we have classi- fied the provinces using the imperial total percentage, the average of the empire by provinces and the basic reference point of Classical Rome, a fifth step will still be needed: there will most likely be a number of provinces that do not match the expected category, but there might still be a way to “remedy” them. Another point of reference offers itself in the difference between the early period and later period values of the examined error type. If a province, which we expected to be
13 These are the various technical errors of the lapicida: mistaken repetition, confusion, unintentional omission of letters or syllables, obvious lapsus calami type of mistakes. The purely technical mistakes, labeled as “errores technici”, are the carving mistakes of the lapicida: for example, the carving of F instead of E. The purely orthographical mistakes, “errores orthographici” are also included in this category in the present study, which are those faults that do not imply a change in the pronunciation but only a confusion about the use of certain letters that are pronounced the same, for example, the confusion between the letters C~K~Q and X~CS.
86
in the “high” category, ends up in the “low” category, shows a significant incre- ment from the early period to the later period, we can argue that the process of that sound change has started, and may result in a fully completed sound change soon after the examined period. This is especially relevant when we examine a province which doesn’t have many inscriptions from the late period, or where the custom of erecting inscriptions ceases very early, and it lacks testimony about the extent of the sound change.
2. Evaluation of the data
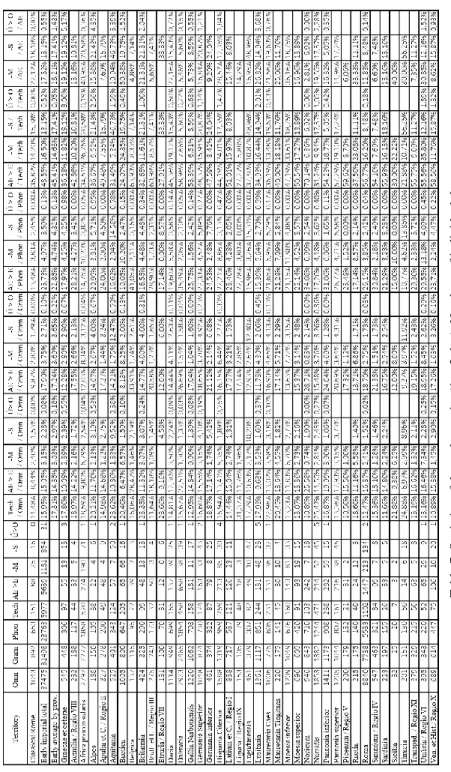
Our method of data processing was the following:14 we divided the linguistic data for an early period and a late period, determined as from 1st to 3rd and from 4th to 8th centuries, but since the number of data can’t be dated precisely to only one of the two periods, we included the data in the early period if their possible dating was spread out to the 4th (but no later than 325 AD) if their earliest pos- sible date is earlier than at least 275 AD, and we included data in the later period also from the 3rd century if their possible dating was spread out later than at least 325 AD. We excluded the category labelled as fortasse recte in the LLDB, which are those inscriptional errors that potentially might be explained as correct. The ratios seen in the tables which I use for the analysis are obtained by the Herman-method.15 For the current examination, I calculated16 the rela- tive frequencies of the errors of E~AE confusions (both when Classical Latin /ae/ is written as E and its hypercorrect version, when /e/ is written as AE), the disappearance of word-final /-m/ and its hypercorrect version, when an –M is spelled at the end of a word where it shouldn’t be, the writing of Classical Latin short stressed /ú/ with the letter O and the elimination of word-final /-s/ (among these last two categories no hypercorrections were admitted). The data for the category labelled as “Classical Rome” are the data from the city of Rome which can be securely dated between 51 BC and 100 AD. When calculating the “av- erage by provinces”, the category “Graecae et ceterae” (which includes all of the non-Latin speaking provinces) wasn’t counted toward the average of the provinces.
Tables 9–13 show results of our survey, where the results regarding letters AE and -M are given in two columns, in the first we find the number of prov- inces which had a very low degree of that error type (lower than the lower limit
14 All other statistical methodologies if otherwise not stated, are done as described in Gonda 2017a.
15 The description of the methodology is found in Herman (2000b) and Adamik (2012).
16 All statistics, if not stated otherwise, are counted from data according to the state of the LLDB in March, 2019.
87
of standard deviation) but their low degree could be justified (as explained in chapter 1.1), and the second column shows the percentage of this previous number in comparison to the number of all those provinces which were classi- fied as having very low proportion (below the standard deviation). In these same tables, the results for -S and /ú/ > O are also given in four columns, where the first two columns contain the number of provinces that scored correctly according to our expectations as listed in Tables 1–2 and the percentage when compared to the number of all those provinces which we had a clear expectation about (28 in the case of –S and 32 in the case of /ú/ > O), and the two second columns contain the same things but with the addition of the provinces with“unknown” result expectations, as described in chapter 1.1 and in Tables 1–2.
In case of the –S dropping and stressed short /ú/ > O mistakes, the provinces are classified high only if they have a proportion higher than the late imperial total, late average by provinces or Classical Rome. Abbreviations in the statis- tical tables are to be read in the following way: “Omn”: errores omnes,
“Gram”: errores grammatici, “Phon”: errores phonologici, “Tech”: errores technici.
88
Table 7. Statistics of the early empire (1st–3rd c.). Numbers of individual data followed by the percentages counted from those data as indicated in the header.
89
Table 8. Statistics of the late empire (4th–8th c.). Numbers of individual data followed by the percentages counted from those data as indicated in the header.
90
Tables 9–13. Results of the statistical survey with different methodologies. To interpret these tables read chapter 2.
91
3. Results of the surveyAfter the evaluation of the data and the examination of Tables 9–13, we can im- mediately realize that different methods brought different results, and in fact there are better and less successful approaches. Contrarily to our supposition, the comparison to errores technici or the errors of AE didn’t make the identification of the dialectal tendencies clearer, neither did the narrowing of the basis of com- parison to linguistically more relevant errors, the grammatici and the phonologici help much, however, both of these proved to be much more successful than the comparison to technici and AE faults. The most successful method was the com- parison to omnes errores, all errors, regardless of their nature (64% success rate), and use of Classical Rome (65%) as a reference point in deciding statistical rel- evance. The most successful test was when the dropping of -M was compared to the technical mistakes contrasted to Classical Rome (86% success rate), followed by the same contrasted to the average of the provinces and to the imperial total (both with 80-80% success rate). The third most successful test was the word- final –S elimination compared to errores omnes, with 78% success rate. If we look at all those tests which brought a success rate of 60% of more, it is apparent that comparisons to all mistakes, grammatical mistakes and phonetical mistakes (13-12-12 tests being above 60%) are much more effective than the tests with the technical and AE errors, as only 7-7 tests could give a success rate of 60%. How- ever, if we also look into those which met our expectations at least 65% or 70%
successfully, the dominance of the omnes method is unquestionable and much more visible than its 64% overall success rate in comparison to the other meth- ods’ 60-60-60% and 59%. You can see the details in Table 14, where it also becomes evident, that despite the methods with grammatici, phonologici and technici all scored with 60%, the phonologici-method was more successful than the rest of them, as it contained 11 tests which brought a success rate of 65% or more. The phonological method is clearly the second best, and the one with the errores grammatici is third.
92
Method Total success rate 70% or more 65% or more 60% or more
/ Omnes 64% 6 8 13
/ Grammatici 60% 4 7 12
/ Phonologici 60% 4 11 12
/ Technici 60% 4 5 7
/ AE > E 59% 1 5 7
Contrasted
to Classical Rome 65% 12 19 23
to Imperial Total 57% 3 8 15
to Average by prov. 57% 4 9 12
Table 14. The distribution of the best resulting tests and the total success rate of the different methods
Regarding the standard reference points to which the significance of the propor- tions of the error types can be measured, our findings show that the inscriptional error profile of Classical Rome is the best point of reference, and if we look at those tests only which brought a success rate of 70% or more, Classical Rome has an outstanding dominance (12 tests over 70% success, compared to 3 and 4).
The second most effective point of reference is the imperial total, which is slightly better than average by provinces, because it has 15 tests with over 60%
success rate, while the referencing to the average by provinces has only 12. The statistical analysis demonstrated that the best method is to compare dialectal data to the values of Classical Rome. However, contrarily to our expectation, it also turned out that, the comparison to the imperial “average by provinces” isn’t a better method than the comparison to the imperial total: these two methods achieve largely the same rate of success, the imperial total being slightly more successful.
With this, however, the testing is not completed. As we mentioned in chapter 1.3, there can be an additional method to remedy the results, i.e. to re-evaluate those provinces which didn’t end up in their expected category of intensity, and to assign them as yet weak but promising candidates to the category where we suspected them to belong. This method is the analysis of the differences in the proportions between the early period percentages and those of the later period.
Since the proportions between the two periods may slightly vary due to random- ness, we also have to set up a criterion when we can classify a province as having a significant increase or decrease in a phenomenon in comparison to the early period. It seems logical to suppose that the average value of increase counted from all the increasing proportions of the provinces within a test (i.e. a testing calculation, like -S / Omn, -M / Omn, -AE / tech etc.) should serve as the meas- uring point, and all increases that are higher than the average value of increase
93
of all provinces which have an increasing proportion in a test should count as significant increase, and the affected province can be re-assigned, with caveat, to the category of provinces with high intensity of the examined phenomenon. The same should apply to the decrease, the average decrease has to be counted from the provinces with a decreasing value as compared to the early period, and a province can be reclassified and admitted among those with low proportion if it has a decrease greater than the average decrease within a test method.In this paper we have place only to run this experiment for the most successful and most interesting survey items, which is really dialect-defining: these are the errors of /-s/ elimination and /ú/ > O misspelling, when compared to omnes er- rores, and measured to Classical Rome. The results of the analysis of the differ- ences between the early period and late period run through all testing methods can be seen in Tables 15–16, where the values which can change the classifica- tion (high or low) of a given province according to the criteria of average increase or average decrease (as described above) are marked with an X.
94
Table 15–16. Increases and decreases of /-s/ elimination and /ú/ > O spelling faults between the early and late periods run through all testing methods to adjust the results of the tests labeled as -S / Omn and Ú > O / Omn
The result is promising: the greatest degree of correction is achieved by the calculation of the difference between the early and late period proportions of the /-s/ dropping and /ú/ > O misspelling errors compared to the errores tech- nici, where /-s/ elimination gets two provinces (which were originally classified as high) into the low group, and two additional provinces in the “unknown”
category which were suspected to be low, but ended up in the “high” category, can also be re-classified as “low”, thus 4 provinces in total get scores for this combined method. The testing of /ú/ > O has come out of this even better, it scores 5 provinces in addition by this process of refinement of results, from which only one (Britannia) is from the “unknown status” group.
95
Our other tested basis of comparison has also showed its value, and perhaps has given evidence that can be of use: the comparison to the AE > E faults, which are almost like technical errors after the early completion of the monophthongization process throughout the empire. The difference between the percentages from the comparison to the AE mistakes gives 3 new scores to the /-s/ survey and 4 new scores to the /ú/ > O survey. Our initial suspicion seems to gain some ground, and comparison to errors of technical or purely orthographical nature may indeed have an ability to help detect hidden processes, or at least adjust the final picture. After such a refinement of the process, the following final results can be presented:Table 17. Refined best results of the survey
This means that significant improvement can be reached if we also look at the tendencies of increase and decrease between the periods as these can signal the future and fate of certain sound developments which didn’t yet appear in their final form or strength.
4. Conclusions
Our experiments with various points of reference and bases of comparison have given some answers to our initial questions. Using the misspelling data of Rome in the Classical Latin period provided very convincing results and has proven to be significantly superior to the method of measuring the proportions of errors to the total proportions of the empire or to the, slightly less successful, method of measuring to the imperial average of the provinces. Our suspicion that technical errors can become a neutral point of reference in all kinds of comparisons wasn’t verified, however, they turned out to be a promising tool to detect changes in the tendencies from earlier to later period. The reason behind this is probably the fact that the errores technici are generally constant, and if a type of error is suddenly increased or decreased due to the increase or decrease of the intensity of a process of sound change, the ratio between such error type and these technical errors might be more fragile, more susceptible to expressing change. Another viable and successful method can be the comparison of data indicating a sound change
96
to the purely phonological errors, or even to the purely grammatical (phonetical and morphosyntactical) errors, though their effectiveness was less spectacular in this survey. We can recommend researchers of Latin dialectology the use of the statistical data of spelling errors of the city of Rome as the best measurement of the significance and intensity of a supposed sound change, and the comparison of an examined sound change to all types of errors and, if needed, to the purely phonological errors, and the refinement of the results by observing the degree of changes in proportions between an earlier and later period contrasted to the pro- portions of technical and purely orthographical mistakes in the same two periods.
Bibliography
Adamik 2012 = Adamik, B.: In Search of the Regional Diversification of Latin: Some Methodo- logical Considerations in Employing the Inscriptional Evidence. In: Biville, F. et al. (edd.):
Latin vulgaire - latin tardif IX. Actes du IXe colloque international sur le latin vulgaire et tardif, Lyon, 6 – 9 septembre 2009. Publications de la Maison de l’Orient e la Méditerranée.
Lyon, 123–139.
— 2016 = Adamik, B.: The frequency of syncope in the Latin of the Empire: A statistical and dialectological study based on the analysis of inscriptions. In.: Paolo Poccetti (ed.): LATINI- TATIS RATIONES: Descriptive and Historical Accounts for the Latin Language. Berlin–Bos- ton.
— 2017a = Adamik, B.: On the Vulgar Latin merger of /b/ and /w/ and its correlation with the loss of intervocalic /w/: Dialectological evidence from inscriptions. Pallas, 103, 25–36.
— 2017b = Adamik, B.: The problem of the omission of word-final -s as evidenced in Latin in- scriptions. GRAECO-LATINA BRUNENSIA, 22 (2), 5–21.
Adams 2008 = Adams, J. N.: The Regional Diversification of Latin 200 BC–AD 600. Cambridge.
Barbarino 1978 = Barbarino, J. L.: The Evolution of the Latin /b/-/v/ Merger: a Quantitative and Comparative Analysis of the B-V Alternation in Latin Inscriptions. North Carolina Studies in the Romance Languages and Literatures, 203. Chapel Hill.
Benincà, Parry, Pescarini 2016 = Benincà, P., Parry, M., Pescarini, D.: The dialects of northern Italy. In: Ledgeway, A., Maiden, M. (edd.): The Oxford Guide to the Romance Languages.
Oxford, 185–205.
Gaeng 1968 = Gaeng, P. A.: An Inquiry into Local Variations in Vulgar Latin, as Reflected in the Vocalism of Christian Inscriptions. Chapel Hill.
Gonda 2015 = Gonda, A.: Aquincum latin nyelve [The Latin language of Aquincum]. In: Bárány, I., Bolonyai, G., Ferenczi, A., Vér, Á. (edd.): Studia Classica. Budapest, 317–338.
— 2017a = Gonda, A.: Changes in the consonant system of Pannonia Inferior, Dalmatia and Ve- netia et Histria. GRAECO-LATINA BRUNENSIA, 22 (2), 165–181.
— 2017b = Gonda, A.: The Aquincum–Salona–Aquileia Triangle: Latin language in the Alps–
Danube–Adria region. Acta Antiqua, 57 (1), 99–123.
— 2019 = Gonda, A.: Phonetic Changes in the Latin of Noricum. Acta Classica Universitatis Sci- entiarum Debreceniensis, 55. 75–96.
Gutkind 1971 = Gutkind, E. A.: International History of City Development VI. Urban Development in Western Europe: The Netherlands and Great Britain. New York.
Herman 1983 = Herman, J.: Le latin dans les provinces danubiennes de l'Empire romain. Problemes et perspectives de la recherche. ANRW II, 29, 2, 1089–1106.
97
— 2000a = Herman, J.: Vulgar Latin. University Park.
— 2000b = Herman, J.: Differenze territoriali nel latino parlato dell’Italia tardo-imperiale: un contributo preliminare. In: Herman, J. – Marinetti, A. (edd.): La preistoria dell Italiano. Atti della Tavola Rotonda di Linguistica Storica. Università Ca’ Foscari di Venezia 11–13 giugno 1998. Tübingen, 124–135.
Izzo 1986 = Izzo, H. J.: On the history of Romanian. In: Marino, M. – Pérez, L. A. (edd.): The Twelfth LACUS Forum, 1985. Linguistic Association of Canada and the United States, 139–146.
Lloret 2004 = Lloret, M.-R.: The Phonological Role of Paradigms: The case of insular Catalan. In:
Auger, J. – Clements, J. C. – Vance, B. (edd.): Contemporary Approaches to Romance Lin- guistics: Selected Papers from the 33rd Linguistic Symposium on Romance Languages. Phila- delphia, 258, 275–298.
Loporcaro 2011a = Loporcaro, M.: Syllable, Segment and Prosody. In: Maiden, M. et al. (edd.):
The Cambridge History of the Romance Languages I. Cambridge, 50–108.
— 2011b = Loporcaro, M.: Phonological Processes. In: Maiden, M. et al. (edd.): The Cambridge History of the Romance Languages I. Cambridge, 109‒154.
Omeltchenko 1977 = Omeltchenko, W.: A Quantitative and Comparative Study of the Vocalism of the Latin Inscriptions of North Africa, Britain, Dalmatia, and the Balkans. North Carolina Studies in the Romance Languages and Literatures, 180. Chapel Hill.
Rosetti 1978 = Rosetti, A.: Istoria limbii române. Editura Științifică și Enciclopedică
Schramm 1997 = Schramm, G.: Ein Damm bricht. Die römische Donaugrenze und die Invasionen des 5–7. Jahrhunderts in Lichte der Namen und Wörter. R. Oldenbourg Verlag.
Tamás 1983 = Tamás, L.: Einführung in die historisch-vergleichende romanische Sprachwissen- schaft. Wissenschaftlicher Verlag A. Lehmann Gerbrunn, Würzburg.
Väänänen 1981 = Väänänen, V.: Introduction au latin vulgaire. Paris.