Dirgha Raj Joshi*, Jitendra Kumar Singh & Umesh Neupane
MENTAL HEALTH PROBLEMS AND PATTERNS OF SELF-CARE ASSOCIATED WITH THE USE OF DIGITAL
DEVICES AMONG UNIVERSITY STUDENTS
(Received: 6 October 2020; accepted: 28 July 2021)
Background: Digital devices such as computers, laptops, television (TV) and mobile phones were originally designed to support human beings’ daily activities; however, they may produce several limitations as well as benefits. The main concern of the study was how the utilization of digital devices like laptops, computers and TVs affect the mental health of Nepal’s university students and what are the self-care practices utilized to manage problems?
Method: 326 MPhil scholars of Nepal Open University (NOU) participated in this cross-sectional study. Digital devices pattern of use (i.e., TV, laptop and computer), mental health problems, and self-care practices among university students were assessed through a semi-structured questionnaire.
Chi-square test and binary logistic regression were major statistical techniques used in the research.
Results: The study’s researchers found the following mental health problems: depression (21.5%), loneliness (39.9%), anxiety (30.7%), and a loss of the sense of control (47.5%). Significant associ- ations were found between sitting position with loneliness, age and anxiety and the daily use of computer with sense of control, loneliness, and anxiety. Additionally, computer use two to three times a week, laptop use in the evening and sitting on a chair or stool when using digital devices, stood as the main predictors respectively of the sense of control, loneliness, and depression. Few participants with mental health problems used medicine and meditation for self-care.
Conclusion: The use of digital devices was associated with mental health problems. Patterns of using computers and the preferred time to use laptops were major contributing factors for one’s sense of control and loneliness, respectively. Therefore, an awareness programme concerning the use of digital devices and their effects on mental health should be communicated among university students.
Keywords: internet addiction; pathological internet use; mental health; digital devices; pattern of self-care; Nepal
* Corresponding author: Dirgha Raj Joshi Ph.D., Visiting Faculty of Mahendra Ratna Campus Tahachal, Tribhuvan University Nepal & Nepal Open University; dirgha@nou.edu.np.
1. Introduction
Digital devices are an exciting new medium that are evolving as an essential part of everyday life all over the world. Digital devices such as computers, laptops, television (TV), mobiles and iPads were originally designed to facilitate infor- mation, communication, business transactions, entertainment, classroom studies, and research activities. However, the dramatic increase in the use of such devices in recent years has led to addiction among university students across the world.
This study’s researchers therefore included laptops, computers, and TVs as digital resources and the sense of control, loneliness, anxiety, and depression as mental health problems under the study. Mental health is a comprehensive issue (Kenny et al. 2020) because the global trend of death by suicide is 800,000 per year (WHO 2014), whereas that rate is 5,000 in Nepal (Bhattarai 2020), which is directly associated with mental health problems. Additionally, only 0.13 psychiatrists per 100,000 people are available in Nepal, and most of these are in an urban area, a fact indicates the majority of the population has no access to counselling and treatment (Bhattarai 2020). Several videos, audios, presentations, and text materials can be found in virtual sites, so the application of digital devices may be good resources for personal health care, self-counselling, and management of mental disorders.
Over the past few years, extensive research and surveys have been done to study the impact of digital device use on mental health. Dr. Ivan Goldberg was the first to propose the term ‘internet addiction’ as serious mental pathological problems (Saliceti 2015). The proper detection and diagnosis of internet addiction is difficult; however, certain characterizations such as mood modification, tolerance, withdrawal, and functional impairment signify internet addiction as Pathological Internet Use (PIU). Young and Rogers (1998) described internet addiction as PIU, which they defined as an individual’s inability to control his/her use of the internet to the point that it eventually causes psychological, social, school-related and/or work difficulties in a person’s life (Leung 2004; Lupton 2017; Mesmar et al. 2016).
The use of smartphones is a risk factor for adults’ mental health (Gowthami &
Venkatakrishnakumar 2016). Utilization of ICT tools (Lindsay et al. 2008) and trauma training (Sprang et al. 2007) help care for mental health problems and self- care is more beneficial for mental health (Williams et al. 2010). The professionals who deal with mental health concerns themselves exhibit depression and loneliness (Mahoney 1997). Stress, affiliate stigma, happiness (Bonsu et al. 2020), low income and rural culture are contributing factors to mental health (Crumb et al. 2019), so relative and inexpensive preventative measures such as awareness programs should be implemented, and social, political, and health-related bodies have to exhibit careful, responsible awareness about healthcare (Colizzi et al. 2020).
The use of the Internet-based digital devices in schools, campuses and in society has increased dramatically in recent years. Those of younger age are becoming
less-regulative and more susceptible to internet-based digital devices as they depend heavily on such devices for learning, social activities, and leisure. The previous epidemiological self-report survey indicated that the prevalence rates of internet addiction among adolescents range from 0.9 to 38%, depending upon the diverse study design of methodology (Fu et al. 2010; Shaw & Black 2008), different judgment methods and sampling among various sub-populations (Laconi et al. 2014; Rooij
& Prause 2014; Widyanto & Griffiths 2006). An official report in China, which is ranked as the largest internet broadband market in the world, claims that one in every six Chinese internet users may have developed some level of internet addiction (Chou et al. 2005). Scherer (1997) studied the problems of internet addiction in students. In this study, Scherer found 13% of students had interfered with their academic work, professional performance, or social lives via internet use (Chou et al. 2005). Similarly, in Young’s study (1998), it was found that excessive use of the internet resulted in students distancing themselves from personal interactions with family, and occupational problems similar to those experienced with other addictions (Young 1998). Chou and Hsiao (2000), using Taiwan college student samples, had investigated students’ self-assessment of their Internet use and its impact on their lives. They found that internet addicted students suffered more negative consequences in their studies and daily routines than those non-addicted students.
However, there was no significant relationship between addicted and non-addicted groups of internet impacts with friends, schoolmates, parents, and teachers (Chou
& Hsiao 2000). Among college students, those who use the internet more have increased depression problems (Christakis et al. 2011; Rosen et al. 2013).
The recent increase of affordable digital devices such as laptop computers, iPad, tablets, digital textbooks, e-readers, and web-enabled cell phones has increased student and instructor use of technology in college classrooms (Hoekstra 2009).
Every year, students in today’s classroom are becoming much more technologically savvy. Digital technology has spread out in every aspect of university students’
lives such as how they play, how they socialize, how they communicate and how they learn (Mesko et al. 2017).
Given that the use of digital devices plays a central role in the lives of university students, and many students report poor mental health conditions, our study is focused on the student’s feelings towards the use of digital devices: TVs, laptops, computers, and mobiles in their daily lives. However, to the best of our knowledge, no research has been published about the effect of mental health conditions like loneliness, anxiety, depression, and sense of control with the use of digital devices among the university students in Nepal. The current research is aimed to garner useful information about health awareness and practices among the different age groups of university students with reference to the excessive use of digital devices. Therefore, the study hypothesized that use of digital devices magnifies mental health problems like sense of control, loneliness, anxiety and depression among university students.
2. Materials and methods 2.1. Study setting
The study was conducted at NOU, Lalitpur, Nepal. NOU is the first open university of Nepal, recently established in 2016 AD. The university consists of three faculties:
the Faculty of Science, Health and Technology, the Faculty of Social Science and Education, and the Faculty of Management and Law. From the three faculties, scholars from the Faculty of Science, Health and Technology and the Faculty of Social Science and Education, having MPhil programs on MPhil in ICT, MPhil in Nepali Education, Mathematics Education, English Education, Education Studies, Political Science, Sociology, Health, and Economics, are included in the current study. NOU’s classes are entirely virtually based through BigBlueButton, Skype for Business and Microsoft Teams, and additionally there is provision and practice of three face-to-face contact sections in each semester. All virtual classes are being managed three hours per week per subject (6:00 PM to 9:00 PM Nepali time).
Furthermore, all courses are being managed through the Learning Management System (LMS) Model.
2.2. Study design and sampling
The cross-sectional study design was adopted through an online survey. The sample size for the finite population was calculated through the online calculator ‘Select Statistical Services’. We assumed p = 50% as no prior research was conducted in the country. After substituting the values, the sample size determined was found to be 212. By allowing 20% non-response, the final sample size obtained was 255 which is sufficient for this study (Select Statistical Services LTD 2019). We approached all MPhil scholars; i.e., 469 of Faculty of Social Science and Education and Faculty of Science, Health and Technology of the NOU. However, 326 returned the completed questionnaire giving a response rate of 69.51%.
2.3. Data collection
The data were collected from January 2019 to August 2019 through Google Form.
The self-constructed tool was implemented and the tool’s validity was ensured through the pre-test and the views of experts in related fields. Survey questions were created from different literatures (Baker et al. 2018; Ministry of Health, Nepal 2017). Email addresses and contact details of all students were taken from the administration of NOU and the tool was sent to all selected scholars requesting
them to fill-up the form. The researcher provided a one-month reminder through email as well as telephone. Ethical approval for this study was obtained from the Ethical Review Board of Janaki Medical College.
2.4. Definition of variables
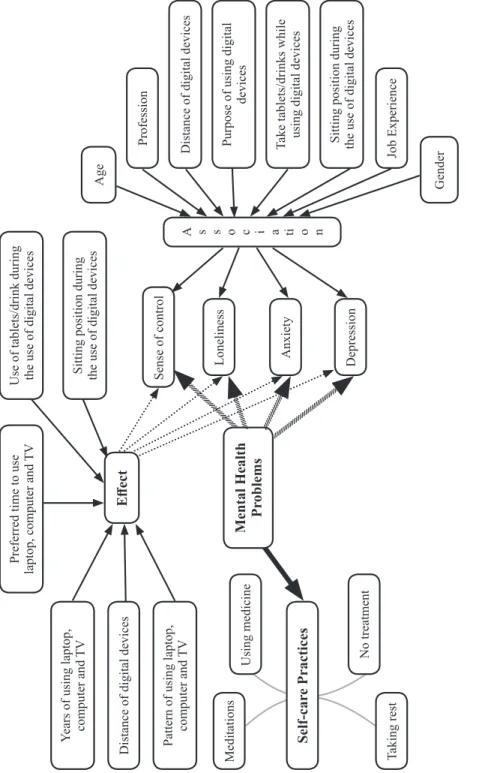
The outcome variables were sense of control, loneliness, anxiety, and depression. All these items are associated with the mental health of the respondent and in the Yes or No form. In addition, treatment measures followed by the respondent having mental problems were measured. Four options such as using medicine, meditations, taking rest, and no treatment was given as an option to choose in all mental health-related problems. Figure 1 provides a detailed conceptual framework.
We used six confounding variables in the research as the age of the respondent wa categorized in three parts (20–30 years, 31–40 years and ≥ 41 years), gender was categorized as male and female, and the profession was categorized in teaching and non-teaching where teaching represents teachers, lecturers, while non-teaching represent those working in other government offices, NGOs and INGOs. The distance of digital devices represents the ‘eye distance’ of laptop, computer and TV, which are separated into four sections; i.e., less than 1 feet (ft.), 1 ft. to 2 ft., 2 ft. to 3 ft. and more than 3 ft. Daily time to use digital devices was separated into three regiments (0–4.5 hours, 5–8.5 hours and 9–14 hours). The purpose for using digital devices has been categorized into academic and non-academic activities, where academic activities represent teaching, learning, and other official works associated with the profession, and non-academic works representing entertainment, social media, and communication. Job experience has been categorized into less than 10 years of experience and greater than or equal to 10 years of experience, based on the duration of the profession.
2.5. Statistical analysis
Frequency and percentage were presented under descriptive statistics and the Chi- square test was adopted under inferential statistics to show the association of use of digital devices: laptop, computer, and TV with mental health problems. Binary logistic regression was performed to assess the effect of using digital devices in mental health problems.
Figure 1 Conceptual Framework
Mental Health Problems
Preferred time to use laptop, computer and TV Years of using laptop, computer and TV Distance of digital devices Pattern of using laptop, computer and TV Self-care Practices
Meditations Using medicine No treatment Taking rest
Use of tablets/drink during the use of digital devices Sitting position during the use of digital devices Sense of control Loneliness Anxiety Depression
A s s o c i a ti o n
Age Profession Distance of digital devices Purpose of using digital devices Take tablets/drinks while using digital devices Sitting position during the use of digital devices Job Experience Gender
Effect
3. Results
3.1. Status of mental health problems among university students
About three-fourths of the digital device users about half have sense of control (47.5%), more than one-third have loneliness (39.9%), one-third have anxiety (30.7%) and around one-fifth (21.5%) have a depression problem. The overall result of this table showed that more than half (52.5%) to around four-fifths (78.5%) have no mental health problems, which indicates that the digital devices have a positive impact on mental health problems (Table 1).
Table 1
Mental health problems among university students (N = 326)
Mental health effect Yes No Total
N (%) N (%) N (%)
Sense of control 155 (47.5) 171 (52.5) 326 (100)
Loneliness 130 (39.9) 196 (60.1) 326 (100)
Anxiety 100 (30.7) 226 (69.3) 326 (100)
Depression 70 (21.5) 256 (78.5) 326 (100)
3.2. Status of daily use of digital devices and socio-demographic characteristics among university students
Almost 90.49% (295/326) of the respondents were using a laptop daily and that rate is poor in case of daily computer use 30.01% (98/326) and moderate in the daily use of TV 56.75% (185/326). The rate of having a laptop is high because all participants were taking virtual classes and using digital devices for their different academic and non-academic activities (Table 2). In the survey, more than half (57.36%) of the respondents came from the 31–40 age group, more than four-fifths (86.2%) were male, around three-quarters (73.3%) engaged in teaching as a profession, and around half (49.2%) were habituated to the use of digital devices with the distance of 1–2 ft. A majority of them used digital resources for the purpose of academic activities (86.2%), around two-fifths (39.3%) of them formerly partook of tablets or drinks during the use of digital devices. Around two-thirds (62%) of the respondents were habituated to using digital devices by sitting on a chair or stool. However, women did not participate much in the study: female (13.8%), and the same case for others as distance ≥ 3 ft. distance (2.5%), using digital
resources for non-academic background (13.8%), not specified job (5.5%), and use of digital devices by lying on bed (7.4%) categories (Table 2).
Table 2
Socio-demographic characteristics and use of digital devices among university students (N=326)
Socio-demographic Characteristics Daily use of digital devices Total
TV Computer Laptop
Age (years)
20-30 26(14.1) 12(12.2) 40(13.6) 51(15.64)
31-40 107(57.8) 57(58.2) 170(57.6) 187(57.36)
≥41-60 52(28.1) 29(29.6) 85(28.8) 88(26.99)
Gender
Male 159(85.9) 86(87.8) 259(87.8) 281(86.2)
Female 26(14.1) 12(12.2) 36(12.2) 45(13.8)
Profession
Teaching 146(78.9) 63(64.3) 218(73.9) 239(73.3)
Non-teaching 39(21.1) 35(35.7) 77(26.1) 87(26.7)
Distance of Digital devices
< 1 ft. 44(23.8) 24(24.5) 74(25.1) 84(25.8)
1 ft. to 2 ft. 113(61.1) 52(53.1) 176(59.7) 193(49.2)
2 ft. to 3 ft. 25(13.5) 18(18.4) 38(12.9) 41(12.6)
≥ 3 ft. 3(1.6) 4(4.1) 7(2.4) 8(2.5)
Purpose of using DD
Academic activities 162(87.6) 87(88.8) 262(88.8) 281(86.2)
Non-academic activities 23(12.4) 11(11.2) 33(11.2) 45(13.8)
Job Experience
≤10 years 89(48.1) 46(46.9) 135 (45.8) 156(47.9)
>10 years 89(48.1) 47(48) 144 (48.8) 152(46.6)
Not specified 7(3.8) 5(5.1) 16(5.4) 18(5.5)
Take tablets/drink
Yes 80(43.2) 47(48) 116(39.3) 128(39.3)
No 105(56.8) 51(52) 179(60.7) 198(60.7)
Sitting arrangement
Sitting on chair/tool 121(65.4) 62(63.3) 187(63.4) 202(62.0)
Sitting on bed 28(15.1) 15(15.3) 58(19.7) 66(20.2)
Lying on bed 16(8.6) 07(7.1) 17(5.8) 24(7.4)
Sitting with laptop on lap 20(10.8) 14(14.3) 33(11.1) 34(10.4)
Total 185(100) 98(100) 295(100) 326(100)
3.3. Association between socio-demographic characteristics and mental health problems
3.3.1. Association between socio-demographic characteristics and sense of control
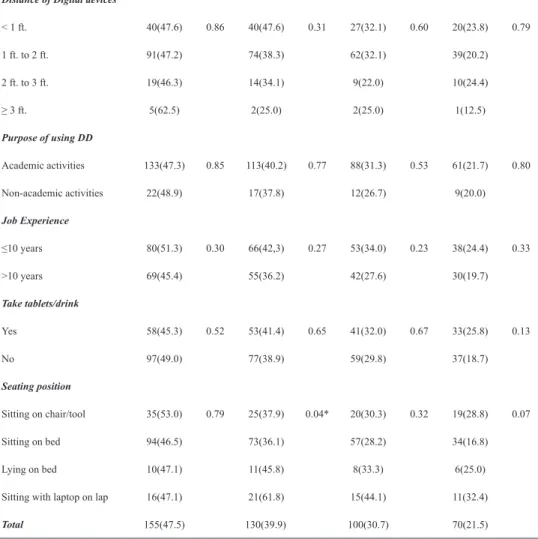
The range of participants having the sense of control problem is 45.3% to 53.3% in most categories of social-demographic variables except regarding distance of digital devices greater than or equal to 3 feet (62.5%). The Chi-square test statistics showed that no association was found between sense of control with all socio-demographic characteristics (Table 3).
3.3.2. Association between socio-demographic characteristics and loneliness
We found the loneliness problem to be high for those sitting with a laptop on their lap (61.8%) and low on those using the devices with the distance more or equal to 3 feet (25%), and for another character that frequency was found to be in the range from 34.1% to 47.6%. In all socio-demographic variables, p-value > 0.05 with loneliness problems indicates insignificant results (Table 3).
3.3.3. Association between socio-demographic characteristics and anxiety Device users who sat with a laptop on their lap have the highest proportion of anxiety (44.1%). Around a fifth of the users, those maintaining a distance of 2 feet to 3 feet (22%) and aged 41–60 years, had an anxiety rate of around a fourth (21.6%) whereas that rate is also around a fourth among those aged 20–30 (25.5%). Users for non-academic activities (26.4%), > 10 years experienced (27.6%) participants and users by sitting on the bed (28.2%) and that proportion is a third of the remaining characters. Furthermore, the association is significant between anxiety and age only (Table 3).
3.3.4. Association between socio-demographic characteristics and depression
Proportion is very poor among those using digital devices by the distance of ≥ 3 feet with depression and high in those using devices by sitting with a laptop on lap (32.4%) where that rate is ranged from 16.8% to 28.8% in other categories.
The chi-square result is insignificant between all socio-demographic variables and depression (Table 3).
Table 3
Association of socio-demographic characteristics with mental health problem (N = 326)
Sense of control Loneliness Anxiety Depression
n(%)Yes p-value Yes
n(%) p-value Yes
n(%) p-value Yes
n(%) p-value Age (years)
20-30 25(49) 0.91 19(37.3) 0.45 13(25.5) 0.03* 9(17.6) 0.17
31-40 87(46.5) 80(42.8) 68(36.4) 47(25.1)
41-60 43(48.9) 31(35.2) 19(21.6) 14(15.9)
Gender
Male 131(46.6) 0.40 112(39.9) 0.98 86(30.6) 0.95 59(21.0) 0.60
Female 24(53.3) 18(40.0) 14(31.1) 11(24.4)
Profession
Teaching 116(48.5) 0.55 92(38.5) 0.40 77(32.2) 0.32 53(22.2) 0.61
Non-teaching 39(44.8) 38(43.7) 23(26.4) 17(19.5)
Distance of Digital devices
< 1 ft. 40(47.6) 0.86 40(47.6) 0.31 27(32.1) 0.60 20(23.8) 0.79
1 ft. to 2 ft. 91(47.2) 74(38.3) 62(32.1) 39(20.2)
2 ft. to 3 ft. 19(46.3) 14(34.1) 9(22.0) 10(24.4)
≥ 3 ft. 5(62.5) 2(25.0) 2(25.0) 1(12.5)
Purpose of using DD
Academic activities 133(47.3) 0.85 113(40.2) 0.77 88(31.3) 0.53 61(21.7) 0.80
Non-academic activities 22(48.9) 17(37.8) 12(26.7) 9(20.0)
Job Experience
≤10 years 80(51.3) 0.30 66(42,3) 0.27 53(34.0) 0.23 38(24.4) 0.33
>10 years 69(45.4) 55(36.2) 42(27.6) 30(19.7)
Take tablets/drink
Yes 58(45.3) 0.52 53(41.4) 0.65 41(32.0) 0.67 33(25.8) 0.13
No 97(49.0) 77(38.9) 59(29.8) 37(18.7)
Seating position
Sitting on chair/tool 35(53.0) 0.79 25(37.9) 0.04* 20(30.3) 0.32 19(28.8) 0.07
Sitting on bed 94(46.5) 73(36.1) 57(28.2) 34(16.8)
Lying on bed 10(47.1) 11(45.8) 8(33.3) 6(25.0)
Sitting with laptop on lap 16(47.1) 21(61.8) 15(44.1) 11(32.4)
Total 155(47.5) 130(39.9) 100(30.7) 70(21.5)
*p-value <0.05 (i.e., Significant).
3.4. Association of mental health problems with daily use of digital devices among university students
Table 4 shows the association between use of digital devices and mental health problems. We observed a significant association for computer use with all types of mental health problems; i.e., sense of control (p < 0.05), loneliness (p < 0.05) and anxiety (p < 0.05) – except for depression (p > 0.05). Moreover, use of TVs and were not associated with any of the mental health problems; i.e. sense of control,
loneliness, anxiety and depression (p > 0.05). About half of the respondents exhibit- ed a problem with the sense of control by using TVs (50.3%), computers (56.1%) and laptops (47.5%). Around a third of the respondents demonstrated problems of loneliness and anxiety via the use of digital devices and near to one-fifth respondents were facing depression problems through using TVs (20.5%), computers (26.5%) and laptops (21.0%). In the comparison of all mental problems, the use of computers and TV are more affecting factors than the use of laptops.
Table 4
Mental health problems associated with the use of digital devices among university students (N = 326)
Mental health problems Responses Daily use of digital devices (yes, %)
TV (N = 185) Computer (N = 98) Laptop (N = 295)
Sense of control (n = 155) Yes 93(50.3) 55(56.1) * 140(47.5)
Loneliness (n = 130) Yes 69(37.3) 47(48.0) * 115(39.0)
Anxiety (n = 100) Yes 58(31.4) 35(35.7) * 89(30.2)
Depression (n = 70) Yes 38(20.5) 26(26.5) 62(21.0)
*p-value <0.05 (i.e., Significant).
3.5. Effect of using digital devices on mental health problems
Binary logistic regression was performed to assess the effect of using digital devices on mental health problems (sense of control, loneliness, anxiety and depression). The model covered twelve dependent variables (years of using laptop, computer and TV, preferred time to use laptop, computer and TV, sitting position while using digital devices (DD), use of tablets and drink during the use of digital devices, distance of digital devices, and pattern of using laptop, computer and TV. Nagelkerke’s R-squared was used for analysis of model fit. The values higher than 60% for all the mental health problems (sense of control, loneliness, anxiety and depression) indicate a very good model fit (Table 5).
For sense of control, only three variables viz use of computer 2–3 times a week (Odds Ratio = 2.80), daily use of computer (Odds Ratio = 2.73), and use of TV 2–3 times a week (Odds Ratio = 0.40), made unique statistically significant contributions to the model. Computer use 2–3 times a week indicated that the
respondent using a computer 2–3 times a week had around 3 (Odds Ratio = 2.8) times more sense of control problem then those using computer <3 times a week. In case of loneliness, only three variables made a statistically significant contribution:
i.e.: use of laptop at evening and night and daily use of computer made statistically significant contribution to the model where laptop use at night had around 3 times (Odds Ratio = 3.37) more loneliness than those using a laptop in the morning. With respect to anxiety, none of the predictors are significant; however, the use of digital devices via sitting on a chair is a main predictor of depression and it showed that those using digital resources by sitting in bed have twice the depression problem compared to those users who sit on a chair or tool (Odds Ratio = 0.46).
Table 5
Effect of using digital devices on mental problem (N = 326)
Variables Sense of control Loneliness Anxiety Depression
Odds Ratio(95%CI) Odds Ratio(95%CI) Odds Ratio(95%CI) Odds Ratio(95%CI)
Use of laptop by < 4 years Reference Reference Reference Reference
Use of laptop by 4-8 years 1.42(0,74-2,71) 0.90(0.47-1.75) 1.14(0.55-2.36) 0.58(0.27-1.25) Use of laptop by ≥ 8 years 0.978(0.42-2.27) 0.78(0.33-1.86) 1.55(0.63-3.85) 0.55(0.19-1.57)
Use of computer by < 4 years Reference Reference Reference Reference
Use of computer by 4-8 years 0.92(0.44-1.93) 1.24(0.58-2.67) 1.74(0.74-4.07) 1.32(0.54-3.20) Use of computer by ≥ 8 years 0.64(0.29-1.40) 1.57(0.70-3.53) 2.02(0.81-5.02) 1.21(0.45-3.30)
Use of TV by < 4 years Reference Reference Reference Reference
Use of TV by 4-8 years 0.87(0.35-2.18) 1.45(0.56-3.73) 0.93(0.33-2.62) 0.84(0.29-2.46) Use of TV by ≥8 years 0.75(0.33-1.72) 1.42(0.61-3.31) 0.91(0.36-2.29) 0.86(0.32-2.31)
Use of laptop at morning Reference Reference Reference Reference
Use of laptop at day 0.66(0.23-1.89) 2.50(0.77-8.14) 1.30(0.42-3.99) 0.83(0.25-2.72) Use of laptop at evening 0.69(0.26-1.87) 3.35*(1.08-10.14) 1.56(0.53-4.58) 1.07(0.35-3.22) Use of laptop at night 1.16(0.39-3.48) 3.37*(0.99-11.44) 1.15(0.35-3.85) 0.65(0.18-2.33)
Use of computer at morning Reference Reference Reference Reference
Use of computer at day 0.97(0.41-2.30) 1.76(0.68-4.54) 1.64(0.54-4.99) 2.45(0.68-8.81)
Use of computer at evening 0.60(0.23-1.57) 1.36(0.49-3.77) 2.68(0.84-8.51) 3.05(0.80-11.60) Use of computer at night 0.94(0.36-2.42) 1.73(0.62-4.79) 1.89(0.57-6.19) 2.29(0.58-9.15)
Use of TV at morning Reference Reference Reference Reference
Use of TV at day 1.50(0.37-6.12) 2.20(0.51-9.50) 1.56(0.34-7.26) 3.11(0.69-14.02) Use of TV at evening 2.25(0.97-5.18) 0.94(0.39-2.23) 0.10(0.39-2.55) 0.75(0.28-1.99) Use of TV at night 1.21(0.54-2.70) 1.21(0.53-2.80) 1.16(0.47-2.87) 0.80(0.31-2.05)
Use by sitting on bed Reference Reference Reference Reference
Use by sitting on chair/tool 0.76(0.40-1.43) 0.93(0.49-1.74) 0.76(0.39-1.49) 0.46*(0.22-0.95) Use by lying on bed 0.41(0.14-1.19) 1.31(0.46-3.73) 0.84(0.28-2.55) 0.92(0.29-2.96) Use by sitting with laptop on lap 0.70(0.27-1.77) 2.24(0.90-5.57) 1.38(0.54-3.51) 1.11(0.41-2.96) Take tablets/drink 0.75(0.45-1.24) 1.22(0.74-2.02) 1.11(0.65-1.88) 1.71(0.94-3.10)
Use of DD by <1 ft. Reference Reference Reference Reference
Use of DD by 1-2 ft. 1.01(0.57-1.79) 0.71(0.40-1.26) 1.01(0.55-1.84) 1.03(0.52-2.03) Use of DD by 2-3 ft. 0.83(0.36-1.93) 0.50(0.21-1.19) 0.59(0.23-1.53) 1.15(0.43-3.07) Use of DD by ≥ ft. 1.59(0.31-8.20) 0.23(0.04-1.44) 0.97(0.17-5.66) 0.46(0.04-5.02)
Use of laptop < 3 times/week Reference Reference Reference Reference
Use of laptop 2-3 times/week 1.00(0.16-6.19) 2.87(0.45-18.35) 0.95(0.09-9.63) 0.53(0.04-7.33) Use of laptop daily 1.05(0.41-2.68) 1.90(0.75-4.79) 2.02(0.77-5.30) 1.38(0.49-3.88)
Use of computer < 3 times/week Reference Reference* Reference Reference
Use of computer 2-3 times/week 2.80*(1.43-5.46) 1.02(0.52-2.01) 1.77(0.88-3.55) 1.01(0.45-2.26) Use of computer daily 2.73*(1.45-5.14) 2.04*(1.08-3.84) 1.67(0.86-3.25) 1.63(0.78-3.39)
Use of TV < 3 times/week Reference Reference Reference Reference
Use of TV 2-3 times/week 0.40*(0.17-0.92) 1.27(0.56-2.86) 1.62(0.68-3.85) 1.46(0.57-3.72) Use of TV daily 0.79(0.44-1.42) 0.74(0.41-1.34) 1.12(0.63-2.27) 0.88(0.43-1.08)
*p-value <0.05 (i.e., Significant).
3.6. Pattern of self-care for mental health problems among university students Table 6 shows that most of the respondents who have mental health problems and who are not using medicine or meditation exhibit a higher degree in sense of control (74.2%), loneliness (76.2%), anxiety (73%) and depression (64.3%).
Table 6
Pattern of treatment for university students having mental health problems (N = 326)
Mental health problem Using medicine (%) Meditations (%) Taking rest (%) No treatment (%) No response (%) Sense of control
(n = 155) 26 (16.8) 5 (3.2) 38 (24.5) 77 (49.7) 9 (5.8)
Loneliness (n = 130) 23 (17.7) 4 (3.1) 37 (28.5) 62 (47.7) 4(3.1)
Anxiety (n = 100) 21 (21) 4 (4) 31 (31) 42(42) 2 (2)
Depression (n = 70) 21 (30.0) 1 (1.4) 17 (24.3) 28 (40.0) 3 (4.3)
4. Discussion
This study is primarily focused on investigating mental health behaviour and self-care patterns of Nepalese students having access to the use of digital devices. One-third of the participants in the study suffered from addiction by excessive use of digital devices. The excessive users of TVs, computers, and laptops faced the problems of loneliness and anxiety while one-fifth of them were facing the problems of depression. However, the percentages of depression by the excessive use of digital devices among students vary considerably (Morahan-martin & Schumacher 2000;
Yang et al. 2005). Morahan-Martin and Schumacher (2000) found that 8.1% of US college students showed symptoms of addiction (Johansson & Gotestam 2004).
Yang and colleagues (2005) identified 4.9% of Korean senior high school students as excessive users of digital devices. They also reported that the incidence rate of internet addiction among Norwegian youth was 1.98%. Our research also studied the impact of socio-demographic aspects in terms of age, gender, and profession on digital device use. In our study, the male to female ratio for the use of digital devices came to 6.24:1 (281 male and 45 females), which is higher than in other similar studies.
Bloomquist and colleagues (2016) found 35.3% to have mental health prob- lems among social workers on a survey, and CCMH (2019) found that the rate of depression and anxiety have increased by 1.59–1.81% and 1.61–1.87% during the
ten years 2010–2019 among university students respectively, where 55–62% had anxiety and 45–50% had a depression problem from 2013–2019. The change rate of mental health problems among college and university students stands high in the US as well as in other countries (Prince 2015). Even that proportion is comparatively low compared to our research where the proportion of having sense of control is 47.5%, loneliness is 39.9%, anxiety is 30.7%, and depression is 21.5%. The cause may be that the participants of this research were digitally literate and have high academic qualifications.
Significant associations were found between sitting position and loneliness, as well as age and anxiety in this study. Baker and colleagues (2018) found acute negative effects from prolonged sitting with increases in discomfort in the low back and hip/-thigh-buttock areas and cognitive function, with some deterioration in creative problem solving, and suggests that sitting for prolonged periods may have consequences for musculoskeletal discomfort and cognitive function. However, Brink and colleagues (2020) did not find any association between over‐time‐change in sitting posture and psychosocial factors, which might be due to the sample consisting of school children.
Moreover, binary logistic regression showed that the use of computers 2–3 times a week is the main predictor for the sense of control. Similarly, laptop use in the evening is the main predictor of loneliness, while sitting on a chair or stool during digital resource use is the main predictor of depression.
Brenner (1997) and Tsai and Lin (2003) report that younger users are more likely to be vulnerable to excessive use of digital devices as they pay more attention, while the people of the adult age groups will be more easily exhausted by the use of them. In contrast to the research, our endeavors showed the opposite relationship between the use of digital devices and their ages. The study showed people of younger age (20–30) to be less susceptible (15.64 %) to digital device use compared to adults (31–40). Auerbach and colleagues (2018) reported that around 20–35%
students need mental health treatment. CCMH (2019) found that the average rate of treatment for mental health in 2010–2019 was 46-56% by counselling and 31.3–34.8%
by medication among college students. Even that rate was found to be very low in this study, which indicates that users of digital devices are not serious, careful, and sensitive about their health care in the Nepalese context; however, effective services for mental health in the medical sector are not sufficient in Nepal (Angdembe et al.
2017). Vidourek and Burbage (2019), through a structured interview, found that education, treatment measures, and awareness programs are key factors to reducing mental health problems among university students. And by their experimental study, Nozawa and colleagues (2019) approved peer-counselling as an effective measure for controlling mental health problems. Bhattarai (2020) showed that 3.4% of Nepalese have a depression problem.
5. Conclusion
This study found that digital device use produces an adverse effect on mental health.
The study also pointed out mental health problems such as loneliness, anxiety, and depression that stood relatively high among the subjects who used computers and TV as compared to subjects who used a laptop. Similarly, significant associations were found between one’s sitting position and loneliness, age and anxiety, and daily use of computers and a sense of control, loneliness, and anxiety. Computer use 2–3 times a week is the main predictor of sense of control, use of laptop in the evening is the main predictor of loneliness and sitting on a chair or tool during digital device use is the main predictor of depression. The total percentage of participants having mental health problems measured, who were taking medicine and mediation, is only around one-fourth. This indicates that almost all participants are not careful about their mental health problems. However, the research is limited by a single institutional context and further investigation is needed to determine whether these findings apply to the people of other disciplines and across educational contexts.
Moreover, this study lacks some important factors like quality of vision, screen size, screen lighting and slope that affects the mental health of the participants.
Therefore, awareness programs should be implemented by the government or the non-government sector to reduce loneliness, anxiety, and depression. Additionally, related stakeholders should develop and implement self-care, wellbeing, and other related conscious programs through the social media and university curriculum as well as official sites. Information regarding the safe use of digital devices should be communicated at the university level through a proper use of behaviour change communication.
References
Angdembe, M., B.A. Kohrt, M. Jordans, D. Rimal & N.P. Luitel (2017) ʻSituational Analysis to Inform Development of Primary Care and Community-Based Mental Health Services for Severe Mental Disorders in Nepal’, International Journal of Mental Health Systems 11(69), 1–16 (https://doi.org/10.1186/s13033-017-0176-9).
Auerbach, R.P., P. Mortier, R. Bruffaerts, J. Alonso, C. Benjet, P. Cuijpers, K. Demyttenaere, D.D. Ebert, J.G. Green, P. Hasking, E. Murray, M.K.
Nock, S. Pinder-Amaker, N.A. Sampson, D.J. Stein, G. Vilagut, A.M.
Zaslavsky, R.C. Kessler & WHO WMH-ICS Collaborators (2018) ʻWHO World Mental Health Surveys International College Student Project: Prevalence and Distribution of Mental Disorders’, Journal of Abnormal Psychology 127(7), 623–38 (https://doi.org/10.1037/abn0000362).
Baker, R., P. Coenen, E. Howie, A. Williamson & L. Straker (2018) ʻThe Short Term Musculoskeletal and Cognitive Effects of Prolonged Sitting During Office Computer Work’, International Journal of Environmental Research and Public Health 15(8), 1678 (https://doi.org/10.3390/ijerph15081678).
Bhattarai, S. (2020) ʻNepal’s Suicide Rate Vastly Underestimated’, Nepali Times (10 Jan), retrieved 12 Oct 2021 from https://www.nepalitimes.com/here-now/
nepals-suicide-rate-vastly-underestimated/.
Bloomquist, K.R., L. Wood, K. Friedmeyer-Trainor & H.-W. Kim (2016) ʻSelf-Care and Professional Quality of Life: Predictive Factors Among MSW Practitioners’, Advances in Social Work 16(2), 292–311 (https://doi.org/10.18060/18760).
Bonsu, A.S., J.S. Yendork & E. Teye-Kwadjo (2020) ʻThe Influence of Caregiver Stress and Affiliate Stigma in Community-Based Mental Health Care on Family Caregiver Wellbeing’, International Journal of Mental Health 49(1), 35–55 (https://doi.org/10.1080/00207411.2020.1717053).
Brenner, V. (1997) ʻPsychology of Computer Use: XLW. Parameters of Internet Use, Abuse and Addiction: The First 90 Days of the Internet Usage Survey’, Psychological Reports 80(3), 879–82 (https://doi.org/10.2466/pr0.1997.80.3.879).
Brink, Y., Q. Louw & K. Grimmer (2020) ʻDo Changes in Psychosocial Factors, Lifestyle Factors and Sitting Posture Influence the Likelihood of Musculoskeletal Pain in High School Computer Users?’, Physiotherapy Research International 25(4), e1875 (https://doi.org/10.1002/pri.1865).
CCMH (2019) Annual Report: Center for Collegiate Mental Health, retrieved 12 Oct 2021 from https://ccmh.psu.edu/assets/docs/2019-CCMH-Annual-Re- port_3.17.20.pdf.
Chou, C., L. Condron & J.C. Belland (2005) ʻA Review of the Research on Internet Addiction’, Educational Psychology Review 17, 363–88 (https://doi.
org/10.1007/s10648-005-8138-1).
Chou, C. & M.-C. Hsiao (2000) ʻInternet Addiction, Usage, Gratification, and Pleas- ure Experience: The Taiwan College Students’ Case’, Computers & Education 35(1), 65–80 (https://doi.org/10.1016/S0360-1315(00)00019-1).
Christakis, D.A., M.M. Moreno, L. Jelenchick, M.T. Myaing & C. Zhou (2011) ʻProblematic Internet Usage in US College Students: A Pilot Study’, BMC Medicine 9, 77 (https://doi.org/10.1186/1741-7015-9-77).
Colizzi, M., A. Lasalvia & M. Ruggeri (2020) ʻPrevention and Early Intervention in Youth Mental Health: Is it Time for a Multidisciplinary and Trans- Diagnostic Model for Care?’, International Journal of Mental Health Systems 14, 23 (https://
doi.org/10.1186/s13033-020-00356-9).
Crumb, L., T.M. Mingo & A. Crowe (2019) ʻ “Get Over it and Move on” : The Impact of Mental Illness Stigma in Rural, Low-Income United States Popu- lations’, Mental Health & Prevention 13, 143–48 (https://doi.org/10.1016/j.
mhp.2019.01.010).
Fu, K-W., W.S.C. Chan, P.W.C. Wong & P.S.F. Yip (2010) ʻInternet Addiction:
Prevalence, Discriminant Validity and Correlates Among Internet Addiction:
Prevalence, Discriminant Validity and Correlates among Adolescents in Hong Kong’, The British Journal of Psychiatry 196(6), 486–92 (https://doi.org/10.1192/
bjp.bp.109.075002).
Gowthami, S. & S. Venkatakrishnakumar (2016) ʻImpact of Smartphone: A Pilot Study on Positive and Negative Effects’, International Journal of Scientific Engineering and Applied Science 2(3), 473–78, retrieved 12 Oct 2021 from http://ijseas.com/volume2/v2i3/ijseas20160353.pdf.
Hoekstra, A.R. (2009) A Socio-Cultural Analysis of the Use of Clickers in Higher Education, ERIC Number: ED530461 (ProQuest LLC, Ph.D. dissertation, University of Colorado at Boulder).
Johansson, A. & K.G. Götestam (2004) ʻInternet Addiction: Characteristics of a Questionnaire and Prevalence in Norwegian Youth (12–18 Years)’, Scandinavian Journal of Psychology 45(3), 223–29 (https://doi.org/10.1111/
j.1467-9450.2004.00398.x).
Kenny, A., V. Dickson-Swift, M. Gussy, S. Kidd, D. Cox, M. Masood, D. Azul, C. Chan, B. Christian, J. Theobold, B. Hodge, R. Knevel, C. Mckinstry, D.
Couch, N. Hyett, P. Veginadu & N. Doroud (2020) ʻOral Health Interventions for People Living with Mental Disorders: Protocol for a Realist Systematic Review’, International Journal of Mental Health Systems 14, 24 (https://doi.
org/10.1186/s13033-020-00357-8).
Laconi, S., R.F. Florence & H. Chabrol (2014) ʻThe Measurement of Internet Addiction: A Critical Review of Existing Scales and Their Psychometric Prop- erties’, Computers in Human Behavior 41, 190–202 (https://doi.org/10.1016/j.
chb.2014.09.026).
Leung, L. (2004) ‘Net-Generation Attributes and Seductive Properties and In- ternet Addiction’, Cyberpsychology & Behavior 7(3), 333–48 (https://doi.
org/10.1089/1094931041291303).
Lindsay, S., P. Bellaby, S. Smith & R. Baker (2008) ʻEnabling Healthy Choices:
Is ICT the Highway to Health Improvement?’ Health: An Interdisciplinary Journal for the Social Study of Health, Illness and Medicine 12(3), 313–31 (https://doi.org/10.1177/1363459308090051).
Lupton, D. (2017) ʻDigital Health Now and in the Future: Findings From a Par- ticipatory Design Stakeholder Workshop’, Digital Health 3, 1–17. (https://doi.
org/10.1177/2055207617740018).
Mahoney, M.J. (1997) ʻPsychotherapists’ Personal Problems and Self-Care Patterns’, Professional Psychology: Research and Practice 28(1), 14–16 (https://doi.
org/10.1037/0735-7028.28.1.14).
Meskó, B., Z. Drobni, E. Bényei, B. Gergely & Z. Györffy (2017) ʻDigital Health is a Cultural Transformation of Traditional Healthcare’, MHealth 3, 38 (https://
doi.org/10.21037/mhealth.2017.08.07).
Mesmar, S., R. Talhouk, C. Akik, P. Olivier, I.H. Elhajj, S. Elbassuoni, S.
Armoush, J. Kalot, M. Balaam, A. Germani & H. Ghattas (2016) ʻThe Impact of Digital Technology on Health of Populations Affected by Humani- tarian Crises: Recent Innovations and Current Gaps’, Journal of Public Health Policy 37, 167–200 (https://doi.org/10.1057/s41271-016-0040-1).
Ministry of Health, Nepal; New ERA; and ICF (2017) Nepal Demographic and Health Survey 2016 (Kathmandu: Ministry of Health, Nepal) retrieved 13 Oct 2021 from https://www.dhsprogram.com/pubs/pdf/fr336/fr336.pdf.
Morahan-Martin, J. & P. Schumacher (2000) ʻIncidence and Correlates of Patho- logical Internet Use Among College Students’, Computers in Human Behavior 16(1), 13–29 (https://doi.org/10.1016/S0747-5632(99)00049-7).
Nozawa, H., K. Ikegami, S. Michii, R. Sugano, H. Ando, H. Kitamura & A. Ogami (2019) ʻPeer Counseling for Mental Health in Young People – Randomized Clinical Trial’, Mental Health & Prevention 14, 1–7 (https://doi.org/10.1016/j.
mph.2019.200164).
Prince, J.P. (2015) ʻUniversity Student Counseling and Mental Health in the United States: Trends and Challenges’, Mental Health & Prevention 3(1-2), 5–10 (https://
doi.org/10.1016/j.mhp.2015.03.001).
Rooij, A., & N. Prause (2014) ʻA Critical Review of “Internet Addiction” Criteria with Suggestions for the Future’, Journal of Behavioral Addiction 3(4), 203–13 (https://doi.org/10.1556/JBA.3.2014.4.1).
Rosen, L.D., K. Whaling, L.M. Carrier, N.A. Cheever & J. Rokkum (2013) ʻThe Media and Technology Usage and Attitudes Scale: An empirical investigation’, Comput Human Behav 29(6), 2501–11, retrieved 13 Oct 2021 from https://www.
ncbi.nlm.nih.gov/pmc/articles/PMC4338964/.
Saliceti, F. (2015) ʻInternet Addiction Disorder (IAD)’, Procedia - Social and Behavioral Sciences 191, 1372–76 (https://doi.org/10.1016/j.sbspro.2015.04.292).
Scherer, K.R. (1997) ‘The Role of Culture in Emotion-Antecedent Appraisal’, Journal of Personality and Social Psychology 73(5), 902–22 (https://doi.
org/10.1037/0022-3514.73.5.902).
Select Statistical Services LTD (2019) Population Proportion - Sample Size, retrieved 14 Oct 2021 from https://select-statistics.co.uk/calculators/sample-size-calcu- lator-population-proportion/.
Shaw, M. & D.W. Black (2008) ʻInternet Addiction: Definition, Assessment, Epi- demiology and Clinical Management’, CNS Drugs 22, 353–65 (https://doi.
org/10.2165/00023210-200822050-00001).
Sprang, G., J.J. Clark & A. Whitt-Woosley (2007) ʻCompassion Fatigue, Compassion Satisfaction, and Burnout: Factors Impacting a Professional’s
Quality of Life’, Journal of Loss and Trauma 12(3), 259–80 (https://doi.
org/10.1080/15325020701238093).
Tsai, C.-C. & S.S.J. Lin (2003) ʻInternet Addiction of Adolescents in Taiwan: An Interview Study’, Cyber Psychology & Behaviour 6(6), 649–52 (https://doi.or g/10.1089/109493103322725432).
Vidourek, R.A. & M. Burbage (2019) ʻPositive Mental Health and Mental Health Stigma: A Qualitative Study Assessing Student Attitudes’, Mental Health &
Prevention 13, 1–6 (https://doi.org/10.1016/j.mhp.2018.11.006).
Widyanto, L. & M. Griffiths (2006) ‘ “Internet Addiction”: A Critical Review’, International Journal of Mental Health and Addiction 4, 31–51 (https://doi.
org/10.1007/s11469-006-9009-9).
Williams, I.D., T.A. Richardson, D.D. Moore, L.E. Gambrel & M.L. Keeling (2010) ‘Perspectives on Self-Care’, Journal of Creativity in Mental Health 5(3), 320–38 (https://doi.org/10.1080/15401383.2010.507700).
World Health Organisation (2014) Preventing Suicide: A Global Imperative (Luxem- bourg: WHO) retrieved 13 Oct 2021 from https://www.who.int/publications/i/
item/9789241564779.
Yang, C.-K., B.-M. Choe, M. Baity, J.-H. Lee & J.-S. Cho (2005) ‘SCL-90-R and 16PF Profiles of Senior High School Students with Excessive Internet Use’, The Canadian Journal of Psychiatry 50(7) 407–14 (https://doi.org/10.1177/07 0674370505000704).
Young, K.S. (1998) Caught in the Net: How to Recognize the Signs of Internet Addiction and a Winning Strategy for Recovery (Hoboken: Wiley).
Young, K.S. & R.C. Rogers (1998) ‘The Relationship Between Depression and Internet Addiction’, CyberPsychology & Behavior 1(1), 25–28 (https://doi.
org/10.1089/cpb.1998.1.25).
APPENDIX I
Mental Health Problems and Patterns of Self-Care Associated with the Use of Digital Devices among University Students
Section A General Background Name
Age (in years):
Gender: ( ) male ( ) female ( ) other Qualification:
Profession: ( ) teaching ( ) non-teaching Experience (in years):
Section B
Digital resources related information 1. Which types of digital devices do you have?
Name of device Yes No
Mobile Laptop Computer TV
2. For how many years have you used digital devices? (Please specify the length of time you have used the digital devices)
Name of device before 2 and
less years before 2-4
years before 4-6
years before 6-8
years before 8 and more year Mobile
Laptop Computer TV
3. How much time are you spending on digital devices?
Name of device Daily 2-3 times/ week Once a week Seldom
Mobile Laptop Computer TV
4. In which time do you prefer to use digital devices?
Name of device Morning Day Evening Night
Mobile Laptop Computer TV
5. For what purpose do you use digital dives?
( ) Academic activities ( ) non-academic activities 6. How are you using digital devices?
( ) sitting on chair/tool ( ) sitting on bed ( ) lying on bed ( ) sitting with laptop on Lap
7. How far do you stand the digital devices from you?
( ) less than 1 ft. ( ) 1 ft. to 2 ft. ( ) 2 ft. to 3 ft. ( ) more than 3 ft.
8. While you are using a digital device, do you take tablets/ drink coffee/ drink caffeine drinks to keep awake and stay longer?
( ) yes ( ) no
Section C
Mental health and self-care
9. Do you believe that your mental health is affected by the use of digital devices?
Mental health problems Yes No
Sense of control Loneliness Anxiety Depression
10. If yes, how are you treating those problems?
Treating mental health problems Using medicine Meditations Taking rest No treatment No response Sense of control
Loneliness Anxiety Depression