BUDAPEST WORKING PAPERS ON THE LABOUR MARKET
BWP – 2018/4
Does It Matter When Your Smartest Peers Leave Your Class?
Evidence from Hungary
FRITZ SCHILTZ, DENI MAZREKAJ, DANIEL HORN AND KRISTOF DE WITTE
BWP 2018/4
INSTITUTE OF ECONOMICS, CENTRE FOR ECONOMIC AND REGIONAL STUDIES HUNGARIAN ACADEMY OF SCIENCES
BUDAPEST, 2018
Budapest Working Papers on the Labour Market BWP – 2018/4
Institute of Economics, Centre for Economic and Regional Studies, Hungarian Academy of Sciences
Does It Matter When Your Smartest Peers Leave Your Class?
Evidence from Hungary
Authors:
Fritz Schiltz
Faculty of Economics and Business, KU Leuven, Belgium
email: fritz.schiltz@kuleuven.be
Deni Mazrekaj
Faculty of Economics and Business, KU Leuven, Belgium
deni.mazrekaj@kuleuven.be
Daniel Horn senior research fellow
Institute of Economics, Centre for Economic and Regional Studies, Hungarian Academy of Sciences
email: horn.daniel@krtk.mta.hu
Kristof De Witte
Faculty of Economics and Business, KU Leuven, Belgium;
Top Institute for Evidence Based Education Research, Maastricht, the Netherlands
email: kristof.dewitte@kuleuven.be, k.dewitte@maastrichtuniversity.nl
November 2018
3
Demand for secondary school characteristics
Evidence from school choice data in Hungary
Fritz Schiltz, Deni Mazrekaj, Daniel Horn and Kristof De Witte
Abstract
Elite schools in Hungary cherry pick high achieving students from general primary schools.
The geographical coverage of elite schools has remained unchanged since 1999, when the establishment of new elite schools stopped. We exploit this geographical variation in the immobile Hungarian society and estimate the impact of high achieving peers leaving the class on student achievement, behaviour, and aspirations for higher education. Our estimates indicate moderate but heterogeneous effects on those left behind in general primary schools.
Keywords: peer-effects, early-selection, IV estimates, FE estimates
JEL: I21, I24, P36
Acknowledgement:
The authors are grateful to Scott Carrell, Eric Hanushek, Gabor Kezdi, Bas van der Klaauw and
conference participants in Budapest, Tallinn, Leuven, Maastricht, Lyon, Berlin, and Antwerp for
their helpful comments and suggestions. The authors received funding from the European
Union's Horizon 2020 research and innovation programme under grant agreement No. 691676
(EdEN). The authors declare that they have no relevant or material financial interests that relate
to the research described in this paper.
Mi van akkor, ha a legokosabb gyerekek elmennek az osztályból?
A kisgimnáziumi szelekció következményei
Fritz Schiltz, Deni Mazrekaj, Horn Dániel és Kristof De Witte
Összefoglaló
A magyar 6 és 8 osztályos kisgimnáziumok lefölözik a legjobb diákokat az általános iskolákból.
Mivel a kisgimnáziumok az országban csak elszórtan helyezkednek el, elérhetőségük a különböző diákok számára eltérő. Ezt a varianciát kihasználva becsüljük meg a legjobb diákok eltávozásának hatását az általános iskolában maradt társaik 8. évfolyamos szövegértési és matematika tesztpontszámaira, jegyeire illetve a továbbtanulási szándékaira. Eredményeink szerint, ha egy általános iskolai osztályból a kisgimnáziumba elmennek a legjobbak, az átlagosan kicsi negatív hatással van az osztályra, de ez a hatás heterogén: főleg a maradó jó tanulók veszítenek, míg a rosszabb tanulók akár nyerhetnek is vele.
JEL: I21, I24, P36
Tárgyszavak: társak-hatása, korai-szelekció, instrumetális becslés, fix-hatás becslés
Does It Matter When Your Smartest Peers Leave Your Class? Evidence from Hungary.
Fritz Schiltz*, Deni Mazrekaj, Daniel Horn and Kristof De Witte
Abstract
Elite schools in Hungary cherry pick high achieving students from general primary schools. The geographical coverage of elite schools has remained unchanged since 1999, when the establishment of new elite schools stopped.
We exploit this geographical variation in the immobile Hungarian society and estimate the impact of high achieving peers leaving the class on student achievement, behaviour, and aspirations for higher education.
Our estimates indicate moderate but heterogeneous effects on those left behind in general primary schools.
JEL: I21, I24, P36
*Schiltz: Faculty of Economics and Business, KU Leuven, Naamsestraat 69, 3000 Leuven, Belgium (email: fritz.schiltz@kuleuven.be; +32 16 37 42 64); Mazrekaj:
Faculty of Economics and Business, KU Leuven, Naamsestraat 69, 3000 Leuven, Belgium (email: deni.mazrekaj@kuleuven.be). Horn: Centre for Economic and Regional Studies, Hungarian Academy of Sciences, T´oth K´alm´an str. 4. 1097 Budapest, Hungary (email: horn.daniel@krtk.mta.hu); De Witte: Faculty of Economics and Business, KU Leuven, Naamsestraat 69, 3000 Leuven, Belgium; Top Institute for Evidence Based Education Research, Kapoenstraat 2, MD 6200 Maastricht, the Netherlands (email:
kristof.dewitte@kuleuven.be, k.dewitte@maastrichtuniversity.nl). The authors are grateful to Scott Carrell, Eric Hanushek, Gabor Kezdi, Bas van der Klaauw and conference participants in Budapest, Tallinn, Leuven, Maastricht, Lyon, Berlin, and Antwerp for their helpful comments and suggestions. The authors received funding from the European Union’s Horizon 2020 research and innovation programme under grant agreement No. 691676 (EdEN). The authors declare that they have no relevant or material financial interests that relate to the research described in this paper.
1
1 Introduction
Peer effects are believed to influence many social outcomes. Peers may play a role in a person’s health (Cohen-Cole & Fletcher, 2008), empathy (Boisjoly et al., 2006), productivity (Falk & Ichino, 2006), entrepreneurship (Lerner &
Malmendier, 2013) and the propensity to engage in criminal activities (Kling et al., 2005). However, the effect of peers on student achievement is more ambiguous. In a comprehensive review of the literature, Sacerdote (2014) finds that although about half the studies estimate modest to large peer effects on student achievement, another half of the studies do not find any evidence of peer effects at all.
In this paper, we estimate the effect of high ability peers leaving the class on achievement, behaviour, and aspirations of children who were left behind.
The conventional approach to measuring peer effects in education is to estimate a linear-in-means model in which students’ own test scores are regressed on peers’ average test scores. This approach suffers from three limitations (Man- ski, 1993). First, students may self-select themselves into peer groups based on certain unobserved factors (correlated effects). Second, peers may influence each other simultaneously (reflection problem). Third, it is difficult to distin- guish between peer effects due to peers’ achievement (endogenous effects) and peer effects due to peers’ background (contextual peer effects). Given these limitations, recent literature has followed a range of novel identification strate- gies. These include the use of exogenous shocks to peer composition such as hurricanes (Imberman et al., 2012) or the end of race-based busing (Billings et al., 2014), test-score discontinuities for school admission and increases in ad- mission numbers (Abdulkadiroglu et al., 2014; Dobbie & Fryer, 2014; Guyon et al., 2012), random variation in peer characteristics across classes, schools and cohorts (Friesen & Krauth, 2011; Hill, 2017; Lavy & Schlosser, 2011), and experimental evidence based on random assignments of roommates (Sacerdote, 2001; Zimmerman, 2003).
Hungary provides a unique setting to study what happens when the highest achieving peers (typically one or two) leave the class. We exploit the cherry picking of the highest achieving students in grade 6 (age 12) from general pri- mary schools by elite schools. In the 1990s, many elite schools emerged across Hungary as a response to the centralized system of education under communist rule. The geographical coverage of elite schools in the immobile Hungarian soci- ety remained unchanged since 1999, when the establishment of new elite schools stopped. The historical and geographical variation in elite school availability creates differences in the likelihood that the highest achieving peers leave the class. We estimate effects at the class level and instrument the share of students
who left to an elite school by the distance from students’ home addresses to the nearest elite school. As students spend most of their learning time in the class- room, it is natural to expect that a large share of peer effects should arise at the classroom level (Ammermueller et al., 2009; Fischer, 2017; Gaviria & Raphael, 2001). We also conduct several robustness checks including alternative distance measures as instruments, sample restrictions, alternative specifications, and an identification strategy which exploits the natural variation in cohort composi- tion across time within a given school. Finally, additional bounding exercises leaving the best students out of classes in which no one left corroborate that our findings are not mechanical.
The primary contribution of our paper is that we estimate the effect of high achieving peers leaving the class to an elite school on outcomes of the children who were left behind. By contrast, earlier literature mainly focused on the effect of elite schools on those students who left to an elite school (e.g.
Abdulkadiroglu et al., 2014; Dobbie & Fryer, 2014; Hoekstra et al., 2018). We also complement the peer effects literature by focusing on the effect of the highest achieving students, rather than, for example, negative spillovers caused by children from troubled families (e.g. Carrell & Hoekstra, 2010; Carrell et al., 2018). We estimate the impact of the departure of high achieving peers on student test scores for mathematics and reading using data on eight cohorts of primary school students, whom we observe in grade 6 (age 12) and grade 8 (age 14) from 2008 until 2017. For a subsample of students, we also observe the grade point average (GPA), behavioural assessments by teachers, and students’
aspirations for higher education.
Our results suggest that the departure of high achieving peers to an elite school has a negative effect on the students who are left behind in general primary education, on average. In particular, we find that an increase of 5 percentage points in the share of students who left (i.e., one additional high achieving student leaving) leads to a reduction in mathematics test scores by 0.03 standard deviations. We find no effect for reading, on average. Further disentangling these mean effects, we find that students at the bottom of the ability distribution benefit in terms of reading test scores, GPA, behavioural outcomes, and higher education aspirations. Students left behind who are at the top of the ability distribution and who have a high socio-economic status are negatively affected. They are the ones most similar to the students who left to an elite school. Moreover, this negative effect of departing high achieving peers is higher for girls who are left behind than for boys, irrespective of the outcome variable. However, the gender of students who left to elite schools does not seem to matter. We consider several potential explanations behind our results, including class size, class reshuffling, and changes in perceived intelligence.
3
The relevance of our results directly relates to the school choice debate. The effects of top students are at the centre of several policy interventions related to, among others, ability tracking versus detracking, school segregation versus school busing, and racial segregation versus affirmative action (Lin, 2010). In the US, for example, the emergence of charter schools could lead to comparable cherry picking and the subsequent impact for those left behind in public schools.
2 Background
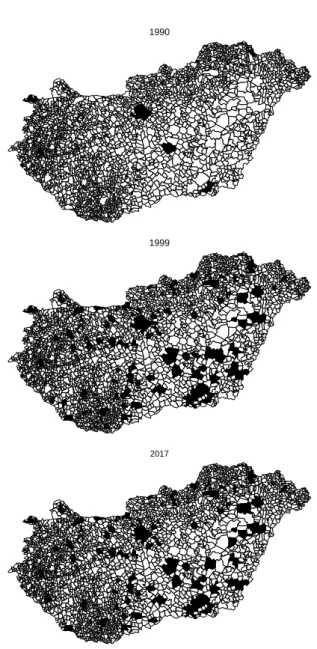
In the Hungarian education system, compulsory education starts at the age of six and ends at the age of sixteen. Children enrol in primary education when they reach school maturity (at the age of six) and continue primary education for four, six, or eight years. Eight-year primary education was introduced under communist rule, and is the most widespread type of primary education in all Central and Eastern Europe. Since 1989, children can also switch to an elite school after finishing the fourth grade (age 10) or after finishing the sixth grade (age 12). The introduction of elite schools is also typical for most countries of Central and Eastern Europe, as a response to the centralized system of educa- tion, uniformly imposed under communism.1 In the year of their introduction (1989), only two elite schools were opened. By 1999, 44 percent of the Hun- garian municipalities included at least one elite school, as depicted in Figure 1.
Historically, the most developed regions (e.g. cities) pushed more for the estab- lishment of elite schools in the education market. As a result, the geographical coverage in 1999 strongly relied on socio-economic status, and was hence far from random. However, as we will show in Section 4 (Table B2), the distance to elite schools is independent of student test scores in grade 6, before students start leaving, conditional on controls.
The aim of elite schools is to prepare students for university. They pro- vide the exact same qualification (´eretts´egi) as the academic secondary schools (gimn´azium)2, although they are considered more prestigious - comparable to grammar schools in the UK, exam schools in the US, or Grandes Ecoles in France. The central government halted elite school formation in 1999. The reason for this was the presumed negative effects on social cohesion. Nonethe- less, although no new elite schools were formed after 1999, the elite schools already in place were allowed to continue their operations. Today, around 300 elite schools operate throughout Hungary, resulting in over 5,000 students leav-
1A more comprehensive overview of the Hungarian education system and the introduction of elite schools is available on http://www.cps.ceu.hu/sites/default/files/publications/cps- working-paper-educational-system-hungary-2010.pdf.
2The two other tracks are a vocational track (szakk¨oz´episkola) and a trade track (sza- kiskola).
Figure 1: Adoption of elite schools in Hungary.
1990
1999
2017
Notes: This figure displays elite school adoption over time in Hungary. Dark areas indicate Hungarian municipalities with at least one elite school. Since the introduction of the first elite school in 1989 in Budapest, their adoption has exploded between 1990 and 1999, when elite school establishment was halted. The geographical coverage of elite schools has remained unchanged since then. This is illustrated in the bottom panel using 2017 data.
5
ing their classes every year to enrol in an elite school - around 6 percent of all primary education students.
Admission to an elite school is mostly based on the successful completion of a written, centrally issued entrance exam. However, each elite school is also allowed to impose additional admission criteria, such as oral exams or certain grades received in the years prior to application. Ultimately, the school principal decides on the admission of students.3 Although most elite schools are public (75%) and do not charge tuition fees, elite schools that are privately organized, as foundation (4%) or church schools (20%) can charge tuition.4
In the Hungarian education system, classes are typically taught by the same teacher in the first four grades, for all subjects. Thereafter, from grade 5 to grade 8, teachers specialize in a certain subject and teach this specific course.
However, the same group of teachers teaches the same students during this period. Once students have departed to an elite school, it is possible, but not frequent, that the school decides to reshuffle classes if there are too few students left in each class. Nonetheless, we formally test, and reject, whether our results are driven by class reshuffling.
3 Data and Descriptive Statistics
3.1 Dataset Construction
Our dataset is constructed by integrating student, class, and school level infor- mation from the National Assessment of Basic Competencies (NABC) database, and the geographic location of students and schools from the Hungarian Academy of Sciences Geography (GEO) database. The NABC covers all students in com- pulsory education in Hungary.5 It includes standardized test scores for mathe- matics and reading that follows the model of the OECD Programme for Interna- tional Student Assessment (PISA). In addition, teacher-graded GPA scores are collected, as well as behavioural assessments done by the teacher for every stu- dent on a Likert scale from 1 to 5, where higher scores indicate better behaviour.
Finally, students are asked whether they aspire to enrol in higher education (at the Bachelor or Master level) after completing compulsory education.6
3The autonomy of schools to select students inhibits us from using a regression discontinuity design due to missing data on admission criteria.
4The remaining 1% of elite school providers is categorized as ‘other’, and includes for-profit companies and ‘multi-purpose small area associations’.
5Earlier studies using this dataset include Kertesi & Kezdi (2011) on the Roma/non-Roma test score gap.
6Given that GPA and behaviour (and higher education aspirations) were teacher- (student-) reported, the share of missing data is higher than for compulsory centralized tests. We observe GPA for 64 percent of the sample, behaviour for 74 percent, and aspirations for 77 percent.
We therefore discuss the effects on these alternative outcome variables in Section 5.4, while
Unlike PISA, which is conducted once every three years, the NABC is con- ducted annually. Each year, the NABC includes test scores of a cohort of students at the end of grade 6 (age 12) and just before graduation from primary school, in grade 8 (age 14). The timing of the first test corresponds to the final month of grade 6 (May) before students leave to elite schools. Considering these moments of data collection, we focus our analysis on the effect of students leav- ing for elite schools after grade 6. In subsequent analyses, therefore, we study two-year differences in test scores between grade 6 and grade 8. This study uses data from 2008 to the most recent records in 2016, encompassing the graduating cohorts in grade 8 of 2010 to 2016.
For each student in grade 6, we obtain a measure of the distance from their home to the nearest elite school. This data is retrieved from the GEO database and is available from 2008 to 2016. Volan, the official Hungarian bus company participated in the establishment of the database. Distance measures were cal- culated using the routes followed by buses of Volan, and indicate the exact distance by bus, in meters, from students’ home addresses to the nearest elite school. In addition, alternative measures such as time in minutes by bus, dis- tance in meters by car, and time in minutes by car are available. We matched all distance measures to students in the NABC data. Given that we are interested in the children who are left behind, we take the mean distance to the closest elite school of each student’s peers (excluding that student’s distance) at the class level. Using student addresses in grade 6 and grade 8, we are also able to assess the mobility of students and households within this two-year period.
3.2 Descriptive Statistics
Summary statistics are displayed in Table 1. Our sample includes 536,846 stu- dents in primary education. We divide this sample into those who leave general education schools for elite schools after grade 6 (“Leavers”; N=38,240) and those who are left behind (“Stayers”; N=498,606). In the final column of Table 1, we display the group-level differences of all the variables.
Elite schools attract exceptionally high achieving students. Students leaving for elite schools score almost one standard deviation higher than the typical student left behind in general primary education on the standardized NABC mathematics and reading tests in grade 6.7 ‘Elite students’ also obtain higher GPA scores on average, are perceived to behave better, and are more likely to aspire enrolling in higher studies.
Students who leave general primary education for elite schools are more
focusing our main analysis on student test scores in Section 5.1.
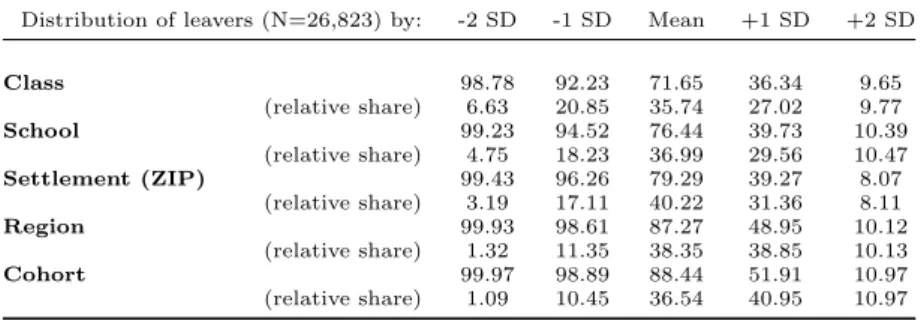
7Table B1 in the Appendix disentangles this comparison for every reference group (class, school, settlement (ZIP-code), region, and cohort).
7
likely to come from families with a higher socio-economic status - proxied by parental education, employment, and the number of books in the family. Also, boys are slightly more likely to enrol in elite schools (although boys comprise 52.5 percent of leavers, the corresponding share of girls among the stayers is 49.9 percent).
In grade 6, the average class size is relatively similar for leavers and stayers, at 23 and 24 students per class, respectively.8 It naturally follows that the departure of high achieving students results in a decreased class size in grade 8 for those left behind, which may also affect test scores (Fredriksson et al., 2013;
Krueger & Whitmore, 2001). In our dataset, however, the number of leavers per class is less than or equal to two in almost 83 percent of the classes, and less than or equal to three in 90 percent of the classes. Hence, this limited class size effect is unlikely to fully explain the results we present in this paper, although class size reductions resulting from leaving peers may play a role.
The mobility of students is very low in Hungary, as almost 93 percent of students do not move between grade 6 and grade 8. The percentage of students who moved and went to an elite school is only 0.4 percent. Two out of three movers in our dataset do not switch schools, which also suggests that school mobility motivated by school choice is very limited in Hungary. The average distance to the nearest elite school is less than half for leavers compared to stay- ers, both at the individual and the class level. This difference already hints at distance being a potential “pull factor” for parents to opt out of general primary schools, in line with the literature on school choice (e.g. Burgess et al., 2015;
Echenique & Yenmez, 2015; Hastings & Weinstein, 2008), and also consistent with the low residential mobility in Hungary. Measuring residential mobility as the share of people who moved to another dwelling within the last five-year period, Hungary ranks 23rd out of 28 EU countries, at a level of mobility (7.4 percent) well below the EU average (17.8 percent).9 This further supports our claim that Hungary offers an interesting setting study the effect of high achiev- ing peers, using distance as an instrument, given the low threat of sorting into areas with elite schools.
Dividing all Hungarian schools into schools where no students left in a given year and schools where at least one student left to an elite school, we see that almost half of students are in schools where the best students are leaving. In terms of student achievement and socio-economic status, the differences between schools are less pronounced than the aforementioned differences between stu-
8However, in grade 8, classes in elite schools consisting of leavers are significantly and substantially larger (30 compared to 21). This can be explained by the fact that elite schools are commonly organized within secondary schools where classes are larger on average.
9As per Eurostat. See: http://ec.europa.eu/eurostat/product?code=ilc hcmp05
Table 1: Descriptive statistics
Stayers(N=498,606) Leavers(N=38,240)
Mean SD Mean SD Diff
Outcome variables Test scores
Mathematics grade 6 1490.320 185.507 1646.725 174.262 -156.405
Mathematics grade 8 1604.049 198.106 1747.011 176.631 -142.962
Reading grade 6 1480.045 193.773 1644.262 166.401 -164.217
Reading grade 8 1554.320 197.706 1709.823 162.976 -155.503
GPA
GPA grade 6 4.003 0.733 4.618 0.433 -0.615
GPA grade 8 3.935 0.776 4.230 0.569 -0.294
Behaviour
Score in grade 6 4.120 0.767 4.638 0.509 -0.518
Score in grade 8 4.085 0.808 4.426 0.615 -0.341
Aspirations
Share in grade 6 0.513 0.499 0.913 0.281 -0.399
Share in grade 8 0.512 0.499 0.903 0.296 -0.391
Student characteristics Gender
Male 0.499 0.500 0.525 0.500 -0.027
Education parents Father
Primary 0.163 0.369 0.031 0.175 0.131
Secondary 0.544 0.498 0.413 0.492 0.131
Higher 0.150 0.357 0.415 0.493 -0.265
Mother
Primary 0.200 0.400 0.034 0.180 0.167
Secondary 0.482 0.500 0.351 0.477 0.131
Higher 0.196 0.397 0.486 0.500 -0.290
Employment parents
Father 0.667 0.471 0.709 0.454 -0.041
Mother 0.624 0.484 0.726 0.446 -0.102
Books at home
<50 0.273 0.446 0.066 0.248 0.207
>50 &<300 0.358 0.479 0.285 0.451 0.073
>300 0.256 0.437 0.525 0.499 -0.268
Class size
Grade 6 23.116 5.446 24.109 4.878 -0.993
Grade 8 21.281 5.518 30.107 5.251 -8.826
Movement
Student moved (G6-G8) 0.073 0.080 0.087 0.086 -0.014
Distance (km) 16.954 16.082 7.030 9.802 9.923
Mean class distance (km) 16.836 14.943 7.598 8.623 9.237
School characteristics Schools where no one left
(54.68%)
Schools where someone left (45.32%)
Mathematics grade 6 1479.887 191.668 1515.765 184.614 -35.877
Reading grade 6 1465.892 199.282 1509.294 191.570 -43.402
GPA grade 6 3.983 0.758 4.090 0.709 -0.107
Behaviour grade 6 4.096 0.786 4.196 0.742 -0.100
Aspirations grade 6 0.471 0.499 0.590 0.492 -0.119
Father Higher Edu 0.122 0.327 0.200 0.400 -0.078
Mother Higher Edu 0.166 0.372 0.250 0.433 -0.085
>300 books 0.223 0.416 0.312 0.463 -0.089
Class size in grade 6 22.194 6.135 23.944 4.641 -1.750
Distance (km) 23.540 15.765 10.597 14.804 12.943
Share of students leaving 0 0 0.100 0.131 -0.100
Notes: All differences (‘Diff’) are significant at the 0.01 level. ‘Stayers’: students left behind in primary schools. ‘Leavers’: students leaving their classes and schools for an elite school. In all subsequent analyses, we standardize mathematics and reading test scores to a mean of zero and unit variance. ‘Schools where no one left’ correspond to schools where in a given cohort no student left to an elite school. ‘GPA’ is the grade point average, graded by the teacher. ‘Behaviour’
is measured as a Likert scale (1-5), graded by the teacher, with higher scores indicating better behaviour. ‘Aspirations’ represents a dummy indicating students’ response to the survey question asking whether he or she aims to enrol in higher education. The latter three outcome variables are presented for the subsample of students where data was observed, at 64%, 74%, and 77%, respectively. ‘Distance’ measures the distance to the nearest elite school in kilometres.
9
dents. This suggests that, within general primary schools, students leaving for elite schools are the highest achievers, and leavers are not simply sorting into general primary schools before grade 6. In schools where at least one student left, the share of leavers is around 10 percent, or approximately two students in an average class in grade 6. For students in these schools, the mean distance to the nearest elite school is significantly lower compared to students in schools where no one is leaving.
4 Empirical Methodology
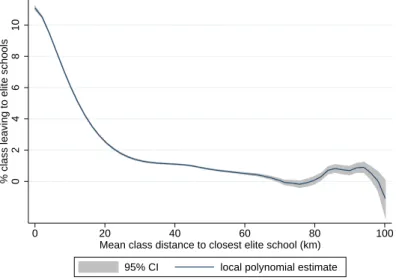
We are interested in the causal effect of high achieving peers on students left behind in general primary education. The share of students who leave for an elite school might be endogenous to the quality of the school. Higher quality schools can either send out more students, as they offer better preparation for elite school entrance exams, or send out fewer students, as parents may prefer to avoid switching costs when quality improvements are likely to be limited. Fig- ure 2 displays the smoothed relationship between the class-level distance to an elite school and the percentage of students leaving a class. This share decreases with distance, approaching zero as the mean class distance grows higher. As suggested by this graph, the distance to an elite school is an important deter- minant of high achieving students’ departure to an elite school. Geographical variation in historical elite school establishment allows us to construct an instru- ment for the share of leavers, based on the distance to the nearest elite schools.
We use this distance-induced variation in the share of leavers to estimate the causal effect on the children who were left behind.
Using Two Stage Least Squares (2SLS), we estimate the second stage:
Yictr=β0+δ2SLSPctr+αXictr+ρr+φt+ictr (1) where Yictr represents the outcome variable in grade 8 of student i in class c, yeart, and regionr. Pctris the percentage of classroom peers enrolled in an elite school. Xictr includes controls both at the individual and class level (outcome variable in grade 6, gender, socio-economic indicators, class size in grade 6). ρr
andφtare vectors of regional and cohort fixed effects.
The corresponding first stage equation is:
Pctr =γ0+γ1Dctr+λXictr+ρr+φt+νictr (2) Dctr represents our instrument, namely, the public transport distance to the closest elite school.10 Xictr includes controls as in equation (1).
10Distance is measured as the class mean of the number of meters on the bus route from a student’s home address (settlement code) to the elite school’s location (settlement code).
Hence, we observe some ‘zero’ distances, as elite schools can be located in a student’s settle- ment. Our findings are robust to the alternative specificationγ1Dctr=θ0D0ctr+θ1Dctrwith
Figure 2: Percentage of leavers in a class as a function of distance.
0246810% class leaving to elite schools
0 20 40 60 80 100
Mean class distance to closest elite school (km)
95% CI local polynomial estimate
Notes: This figure displays a local polynomial smoothed kernel density plot of the unconditional relationship between mean class distance to elite schools and the percentage of leavers in a class.
Three points about equations (1) and (2) are worth mentioning. First, we apply 2SLS using the class mean public transport distance to the closest elite school as an instrument. In the tables presented in Section 5, all first stage F-statistics are well above the conventional weak instruments thresholds. Ad- ditional first stage results are presented in Table B2 for various sets of controls.
Consistent coefficients and F-statistics well above conventional thresholds sug- gest that the mean class distance to an elite school is a strong instrument for the share of students leaving for elite schools.
Second, historically, highly developed regions pushed more for the establish- ment of elite schools in the education market. Therefore, we include region fixed effects and exploit variation in distance within regions. In addition, we include a full set of socio-economic controls (parental education, parental employment, and number of books at home) both at the individual level and at the class level (calculated as the leave-out-mean).11
Third, it is possible that parents living far away from elite schools move close to an elite school before they choose to enrol their children. This would render our instrument invalid. In Table B2 we provide an empirical check of the assumption that students are not sorting into regions with elite schools. As
θ0D0ctr= 0 when the mean class distance to an elite school is larger than 0. When the mean distance is 0,Dctr = 0 whileD0ctr= 1. Hence,θ0 estimates the effect when the mean class distance is 0 andθ1otherwise.
11In Table B3 in the Appendix, we obtain analogous results when repeating our analysis without cities to rule out bias from elite schools clustering in the most developed regions.
11
discussed before, residential mobility in Hungary is extremely low. Given the rigid educational landscape since 1999 in this immobile society, the distance to elite schools should be independent of test scoresbefore students leave to elite schools. Therefore, we regress the class mean distance to elite schools on math- ematics and reading test scores in grade 6, conditional on individual controls, class-level controls and fixed effects. The results in Table B2 suggest there is no significant relationship between grade 6 test scores and the mean distance to an elite school, consistent with the exclusion restriction of our instrument.12 Repeating the regressions with grade 8 test scores (reduced form), we do find a significant effect of distance on mathematics test scores. This finding supports the validity of distance as our instrument and already suggest that there is an effect of high achieving peers leaving the class.
5 Results
5.1 Main Results
Our main analysis focuses on student test scores of those left behind in general primary education (N=498,606). Since mathematics and reading test scores are included as standardized outcome measures, the coefficients of these outcomes can be interpreted as effect sizes in terms of standard deviations.
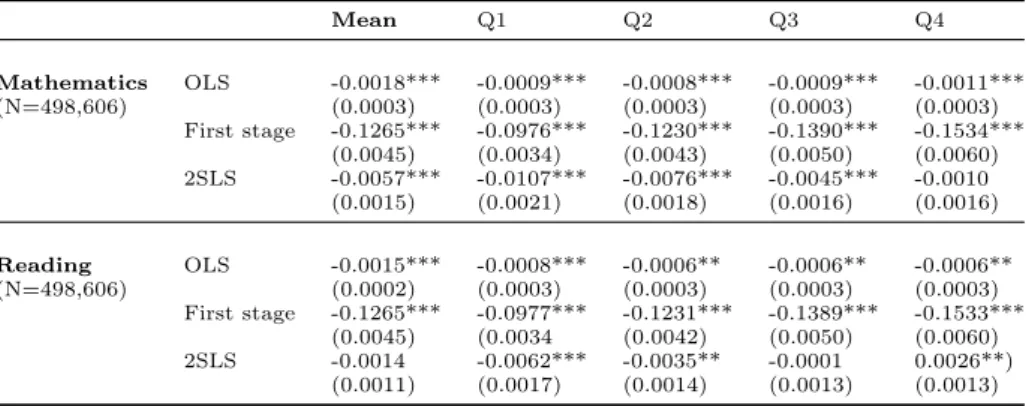
Table 2 reports the estimated effect of high achieving peers leaving for elite schools on the mathematics and reading scores of the students left behind. For both outcomes, we present OLS estimates and 2SLS estimates. The na¨ıve OLS results indicate that, on average, students left behind perform worse in mathe- matics and reading when they are in classes where the percentage of peers who left the class is higher. In terms of magnitude, these negative effects are rather small: a 5 percentage point increase in the share of students leaving, which corresponds to one student leaving in an average class, results in a decrease of 0.009 SD and 0.007 SD in mathematics and reading, respectively. As argued before, these na¨ıve estimates might be prone to endogeneity issues, which could bias our estimates in both directions.
We next turn to 2SLS results. From our first stage estimates, it is clear that the mean class distance is a strong predictor of the percentage of students leav- ing for elite schools, even when a full set of controls is included: an increase of 10 kilometres in the mean class distance coincides with a decrease of more than 1 percentage point in the share of students per class leaving for elite schools.
This negative coefficient corresponds to the negative slope seen in Figure 2. In-
12We also repeat our analysis when restricting the sample to students who did not move between grade 6 and grade 8, and find equivalent results (see Section 5.2, Table B3).
strumenting the share of students leaving by the mean class distance indicates that students left behind perform worse in mathematics when they are in classes where the percentage of peers who left is higher. In terms of magnitude, a 5 percentage point increase in the share of students who left corresponds to a 0.03 SD reduction in mathematics test scores. In other words, in an average class, the departure of one high achieving student lowers the mean mathematics test score of the peers who were left behind by 3 percent of a standard deviation. In con- trast, we cannot find an overall effect on reading. The discrepancy in coefficients for mathematics - and the lack thereof for reading test scores - between na¨ıve OLS estimates and the 2SLS specification could be linked to mathematics being commonly perceived as a better proxy of ability. Hence, when the selectivity of elite schools hinges on mathematical abilities, we expect that the students who leave are particularly the ones with the highest mathematics scores, so larger effects are expected for mathematics than for reading.
Table 2: Impact of high achieving peers on student achievement
Mean Q1 Q2 Q3 Q4
Mathematics OLS -0.0018*** -0.0009*** -0.0008*** -0.0009*** -0.0011***
(N=498,606) (0.0003) (0.0003) (0.0003) (0.0003) (0.0003)
First stage -0.1265*** -0.0976*** -0.1230*** -0.1390*** -0.1534***
(0.0045) (0.0034) (0.0043) (0.0050) (0.0060)
2SLS -0.0057*** -0.0107*** -0.0076*** -0.0045*** -0.0010
(0.0015) (0.0021) (0.0018) (0.0016) (0.0016)
Reading OLS -0.0015*** -0.0008*** -0.0006** -0.0006** -0.0006**
(N=498,606) (0.0002) (0.0003) (0.0003) (0.0003) (0.0003)
First stage -0.1265*** -0.0977*** -0.1231*** -0.1389*** -0.1533***
(0.0045) (0.0034 (0.0042) (0.0050) (0.0060)
2SLS -0.0014 -0.0062*** -0.0035** -0.0001 0.0026**)
(0.0011) (0.0017) (0.0014) (0.0013) (0.0013)
Notes: This table reports OLS and 2SLS estimates of the impact of high achieving peers leaving for elite schools (one percentage point change), and first stage estimates. We control for individual (previous test score, gender, maternal education, and books at home) and class level (gender, ma- ternal education, books at home, and class size in grade 6) characteristics. Class level variables are obtained by leaving out individual observations (leave-out-mean). We also include regional and co- hort fixed effects. Standard errors are clustered at the class level. First stage estimates are obtained using the same set of controls. Corresponding F-statistics are well above conventional thresholds.
F-statistics of corresponding first stage estimates (obtained using the same set of controls) are well above conventional thresholds.
13
5.2 Robustness Checks
Before further disentangling this mean effect by quartile of the ability distri- bution, we assess its consistency across different robustness checks. First, we consider the relationship between distance and test scores in Table B2. Condi- tional on individual and class characteristics, and including region and cohort fixed effects, we cannot find a significant association between test scores in grade 6 and the class mean distance to the nearest elite school. Also, the first stage relationship between distance and the share of leavers appears very stable across specifications. Both findings strengthen our claim that students are not sorting into regions with elite schools.
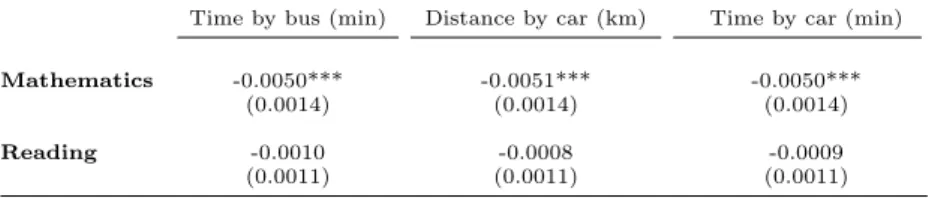
Second, we repeat our analysis using different measures of distance in Table B3 (Panel A). Using the distance by car, or the time of the commute (by car or bus) between students’ home addresses and the nearest elite school as instru- ments yields identical results, and all the first stage F-statistics are well above the conventional weak instruments thresholds.
Third, if students living closer to elite schools exhibit a larger growth po- tential in addition to higher abilities, selection bias could be driving our results.
Therefore, we re-estimate the main results including second and third degree polynomials of previous test scores. The results are presented in Table B3 (Panel B). Again, coefficients obtained when (nonlinear) student growth rates are accounted for are similar to those in Table 2.
Fourth, we restrict our sample to further dismiss parallel explanations behind our results. We restrict our sample to schools that retained a fixed number of classes between grade 6 and grade 8. Focusing on this subsample allows us to rule out the possibility that the observed results are driven by students being reshuffled into new classes. Panel B of Table B3 presents our results. The coefficients obtained for mathematics and reading test scores are similar in sign and size to those reported in Table 2, which suggests that the reshuffling effect is not driving our results.
Next, we leave out the capital, Budapest, and other major Hungarian cities to assess whether our results are driven by elite schools clustered in the most developed regions. Again, Table B3 reports results that are consistent with our main findings.
To further back our claim that distance is not endogenous to school choice in Hungary, we restrict our sample to those classes where no students moved between grade 6 and grade 8. The estimated impact of high achieving peers leaving to elite schools is analogous to the estimated effect on the full sample.
We limit the sample by restricting the mean class distance and the share of leavers to not exceed the mean by more than two standard deviations. This
corresponds to a maximum distance of 45.9 kilometres, and 27.6 percent of leavers - or around five students in an average class. We do this to attenuate the influence of outliers with respect to distance to elite schools and the share of leavers in a class. Although there is some minor variation in the parameter estimates for mathematics and reading test scores, our main results are robust to these additional specifications.
As a last robustness check, we exploit the natural variation in cohort compo- sition across time within a given school to assess our results under an alternative identification strategy. This is accomplished by focusing on schools where at least one student left in every cohort and a series of fixed effects models:
Yist=ψ0+ψ1Pst+ψ2Xist+φt+ωs+ηst+υist (3) Where Pst now measures the share of leavers at the school level and Xist in- cludes school-level characteristics. φt,ωs, andηsare cohort fixed effects, school fixed effects, and school-specific time trends. υist is the error term. Note that both approaches essentially rely on, and benefit from, the immobile Hungar- ian society. Distance is conceptually a valid instrument when parents do not move to send their children to elite schools, while this residential immobility also strengthens the assumption that between-cohort variation in the share of leavers is random.13 Our estimates in Table B4 point at the same direction and are largely similar in size - but, as is common when using IV, estimates appear somewhat amplified (Bingley & Martinello, 2017). Also note that the heteroge- neous effects by ability, discussed below, are similar when using between-cohort variation in the share of leavers (Figure A1 in the Appendix).
5.3 Heterogeneous Effects
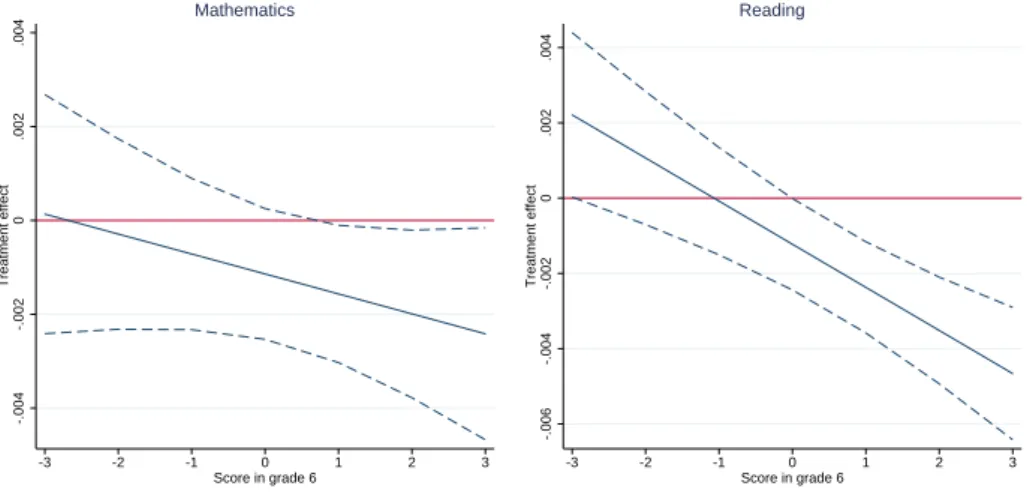
Despite this robust mean effect, it might be that heterogeneous effects with opposite directions result in lower average treatment effects. Therefore, we es- timate the 2SLS model for various subgroups. Table 2 reports effects for every quartile of the ability distribution. Quartiles are constructed using the grade 6 mean score on mathematics and reading. As is clear from Table 2, nega- tive effects are especially pronounced among high achievers left behind (Q1), while negative effects reduce to zero (mathematics) and even become positive (reading) for those at the bottom of the ability distribution (Q4). In terms of magnitude, mathematics test scores for Q1 students reduce by almost 0.05 SD when one student leaves (around 5 percent) to an elite school, and reading test scores increase for Q4 students by approximately 0.01 SD for the same class composition effect.
13In contrast to other studies using between-cohort variation (e.g. Carrell & Hoekstra, 2010), the balancing test cannot hold in our setting, as the share of leavers is directly related to student characteristics. Therefore, we chose the IV method as our main empirical strategy.
15
Table 3: Heterogeneous treatment effects
Gender Socio-Economic Status(SES)
Mean Boys Girls Low SES High SES
Mathematics -0.0057*** -0.0035** -0.0080*** -0.0047 -0.0074***
(0.0015) (0.0015) (0.0017) (0.0035) (0.0014)
Reading -0.0014 -0.0001 -0.0027** 0.0012 -0.0054***
(0.0011) (0.0012) (0.0012) (0.0027 (0.0012)
Notes: This table reports 2SLS estimates of the impact of high achieving peers leaving for elite schools (one percentage point change). We control for individual (previous test score, gender, maternal education, and books at home) and class level (gender, maternal education, books at home, and class size in grade 6) characteristics. Class level variables are obtained by leaving out individual observations (leave-out-mean). We also include regional and cohort fixed effects. Standard errors are clustered at the class level. F-statistics of corresponding first stage estimates (obtained using the same set of controls) are well above conventional thresholds. ‘Mean’ indicates the mean result presented in Table 2. *** Significant at 1% level. ** Significant at 5% level. *** Significant at 10%
level.
However, comparing classes where no one left to classes where some students left, biases our estimates downward by default as leaving students (scoring above average in grade 6, see Table B1) reduce mean scores. Students leaving to elite schools are high ability by definition, and hence mostly concentrated in the top quartile (Q1). As a result, departing students decrease the mean Q1 scores the most, mechanically reducing treatment effects for this subgroup. In Table B5 we conduct a bounding exercise to take out this mechanical effect. We do so by focusing on classes where exactly one student left to an elite school.
By dropping the highest ranked student in the control group, we can bound the effect of the leaving student14 on those left behind, given that not always the highest ranking students are selected for elite schools - as noted in Section 2, schools have autonomy in the admission procedure, allowing principals to deviate from NABC rankings. We also repeat the procedure by looking at classes where exactly two students left to elite schools, and dropping the top two students in the control group. Comparing bounded and unbounded effects in Table B5 suggests that our empirical strategy overestimates the negative effects, yet coefficients remain large and significantly negative. The smaller coefficient when focusing on classes where two students left suggest that the first leaver has a larger marginal effect on those left behind in Q1.
Table 3 presents heterogeneous effects by gender and socio-economic status (SES). We define low SES students as those students whose mothers attained at most a secondary education degree. High SES students’ mothers attained
14Note that we estimate the effect of one leaving student (not the share) and instrument it by the mean class distance (leaving one out) to the nearest elite school. This estimate corresponds to 4.3 (1/23 in the average grade 6 class) times the 1% effect on Q1 students, reported in Table 2.
at least a Bachelor’s degree. For both mathematics and reading test scores, it can be seen that high SES students and girls are negatively affected, with the effect of one leaving student ranging from 0.01 to 0.03 SD decrease in grade 8 test scores. On the contrary, effects are not different from zero for boys and low SES students. Also, the gender of those who are leaving the class to elite schools does not seem to affect the estimated effects (Table B6).
5.4 Alternative Outcomes
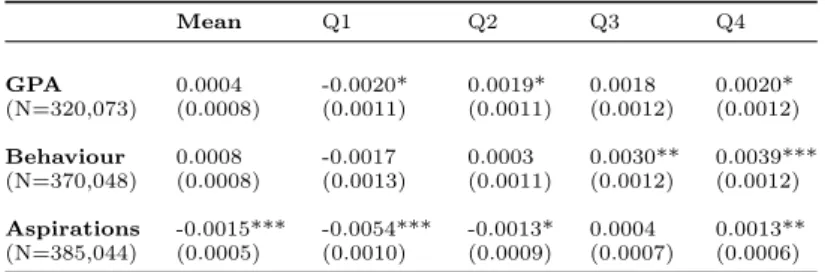
For a subsample of students, we also observe GPA scores (64%), behavioural assessments by teachers (74%), and students’ aspirations for higher education (77%). Table 4 presents mean effects, and treatment effects by quartile in terms of ability in grade 6, as in Table 2. Again, we find that mean results hide con- siderable heterogeneity. Students in Q1 are negatively affected on GPA scores, behaviour, and higher education aspirations in grade 8 when students are leav- ing their class to elite schools, while opposite effects are found for Q4 students.
In terms of magnitude, effects are close to 0 for GPA and behaviour, while one student leaving to elite schools decreases Q1 students’ higher education aspira- tions by over 2 percentage points (76 percent of Q1 students aspires to enrol in higher education in grade 6) and increases Q4 students’ aspirations by almost 1 percentage point (29 percent of Q4 students aspires to enrol in higher education in grade 6).
Table 4: Impact of high achieving peers on alternative outcomes
Mean Q1 Q2 Q3 Q4
GPA 0.0004 -0.0020* 0.0019* 0.0018 0.0020*
(N=320,073) (0.0008) (0.0011) (0.0011) (0.0012) (0.0012) Behaviour 0.0008 -0.0017 0.0003 0.0030** 0.0039***
(N=370,048) (0.0008) (0.0013) (0.0011) (0.0012) (0.0012) Aspirations -0.0015*** -0.0054*** -0.0013* 0.0004 0.0013**
(N=385,044) (0.0005) (0.0010) (0.0009) (0.0007) (0.0006)
Notes: This table reports 2SLS estimates of the impact of high achieving peers leaving for elite schools (one percentage point change). ‘GPA’ is the grade point average, graded by the teacher.
‘Behaviour’ is measured as a Likert scale (1-5), graded by the teacher, with higher scores indicating better behaviour. ‘Aspirations’ represents a dummy indicating students’ response to the survey question asking whether he or she aims to enrol in higher education. We control for individual (previous test score, gender, maternal education, and books at home) and class level (gender, ma- ternal education, books at home, and class size in grade 6) characteristics. Class level variables are obtained by leaving out individual observations (leave-out-mean). We also include regional and co- hort fixed effects. Standard errors are clustered at the class level. F-statistics of corresponding first stage estimates (obtained using the same set of controls) are well above conventional thresholds.
Main results are robust when restricting the sample to students where alternative outcomes were observed. *** Significant at 1% level. ** Significant at 5% level. *** Significant at 10% level.
17
Table 5: Heterogeneous treatment effects for alternative outcomes
Gender Socio-Economic Status(SES)
Mean Boys Girls Low SES High SES
GPA 0.0004 0.0016* -0.0008 -0.0016 -0.0002
(0.0008) (0.0010) (0.0010) (0.0022) (0.0009)
Behaviour 0.0008 0.0038*** -0.0021** 0.0011 -0.0003
(0.0008) (0.0011) (0.0010) (0.0020) (0.0010)
Aspirations -0.0015*** -0.0007 -0.0023*** 0.0001 -0.0030***
(0.0005) (0.0006) (0.0006) (0.0010) (0.0006)
Notes: This table reports 2SLS estimates of the impact of high achieving peers leaving for elite schools (one percentage point change). ‘Mean’ indicates the mean result presented in Table 4. ‘GPA’
is the grade point average, graded by the teacher. ‘Behaviour’ is measured as a Likert scale (1-5), graded by the teacher, with higher scores indicating better behaviour. ‘Aspirations’ represents a dummy indicating students’ response to the survey question asking whether he or she aims to enrol in higher education. We control for individual (previous test score, gender, maternal education, and books at home) and class level (gender, maternal education, books at home, and class size in grade 6) characteristics. Class level variables are obtained by leaving out individual observations (leave- out-mean). We also include regional and cohort fixed effects. Standard errors are clustered at the class level. ‘Mean’ indicates the mean result presented in Table 4. F-statistics of corresponding first stage estimates (obtained using the same set of controls) are well above conventional thresholds.
*** Significant at 1% level. ** Significant at 5% level. *** Significant at 10% level.
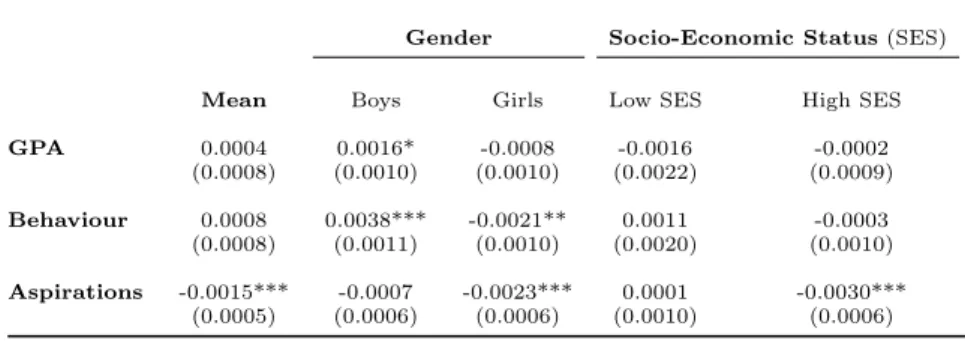
Table 5 presents heterogeneous effects by gender and socio-economic status (SES). Consistent with Table 3, we find negative effects that are more pro- nounced for girls and high SES students, while effects for boys and high SES students are positive or zero. The magnitude of the effects is close to zero for GPA and behaviour, while the negative effect on aspirations for girls (high SES students) amounts to 1 (1.5) percentage point. In grade 6, 58 percent of girls and 62 percent of high SES students aspire to enrol in higher education. Hence, considering the minor treatment - only 1 student is leaving - these effects are rather large.
In sum, our main results hide considerable heterogeneity by students’ prior ability, gender and socio-economic background. We find that the departure of high achieving students to elite schools negatively impacts girls, and high achieving students who are left behind, alongside student from a similar socio- economic background (high SES) as the students who left. Positive effects are observed for those left behind at the bottom of the ability distribution.
6 Discussion
Typically, one or two students leave their class to elite schools. Although the estimated effects encompass class size changes to some extent, class size is un- likely to explain the size of the effects. Restricting the number of leavers in Table B3 did not affect our estimates, which suggests that class size changes are not the (main) driver of the observed effects. Moreover, estimates considering only one or two students leaving (Table B5) showed significantly negative and substantial effects, even after bounding.
Looking at heterogeneous effects, we found that negative effects are con- centrated among high ability, high SES students and girls left behind. The latter effect can be linked to previous studies indicating that girls benefit more from education inputs and interventions in general (Angrist et al., 2009; Katz et al., 2001), and in particular benefit more from brighter peers (Lavy et al., 2012). Given the similarity between high SES, high ability students and the students leaving, it is likely that micro-interactions are at play within subclass- room groups (Lu & Anderson, 2015). These negative effects might stem from losing a close peer. Top students left behind, who likely applied as well, might then be discouraged as their close peers left to an elite school while they did not.
This possible explanation is consistent with the observed drop in higher educa- tion aspirations, while negative noncognitive effects can also be directly linked to the observed decreases in mathematics and reading test scores (e.g Borghans et al., 2008). Since we do not observe who applied to elite schools, and who was rejected, we cannot empirically disentangle the change in perceived intelligence and the pure peer effect.
Looking at the other side of the ability distribution, we find that students left behind generally benefit when top students are leaving their class to elite schools.
The beneficial effects are observed for reading test scores, GPA, behaviour, and aspirations. No effects are found for mathematics test scores. Again, it is possible that students’ perceptions of their relative performance are driving the results. Students leaving to elite schools narrow the ability distribution upon their departure, creating a smaller ‘pond’, boosting the self-esteem of those left behind (Elsner & Isphording, 2017; Murphy & Weinhardt, 2018). This positive effect might be offset for high ability and high SES students by the negative impact of being rejected, or by losing a close peer. Since it is possible that sorting on socio-economic background within a class exists during peer group formation, students from a low socio-economic background may have had less interaction with the students who left for an elite school, as the latter students are typically high SES. As a result, the positive effects dominate for low SES (or low ability) students. Higher perceived intelligence, and self-esteem, among
19
students at the bottom of the ability distribution is consistent with the observed increase in higher education aspirations, and might again translate in positive effects on test scores - although this positive effect was only found for reading.
An alternative explanation for the improved outcomes of low SES (or low ability) students left behind is that teachers are now facing classes with lower mean ability which benefits those at the bottom if teachers teach to the mean.
7 Conclusion
The effect of high achieving peers on student achievement is at the core of many educational discussions on issues such as ability tracking or school segregation.
We provide novel evidence on this effect by exploiting changes in class composi- tion due to the departure of high achieving students to elite schools. Our results suggest that their departure has a negative effect on the students who are left behind in general primary education, on average. In particular, we find that an increase of 5 percentage points in the share of students who left (i.e., one addi- tional high achieving student leaving) leads to a reduction in mathematics test scores by 0.03 standard deviations. We find no effect for reading, on average.
The overall results hide considerable heterogeneity. We observe that the mean negative effect is driven by high ability students left behind, by girls, and by students with a high socio-economic status. By contrast, we find that students at the bottom of the ability distribution, and students with a low socio- economic status, are unaffected and even benefit when their smartest peers leave.
For a subsample of students where teacher-graded GPA, behaviour, and higher education aspirations were observed we obtain similar results. Linking both sets of results, we contemplate changes in perceived intelligence to be the most likely mechanism driving our findings.
It should be noted that we did not evaluate the outcomes of the students who left to an elite school. A potential positive effect experienced by those students might offset the moderate negative effects presented here. Also, the share of students leaving for an elite school is rather limited in Hungary, amounting to 6 percent in an average class. This corresponds to just over one student on average, far from ability tracking structures often present in secondary of higher education. Therefore, mean effects estimated in this paper might be larger in settings where children left behind are facing more severe shocks in peer composition.
References
Abdulkadiroglu, A., Angrist, J., Pathak, P., Yessayan, J., Gold, T., Margolis, J., Dong, Y., Imbens, G., & Hu, W. (2014). The Elite Illusion: Achievement Effects at Boston and New York Exam Schools. Econometrica, 82(1), 137–
196.
Ammermueller, A., Pischke, J.-S., Xf, Rn, X, Steffen, Ammerm¨uller, A., &
Pischke, J.-S. (2009). Peer Effects in European Primary Schools: Evidence from the Progress in International Reading Literacy Study. Journal of Labor Economics,27(3), 315–348.
Angrist, J., Lang, D., & Oreopoulos, P. (2009). Incentives and Services for Col- lege Achievement: Evidence from a Randomized Trial. American Economic Journal: Applied Economics,1(1), 136–163.
Billings, S. B., Deming, D. J., & Rockoff, J. (2014). School Segregation, Educa- tional Attainment, and Crime: Evidence from the End of Busing in Charlotte- Mecklenburg. Quarterly Journal of Economics,129(1), 435–476.
Bingley, P. & Martinello, A. (2017). Measurement Error in Income and School- ing, and the Bias of Linear Estimators. Journal of Labor Economics,35(4), 1117–1148.
Boisjoly, J., Duncan, G. J., Kremer, M., Levy, D. M., & Eccles, J. (2006). Em- pathy or Antipithay? The Impact of Diversity. American Economic Review, 96(5), 1890–1905.
Borghans, L., Meijers, H., & Ter Weel, B. (2008). The role of noncognitive skills in explaining cognitive test scores. Economic Inquiry,46(1), 2–12.
Burgess, S., Greaves, E., Vignoles, A., & Wilson, D. (2015). What Parents Want: School Preferences and School Choice. Economic Journal, 125(587), 1262–1289.
Carrell, S. E. & Hoekstra, M. L. (2010). Externalities in the classroom: How children exposed to domestic violence affect everyone’s kids. American Eco- nomic Journal: Applied Economics,2(1), 211–228.
Carrell, S. E., Hoekstra, M. L., & Kuka, E. (2018). The Long-Run Effects of Disruptive Peers. American Economic Review,108(11), 3377–3415.
Cohen-Cole, E. & Fletcher, J. M. (2008). Is obesity contagious? Social net- works vs. environmental factors in the obesity epidemic. Journal of Health Economics,27(5), 1382–1387.
Dobbie, W. & Fryer, R. G. (2014). The Impact of Attending a School with High- Achieving Peers: Evidence from the New York City Exam Schools. American Economic Journal: Applied Economics,6(3), 58–75.
Echenique, F. & Yenmez, M. B. (2015). How to Control Controlled School Choice. American Economic Review,105(8), 2679–2694.
21
Elsner, B. & Isphording, I. E. (2017). A Big Fish in a Small Pond: Ability Rank and Human Capital Investment. Journal of Labor Economics, 35(3), 787–828.
Falk, A. & Ichino, A. (2006). Clean Evidence on Peer Effects. Journal of Labor Economics,24(1), 39–57.
Fischer, S. (2017). The downside of good peers: How classroom composition dif- ferentially affects men’s and women’s STEM persistence. Labour Economics, 46, 211–226.
Fredriksson, P., ¨Ockert, B., & Oosterbeek, H. (2013). Long-term effects of class size. Quarterly Journal of Economics,128(1), 249–285.
Friesen, J. & Krauth, B. (2011). Ethnic enclaves in the classroom. Labour Economics,18(5), 656–663.
Gaviria, A. & Raphael, S. (2001). School-based peer effects and juvenile behav- ior. Review of Economics and Statistics,83(2), 257–268.
Guyon, N., Maurin, E., & Mcnally, S. (2012). The Effect of Tracking Students by A Natural Experiment.The Journal of Human Resources,47(3), 684–721.
Hastings, J. S. & Weinstein, J. M. (2008). Information, School Choice, and Academic Achievement: Evidence from Two Experiments. Quarterly Journal of Economics, 123(4), 1373–1414.
Hill, A. J. (2017). The positive influence of female college students on their male peers. Labour Economics,44, 151–160.
Hoekstra, M., Mouganie, P., & Wang, Y. (2018). Peer Quality and the Academic Benefits to Attending Better Schools. Journal of Labor Economics, 36(4), 841–884.
Imberman, S. A., Kugler, A. D., & Sacerdote, B. I. (2012). Katrina’s children:
Evidence on the structure of peer effects from hurricane evacuees. American Economic Review, 102(5), 2048–2082.
Katz, L. F., Kling, J. R., & Liebman, J. B. (2001). Moving to Opportunity in Boston: Early Results of a Randomized Mobility Experiment. The Quarterly Journal of Economics, 116(2), 607–654.
Kertesi, G. & Kezdi, G. (2011). The Roma / Non-Roma Test Score Gap in Hungary. American Economic Review,101(3), 519–525.
Kling, J. R., Ludwig, J., & Katz, L. F. (2005). Neighborhood Effects on Crime for Female and Male Youth: Evidence from a Randomized Housing Voucher Experiment. Quarterly Journal of Economics, 120(1), 87–130.
Krueger, A. B. & Whitmore, D. M. (2001). The effect of attending a small class in the early grades on college-test taking and middle school test results:
Evidence from project star. Economic Journal,111(468), 1–28.
Lavy, V. & Schlosser, A. (2011). Mechanisms and Impacts of Gender Peer