APPLICATION OF SUPPORT VECTOR MACHINES ON THE BASIS OF THE FIRST HUNGARIAN
BANKRUPTCY MODEL
Miklós VIRAG
Professor, Department of Enterprise Finances, School of Business Administration, Corvinus University of Budapest, Hungary
E-mail: miklos.virag@uni-corvinus.hu Tamás NYITRAI
PhD Student, Department of Enterprise Finances, School of Business Administration, Corvinus University of Budapest, Hungary
In our study we rely on a data mining procedure known as support vector machine (SVM) on the database of the first Hungarian bankruptcy model. The models constructed are then contrasted with the results of earlier bankruptcy models with the use of classification accuracy and the area under the ROC curve. In using the SVM technique, in addition to conventional kernel functions, we also examine the possibilities of applying the ANOVA kernel function and take a detailed look at data preparation tasks recommended in using the SVM method (handling of outliers). The results of the models assembled suggest that a significant improvement of classification accuracy can be achieved on the database of the first Hungarian bankruptcy model when using the SVM method as opposed to neural networks.
JEL classification codes: C33, C45, C51, C52, C53, G33
Keywords: bankruptcy prediction, classification, data preparation, outliers, support vector machines (SVM), ROC curve analysis
1. INTRODUCTION
During the recent economic crisis the importance of the prediction of corporate bankruptcy has become obvious due to the increasing number of business failures. The prediction of bankruptcy is especially important for creditors, but there are several other stakeholders who can profit from an efficient early warning system that is able to predict the financial distress of companies. For example, regulators can also use early warning systems to supervise the
“financial health” of the banking sector or other companies in the economy.
The cost of corporate bankruptcy is obviously high, but not only for lenders. Business failure can cause losses in other sectors as well. When a firm goes bankrupt, the market where the bankrupt firm operated on becomes less competitive, which is obviously costly for the whole economy. This is the main reason why researchers and practicioners all around the world try to enhance the predictive power of the early warning systems.
This paper would like to contribute to the existing literature with the following:
- it gives a brief overview of the concept of support vector machines (SVM);
1
- it suggests a possible data preparation procedure which is especially suitable for SVM and able to handle the problem of outliers when the number of observations is small;
- it compares the results of the well-known kernel functions with the ANOVA kernel that could be a promising kernel for solving classification problems;
- it proves empirically the superior results of the SVM-based early warning systems against the traditional statistical methods and neural networks;
- it presents the best performing parameter settings for kernel functions that could be useful for further research and practice as well.
Thanks to the rapid development of data mining methods and the related supportive information technology, newer and newer multivariate mathematical statistical methodologies are made available for the purpose of solving classification and function approximation tasks.
All this does not leave bankruptcy prediction unaffected either, which’s main purpose is to maximise classification accuracy when sorting solvent and insolvent businesses.
In a recent paper Kristof and Virag (2012) present how to enhance the classification accuracy of bankruptcy models assembled with the use of the most common multivariate methods (logistic regression, decision trees and neural networks) when combined with other statistical approaches such as principal component analysis and CHAID procedure.
In recent years, authors have increasingly relied on procedures based on artificial intelligence as opposed to conventional multivariate statistical approaches (discriminance analysis, logistic regression, etc.). The reason for this is in part methodological, with multivariate statistical approaches in practice often posing unachievable criteria in respect of data subject to analysis – for instance, a frequent requirement is joint normal distribution and independence of variables.
Although high classification accuracy is achievable even in the absence of these, practice tends to be oriented toward approaches which’s results cannot be challenged on grounds that the employed statistical method’s assumptions related to data are not fulfilled. This tendency is further strengthened by a criterion often posed by practical users, as financial institutions are typically interested in the highest possible classification accuracy and the simple use of models.
Data mining methods, which are increasingly applied in other disciplines in addition to bankruptcy prediction, seek to meet the criteria of robustness and simplicity concurrently.
In our work, we would like to draw researchers’ and professionals’ attention to a data mining technique relatively new and still infrequently used in the economics literature known as
“support vector machine” (SVM). Research findings suggest that applying this approach adds to the classification accuracy of bankruptcy prediction models. We hope that the research results presented below lay the ground for the necessity to rely on the SVM method in regard to other research questions as well.
2. THE SVM CLASSIFICATION ALGORITHM
Like neural networks, this procedure is a data mining tool based on artificial intelligence that can be used for classification and function approximation purposes. In this case, our goal is to sort into appropriate classes solvent and insolvent businesses in the first Hungarian bankruptcy model’s database with higher accuracy than in models presented earlier.
2
The procedure based on statistical learning theory was developed by Vapnik (1995, 1998). In our study we present the core idea of two-group classification.
Let us consider a set of observations as a learning database. Let xi be the input vector of the observed units and yi their assignment to groups. Since we only study two groups, let us mark one group with 1 and the other with -1.
Let us assume that the two groups can be separated linearly. As an illustration, let us have a look at Figure 1.
In Figure 1, the solid circles belong to Group 1 and the rings belong to Group -1. The dotted lines in the figure mark the two straight lines which classify the two groups without errors, while the “dotless” region (margin) is as large as possible. The procedure is designed to define these two straight lines along with the straight line stretching along the middle line of the margin between the two straight lines. This is known as the optimal separating straight line as it is this straight line that is also most likely to correctly classify observations outside the sample. The optimal separating straight line is indicated as a solid line in the figure.
This approach differs from conventional statistical models minimising the risk of empirical error (measured on the training sample). By contrast, the SVM method minimises the overall risk as it is designed also to classify out-of-sample observations with minimum error using the optimal separating straight line.
Hence, only those observations in the two groups are necessary for determining the optimal separating straight line which fall closer to the observations of the other group. In Figure 1, it is these points that the two dotted straight lines pass. These observations are called support vectors. The procedure is aimed to maximise the region between the support vectors (margin).
The middle line of this region is the optimal separating straight line.
In the event of more than two dimensions, the straight line introduced in Figure 1 will be replaced by an optimal separating hyperplane, whose normal vector shall be marked with w.
Now the size of the margin is:
2
‖𝒘‖
Our goal is to maximise the above margin with all observations categorised as 1 located above the hyperplane and all observations categorised as -1 falling below the hyperplane.
Mathematically, therefore, we can arrive at the equation of the optimal separating hyperplane by solving the following task:
Figure 1
Two-group linear separation based on Burges (1998)
(1)
3
𝑚𝑎𝑥 ‖𝒘‖2 provided that
𝑦𝑖(𝒙𝒊∙ 𝒘 + 𝑏) ≥ 1 ∀𝑖 where b is a constant parameter.
Since the above target function is maximal at the same w normal vector at which the target function below is minimal, for mathematical reasons the following target function is applied in solving the optimisation task:
min1 2‖𝒘‖2
Typically, however, the observations to be classified cannot be separated linearly. In such cases, there is no such thing as a perfectly separating hyperplane. In the classification process any hyperplane commits a certain degree of error, which shall be marked with 𝜉𝑖 (𝜉𝑖 > 0).
Another beneficial characteristic of this procedure lies in enabling its user to determine the penalty cost, marked with C in specialised literature, of erroneous classification. In such a case, the above target function or the optimisation task will be modified as follows:
min12‖𝒘‖2+ 𝐶 ∑𝑙𝑖=1𝜉𝑖 provided that
𝑦𝑖(𝒙𝒊∙ 𝒘 + 𝑏) ≥ 1 − 𝜉𝑖 ∀𝑖 where 1 is the number of items in the training sample.
The greater the penalty (C) imposed on the error the more specific the hyperplane is to the sample and thus the problem of overlearning also emerges with the SVM procedure.
Hyperplanes fitted along lower C values also tend to show high classification accuracy for observations outside the training sample.
Where the training sample cannot be classified with the use of a hyperplane we have the option of non-linear separation. In this case, we look for an optimal hypersurface as opposed to the optimal hyperplane that is able to sort the training sample items into the appropriate classes. The SVM procedure links the definition of this hypersurface back to linear separation presented earlier by projecting the observations’ p-dimension attribute vectors into a space with a higher n number of dimensions where the observations can now be separated linearly.
That is illustrated in Figure 2, where the observed two-dimensional objects can be separated linearly in a three-dimensional space.
(2)
(3)
(4)
(5)
(6)
4
We can transform observations into a space with a higher number of dimensions with the help of what is known as kernel functions. Typically, the available pieces of software make possible the direct use of the following kernel functions:1
- polynomial:
𝑘(𝑎, 𝑏) = (𝑎 ∙ 𝑏 + 1)𝑑 - radial basis (Gauss) function:
𝑘(𝑎, 𝑏) = 𝑒−𝛾‖𝑎−𝑏‖2 - hyperbolic tangent (sigmoid):
𝑘(𝑎, 𝑏) = tanh (𝜌𝑎 ∙ 𝑏 + 𝜑)
- ANOVA:
𝑘(𝑎, 𝑏) = �� e−γ(ai−bi)
i
�
d
The type of the kernel function and the d, γ, ρ and φ parameters are optional. There are no theoretical stipulations as to their values; therefore, they – and the kernel function type – should be determined to ensure the model’s best possible fit to the observations in the test sample in order to avoid overfitting.
3. INTERNATIONAL COMPARATIVE ANALYSES OF BANKRUPTCY MODELS PREPERED BY MEANS OF THE SVM PROCEDURE
Co-authors Fan and Palaniswami (2000) were the first to apply this approach to bankruptcy prediction to classify 174 Australian small and medium-sized businesses (SMBs). Using a sample including 86 bankruptcy observations and relying on the financial ratios of the models of Altman (1968), Lincoln (1982) and Ohlson (1980) they concluded that the SVM procedure in combination with twentyfold cross-validation2 resulted in greater classification accuracy than discriminance analysis, neural networks and learning vector quantisation.
1 We performed our calculations using the WinSVM software and the algorithm used by the software includes detailed user guidelines for the programme (Rüping 2000).
2 In cross-validation the sample under review is divided into n parts. Of n sub-samples, n-1 samples are used to train the models and the nth sample is used to test the fitted model in a way to ensure each sub-sample fills the role of the test sample once. The models’ classification accuracy is determined not based on the results of individual samples but as the average of the results of n number of test samples. The benefit of this approach is that sample-specific models can be avoided by its use. Models showing good cross-validation results can be considered much more robust than bankruptcy functions validated on a simple test sample.
Figure 2
Non-linear separation in higher-dimension space based on Hearst (1998)
5
Co-authors Kim and Sohn (2010) used fivefold cross-validation on a sample of Korean SMBs to compare the classification accuracy of logistic regression, neural networks and the SVM model. The best results were produced by the SVM approach used in combination with the RBF kernel function with C=1000 and γ=0.0001 parameters. The authors pointed out that the model’s outcomes were highly sensitive to the selection of parameters in the course of the SVM procedure; therefore, great caution should be exercised in determining parameters.
Boyacioglu et al. (2009) compared the most commonly used classification methods on a small sample of Turkish banks (21 problematic and 44 functioning banks) struggling with financial difficulties in the wake of recession afflicting Turkey in the 1990s. Their findings revealed neural networks’ ability to provide error-free classification while learning vector quantisation yielded faultless results in the test sample. In this small-sample comparative study the SVM procedure proved to be the second best approach.3
Huang et al (2004) used the SVM technique and neural networks to predict American and Taiwanese bond classifications. The authors fitted two models to the samples. As input variables, the first model employed relevant financial ratios used in specialised literature and the second applied all available financial ratios. The results showed that data mining models constructed on financial ratios commonly used in literature had better predictive power than more complex models relying on all available information. Of the four models assembled, the predictive power of the bankruptcy function prepared by means of the SVM approach surpassed the bankruptcy model estimated by applying neural networks.
Dong et al (2008) compared the performance of the SVM procedure with statistical methods (neural networks, logistic regression and discriminance analysis) widely used to predict bankruptcies on data of companies floating on the Shanghai and Shenzen stock exchanges.
The highest classification accuracy was achieved with the use of the RBF kernel function.
Using tenfold cross-validation, the classification accuracy of their model was 95.2% on the training sample while it was 83.2% for the test sample. Surprisingly enough, of the four methods examined, neural networks produced the weakest results with classification accuracy of 77.6% on the training sample and 76% on the test sample. Readers conversant in bankruptcy prediction literature may well deem these classification accuracy values rather too low. The authors explained “weaker-than-usual” results in part with the small sample size (250 businesses) and in part with the insufficient number of observations for building quantitative bankruptcy prediction models due to the “youngness” of the Chinese economy.
Thus, instead of “bankrupt” businesses it is “specially treated” companies on the Chinese stock exchanges that are considered as observations indicating financial problems, a significant characteristic of which is that their profits have remained in negative territory for the past two years. Indeed, that can be an important early warning signal of potential bankruptcy threatening a business but actual bankruptcy does not necessarily follow from it.
Because of this, specially treated companies may well also include fast-growing businesses forgoing short-term profits for long-term growth, which may easily be the case with high-tech manufacturing companies studied by the authors.
Moradi et al (2012) scrutinised the SVM model’s classification accuracy versus multivariate discriminance analysis on a paired sample of companies (204) listed on the Tehran stock exchange between 1999 and 2009. The former and the latter approach correctly classified 93.6% and 87.24% of observations on average, respectively.
3 Classification accuracy was 95% and 91% in the training sample and the test sample, respectively.
6
According to the literature, the SVM technique’s greatest advantage over other methods is that, unlike other approaches, it defines a global optimum on the basis of the geometrical position of data. The learning procedure of neural networks can unfortunately stop at a local optimum, due to which Shin et al (2005) call into question the generalisability of bankruptcy models constructed on neural networks, especially with small sample sizes. The authors have used the data of 2,320 Korean manufacturing companies to study the effect of the training sample size on classification accuracy achieved on the test sample. Their findings suggest that as the sample size decreases – particularly for a training sample with fewer than 200 items – significant differences emerge in classification accuracy between the SVM approach and neural networks on the test sample.
Not in all cases is the SVM technique unambiguously “superior” to neural networks. As Min and Lee (2005) also underlines, the SVM method’s effectiveness largely depends on the kernel function applied and on whether the optimal C and γ parameters can be found. For that purpose multiple cross-validation or a technique known as grid search procedure is most commonly applied. The latter relies on the use of parameters as odd powers of two in numerous combinations and parameters with the highest cross-validated classification accuracies are then selected in assembling the final model. The authors cited above used the RBF kernel function, which is widely employed in the bankruptcy prediction literature, but the 83% classification accuracy achieved on the test sample only exceeded the results of neural networks by half a percentage point. Based on these results, the authors argue that it may also be worth using other kernel functions in bankruptcy prediction in order to maximise classification accuracy achievable by means of the SVM method.
Departing from the practice of bankruptcy prediction based on “conventional” financial ratios, Yoon et al. (2008) attempted to forecast the bankruptcy of small businesses for which there were no financial statements (B/S or P&L account) available. The authors used the businesses’ credit card data to classify good and bad debtors. They performed the modelling with the use of neural networks, decision trees, CART (Classification And Regression Trees) and also discriminance analysis. Their findings revealed the SVM technique’s higher classification accuracy (74.2%) on the test sample over the RBF kernel function; however, this result did not exceed significantly the 73.1% classification accuracy achievable with neural networks in this case either.
Nor was a significant difference found by Lee and To (2010) in performance between neural networks and the SVM approach. They divided their sample of 45 companies listed on the Taiwan stock exchange into a training and a test sample with 20 and 25 items, respectively.
The SVM method correctly sorted all the observations in the test sample but the neural network was also very close with only one error in classification.
In their study, Moro et al. (2011) give a comprehensive analysis of businesses’ bankruptcy risk in 12 Asian countries based on a database containing hundreds of thousands of observations. This huge data set allowed them to study in detail individual financial ratios and the likelihood of bankruptcy. Their findings provide a basis for the hypothesis whereby there is no monotonic relationship between bankruptcy risk and financial ratios. In respect of gearing, the authors identified a U-shaped relationship with the relative frequency of bankruptices but found no similar regularity in the case of other variables. Therefore, models with any hypothesis regarding the theoretical relationship between dependent and independent variables cannot be considered adequate in the field of bankruptcy prevention. The authors confirmed the said hypothesis by comparing the SVM approach with logistic regression.
While the former does not assume a monotonic relationship between dependent and 7
independent variables, the latter does. Their results for the period 2000-2007 showed evidence that the SVM method’s classification accuracy exceeded that achieved by logistic regression in seven out of eight years under review.
The above-cited authors also looked into the relationship between bankruptcy risk and individual financial ratios on a German database containing hundreds of thousands of observations. Interestingly, they found that individual ratios showed a different kind of relationship in the case of German as opposed to Asian businesses, which confirms the need for bankruptcy models also taking into account country-specific factors.
In applying the SVM technique, authors most often use the stepwise method to identify relevant variables. Erdal and Ekinci (2012) studied the applicability of principal component analysis to reduce the number of variables on a sample of 37 Turkish banks. From their comparative analysis they concluded that the SVM method and neural networks showed the highest classification accuracy also when all variables were used as input data in models. In 21 out of 26 models under study, the SVM method’s classification accuracy exceeded the classification performance achieved by neural networks.
In the Hungarian specialised literature, Szűcs (2010) was the first to study the applicability of the SVM approach to the classification of bad and good loan transactions using a database made freely available by the University of California for research purposes. The author cited applied fivefold cross-validation in combination with the RBF kernel function widely used in bankruptcy prediction literature. Although the results are promising (with the area under the ROC curve at 0.92) they have limited value in terms of drawing more general conclusions as the performance of other methods on the data under study are not known.
All in all based on the current research results the SVM method seems to be a promising tool for building early warning systems. The studies presented above show that the accuracy of bankruptcy models can be enhanced by employing this data mining technique. This is the reason why we compare this tool with other classification methods in terms of classification accuracy using the database of the first Hungarian bankruptcy model.
4. THE HISTORY OF THE FIRST HUNGARIAN BANKRUPTCY MODEL
In our comparative analysis, we used as a benchmark the database of the first Hungarian bankruptcy model in order to make an objective comparison between SVM-assisted bankruptcy models and recent years’ bankruptcy functions estimated on the basis of the database.
One can read about the background of the first Hungarian bankruptcy model in Virág and Hajdu’s (1996) results from models estimated on the basis of data from annual reports for 1990. Estimates based on 1991 data can be found in Virág and Kristóf (2005). The latter authors presented how aggregate classification accuracy achievable on the database of the first Hungarian bankruptcy model could be improved by means of neural networks compared to the results of conventional statistical models. Table 1 shows the aggregate classification accuracy of models published on the basis of annual report data for the year 1991.
Method Aggregate
classification accuracy
8
Discriminance analysis 77.9 % Logistic regression 81.8 %
Neural networks 83.6 %
It should be noted that bankruptcy functions estimated by way of the SVM method were prepared on the basis of the annual reports of 156 Hungarian businesses for 1991 (including observations about 78 bankrupt and 78 functioning companies). Therefore, we advise against using the results on current data.
We trust, however, that our results achieved by means of the SVM approach encourage readers to create bankruptcy models on new observations with similarly high classification accuracy.
5. BANKRUPTCY PREDICTION BASED ON DATABASED OF THE FIRST HUNGARIAN BANKRUPTCY MODEL WITH THE USE OF SVM
The first and most important step in modelling with the use of data mining tools is to prepare data for modelling, which in many cases is more difficult and demands greater caution than modelling itself (Kristóf and Virág 2012).
Most modelling procedures are more or less sensitive to observations with strikingly high or low values (outliers). A frequently applied solution is to leave out such values of the analysis altogether. This approach certainly facilitates modelling and can improve models, but excluding outliers may cause the loss of important information; furthermore, this approach is less advantageous if a bank is wishing to rate its clientele and thus cannot afford to exclude existing or prospective customers having outlier values.
Another problem is posed by the multidimensionality of bankruptcy prediction as a classification task and thus it often happens that a particular business has outliers in respect of some ratios while not so with others. Omitting all observations with at least one outlier variable may significantly limit the available data set. That is particularly true of cases where the distribution of businesses by financial ratio is asymmetrical (Sun-Shenoy 2007).
There is no hard and fast definition as to when a variable’s value can be considered an outlier.
That is primarily a function of the distribution of the given ratio. Traditional statistical rules of thumb take as a point of departure the standardised values of ratios (Zij). In the event of normal distribution, over 99% of observations fall within the following interval:
�𝑍𝑖𝑗� < 3
As an alternative approach, observations outside this interval can be considered outliers. It is this rule of thumb that we also followed to identify outliers in our work.
Outlier values most often present a problem since they increase the standard deviation of variables. If a variable is dispersed on a wider range, minor differences between individual
Table 1
Aggregate classification accuracy of models published to date on the basis of the database used in the first Hungarian bankruptcy model based on Virág and Kristóf (2005)
(7)
9
values relatively lose their information content. This may pose a serious problem in bankruptcy prediction as there are often no significant differences shown in financial ratios between bankrupt and functional companies (Lensberg et al. 2006), and so the relative decline in the significance of minor differences may undermine the predictive power of models.
With data mining methods, problems stemming from standard deviation are in practice dealt with by transforming ratios to between 0 and 1 with the use of the formula below:
𝑋𝑖𝑗 − 𝑋𝑗𝑚𝑖𝑛
𝑅𝑗 where 𝑋𝑖𝑗 stands for the jth ratio of the ith company;
𝑋𝑗𝑚𝑖𝑛is the minimum value of the jth ratio; and 𝑅𝑗 is the range of the jth ratio’s standard deviation.
It should be noted that this transformation will also reduce the relative importance of differences between the values of individual variables when outliers are taken into consideration, as in this case it is these values that will define the range of standard deviation and hence assume the value of 0 or 1 after transformation.
In preparing data, we sought to preserve both the information conveyed by outliers and the relative importance of differences between the values of individual variables. To this end, we temporarily ignored observations outside interval (7) and defined the range of standard deviation on the basis of the minimum and maximum values of the remaining sample items for each explanatory variable. Then we adjusted the omitted outlier values to the appropriate end of the [0, 1] interval in accordance with their magnitude.
Caution must be exercised in using quotient-type financial ratios as in practice the following problems can severely weaken the performance of models:
- the numerator and denominator of the ratio(s) are negative numbers (double negative division);
- the denominator of the ratio(s) is zero.
Even though we did not encounter the above problem in using the database of the first Hungarian bankruptcy model, the reader is kindly referred to the work of Kristóf and Virág (2012), which describes in detail how to deal with the above situations in an appropriate manner.
The literature does not contain a clear statement of position as to whether in applying SVM models the maximum number of variables should be used or whether it is necessary to select them. Some authors (Sun-Shenoy 2007) attach great importance to the appropriate selection of variables in data mining models as superfluous variables will disrupt the learning process and erode the discriminatory power of good variables. Others (Erdal and Ekinci 2012), by contrast, have come to the conclusion that with SVM models reducing the number of variables impairs the models’ performance.
(8)
10
In absence of consensus in the literature, we have performed modelling using each of the 17 variables4 available in the database and also two restricted sets of variables. In the restriction process we retained those variables in which’s case significant differences were observed at 5% and 10% significance levels between the average values of bankrupt and functional businesses.5
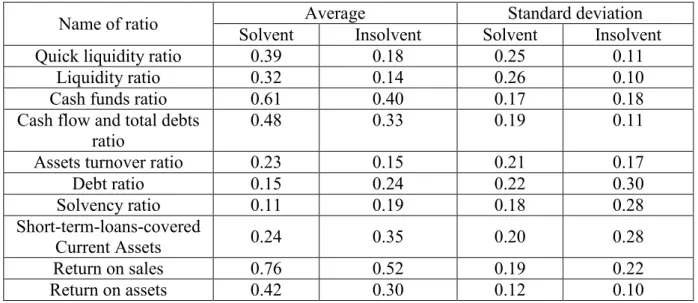
As we only achieved the best results when keeping those variables in the model which were different at the 5% significance level, we will only present the outcomes achieved by means of that set of variables. These financial ratios and their underlying statistical indicators are contained in Table 2.
Table 2. Descriptive statistics
Name of ratio Average Standard deviation
Solvent Insolvent Solvent Insolvent
Quick liquidity ratio 0.39 0.18 0.25 0.11
Liquidity ratio 0.32 0.14 0.26 0.10
Cash funds ratio 0.61 0.40 0.17 0.18
Cash flow and total debts
ratio 0.48 0.33 0.19 0.11
Assets turnover ratio 0.23 0.15 0.21 0.17
Debt ratio 0.15 0.24 0.22 0.30
Solvency ratio 0.11 0.19 0.18 0.28
Short-term-loans-covered
Current Assets 0.24 0.35 0.20 0.28
Return on sales 0.76 0.52 0.19 0.22
Return on assets 0.42 0.30 0.12 0.10
6. RESULTS OF SVM-BASED BANKRUPTCY MODELS
In introducing methodological underpinnings we gave an account of how the SVM procedure can be used even when the objects to be classified cannot be perfectly separated with the help of a linear function. In this case, by means of what is known as a kernel function the values of the observed variables can be transformed into a space with a higher number of dimensions where linear separation can be performed.
There are no theoretical guidelines as to the type and parameters of the kernel function. Most commonly, bankruptcy prediction literature applies the RBF kernel function. The majority of the available pieces of software offer the functions presented earlier for the modeller to choose from.
Importantly, it is not only these kernel functions that can be used in applying the SVM procedure. International experience suggests that the achievable degree of classification accuracy largely depends on the type of the kernel function applied and paramater settings (Yang 2007). For this reason, we also investigated the applicability of the ANOVA kernel
4 For the names and calculation of the 17 financial ratios available in the database of the first Hungarian bankruptcy model see Appendix 1.
5 The tests were performed by comparing values transformed into the [0, 1] interval.
11
function to bankruptcy prediction besides polynomial, Gauss and hyperbolic tangent functions.
Virág and Kristóf (2005) used neural networks to project the status (solvent or insolvent) of 156 Hungarian businesses contained in the database of the first Hungarian bankruptcy model.
They compared the performance of six neural network topologies with six random samples selected from available observations, which they divided into a training and a test a sample in the ratio of 75% to 25%, respectively, in accordance with the practice used in the literature.
For the comparability of our results with those of Virág and Kristóf (2005) we also used these six samples as a basis. In modelling, we applied the four kernel functions presented above to all the samples and defined those parameters against which the error of the test sample remained at a minimum.
It should be emphasised that because of the data mining techniques’ ability to be specific to the observations in the test sample and hence to achieve 100% classification accuracy, it was not the aggregate classification accuracy that we wanted to minimise as a “target function”.
Otherwise the models will become “overfitted” and their results “sample-specific”, and will thus typically show weaker results on the test sample. In such a case, the perfect classification of observations in the test sample would lead us to draw the wrong conclusions about the actual discriminatory power of the model. That is why we thought it would make more sense to minimise the error of the test sample in selecting the models..6
Apart from the above, we also took into account the need for practical application when choosing to minimise the test sample error as the objective of modeling, as in rating customers, financial institutions seek to maximise accuracy when classifying out-of-sample observations.
All that, however, does not mean that we can overlook the results achieved on the training sample, as in practice it can happen that after composing the model the user must rate a business similar to an observation in the training sample. Hence, judgement of the models cannot be based merely on the error of the test sample. Similarly to Virág and Kristóf (2005), we will also assess the performance of SVM models on the basis of aggregate classification accuracy.
In Table 3, we compare the results of SVM models producing the best performance with the highest classification accuracies achieved with neural networks on the 6 samples under review.
The results can be summed up as follows:
- The SVM model’s classification accuracy exceeded that achieved by neural networks on all training samples.
- Of the test samples, the SVM model produced higher classification accuracy on two samples (2 and 4), the same level of accuracy on three samples (3, 5 and 6) and weaker classification accuracy with one forecasting error on the first sample.
- In respect of aggregate classification accuracy, the SVM model outperformed neural networks on all the samples.
6 For a similar reason, co-authors Virág and Kristóf (2005) stopped the learning process of neural networks at the minimum value of the test sample error.
12
Designation Method Sample 1 Sample 2 Sample
3 Sample 4 Sample 5 Sample 6
Training sample
Total errors (units)
NN
22 20 20 26 20 18
Solvent by error (units) 8 3 11 4 9 7
Insolvent by error (units) 14 17 9 22 11 11
Classification accuracy 81.20% 82.91% 82.91% 77.78% 82.91% 84.62%
Total errors (units)
SVM
10 16 15 8 18 16
Solvent by error (units) 7 8 5 1 8 4
Insolvent by error (units) 3 8 10 7 10 12
Classification accuracy 91.45% 86.32% 87,18% 93,16% 84,62% 86,32%
Test sample
Total errors (units)
NN
4 7 5 6 3 3
Solvent by error (units) 1 6 1 5 2 2
Insolvent by error (units) 3 1 4 1 1 1
Classification accuracy 89.74% 82.05% 87.18% 84.62% 92.31% 92.31%
Total errors (units)
SVM
5 5 5 4 3 3
Solvent by error (units) 1 5 1 4 2 3
Insolvent by error (units) 4 0 4 0 1 0
Classification accuracy 87.18% 87.18% 87.18% 89.74% 92.31% 92.31%
Total
Total errors (units)
NN
26 27 25 32 23 21
Solvent by error (units) 9 9 12 9 11 9
Insolvent by error (units) 17 18 13 23 12 12
Classification accuracy 83.33% 82.69% 83.97% 79.49% 85.26% 86.54%
Total errors (units)
SVM
15 21 20 12 21 19
Solvent by error (units) 8 13 6 5 10 7
Insolvent by error (units) 7 8 14 7 11 12
Classification accuracy 90.38% 86.54% 87.18% 92.31% 86.54% 87.82%
Table 3
Classification accuracy of bankruptcy models constructed with the use of neural networks (NN) and the SVM approach
13
Thus, with the use of the SVM model results achieved by means of neural networks substantially improved. It is particularly noteworthy that this new procedure showed better results on those training and test samples where neural networks produced the weakest performance. The advantage of the SVM approach was most strikingly reflected by the fact that aggregate classification accuracy was not weaker than 86.54% on either sample, as opposed to neural networks, which’s highest classification accuracy did not exceed this value.
The results presented here were achieved on the same training and test samples which were generated by Virág and Kristóf (2005) by randomly dividing the available database containing 156 items into training and test samples. This approach is similar to cross-validation, a procedure widely used in the literature, the essence of which is that the predictive power of methodologies to be compared is characterised by the average of classification accuracies achieved on different training and test samples in order to eliminate bias in a model’s measured performance caused by the particular training sample and test sample it was constructed and used on, respectively.
The same approach can be applied in respect of the 6 samples under review. The average classification accuracies achieved on the six samples are shown in Table 4.
Name Method Average classification accuracy Training
sample NN 82.05%
SVM 88.18%
Test sample NN 88.03%
SVM 89.32%
Total NN 83.55%
SVM 88.46%
From the results it can be concluded that they exceed those achieved by neural networks in terms of average classification accuracy on both training and test samples as well as in terms of aggregate classification accuracy. Therefore, the difference is close to 5 percentage points in favour of the SVM technique in respect of all observations, which can be considered a significant improvement especially in view of the fact that these results were achieved by the new data mining method as an average of results generated on six different samples.
Our work has also aimed to determine which function is suited to achieve the best results in bankruptcy prediction. To this end, we applied the four kernel functions presented earlier to all six samples and looked for settings ensuring the highest classification accuracies. Of them we selected the one that ensured the highest possible classification accuracy on the test sample. In the case of individual samples, the (best) results shown in Table 3 were achieved with the kernel functions and parameter settings presented in Table 5.7
7Among the parameters (-) is assigned to those not applicable to particular kernel functions.
Table 4
Average classification accuracies of the constructed bankruptcy models achieved by neural networks (NN) and the SVM method in respect of the six samples under review
14
Sample 1 Sample 2 Sample 3 Sample 4 Sample 5 Sample 6 Type of kernel
function ANOVA Gauss
(RBF) polynomial polynomial Gauss
(RBF) polynomial
Parameters C 0.0034 1 0.0083 0.0023 2 0.0017
degree 4 - 4 5 - 4
γ 7.5 0.26 - - 0.28 -
In most of the samples, the highest classification accuracy was ensured by means of a fourth- or fifth-degree polynomial kernel function combined with a rather low C parameter. With two samples, the best results were achieved by way of a Gauss (RBF) kernel function, again in combination with rather similar C and gamma parameters. These results can be useful in the practical application of the SVM method in respect of the magnitude settings of the parameters.
In the case of Sample 1, we received the most accurate forecasts with the use of the ANOVA kernel function, which was an important achievement as we did not find any research in literature that relied on this kernel function. Given that the best results were achieved by means of this kernel function on Sample 1, a further important and exciting area of research could be to compare kernel functions not applied to bankruptcy prediction before with already known kernel functions in terms of performance.
A procedure commonly used in the literature and also applied to Hungarian bankruptcy prediction (Virág and Kristóf 2008) is the ROC (Receiver Operating Characteristic) curve, specifically the use of the area under curve as a metric. The higher the AUC (area under the ROC curve) value indicating the degree of likelihood that the studied bankruptcy model will assign greater risk of bankruptcy to a randomly selected bankrupt company than to a randomly selected functional company is, the more reliable the bankruptcy model is considered. Table 6 shows the AUC values of the SVM models fitted to the six samples.
AUC p-value
Sample 1 0.984 0.000 Sample 2 0.910 0.000 Sample 3 0.941 0.000 Sample 4 0.951 0.000 Sample 5 0.936 0.000 Sample 6 0.956 0.000
The AUC values calculated on each sample are rather stable, which indicates the robustness of the SVM method. The average AUC value of the six samples is 0.946, which means that
Table 5
Kernel functions and parameters settings showing the best results on individual samples
Table 6
AUC values of SVM models constructed on individual samples and their p-values
15
with the use of this technique there is nearly 95% probability for the model to assign greater risk of bankruptcy to a randomly selected bankrupt company than to a randomly selected functional observation. It can be concluded from the p-values in Table 6 that the area under the ROC curve in the models constructed on individual samples differ from 0.5 at all significance levels in each case. In other words, the results received indicate that the models’
discriminatory power is definitely larger than random guessing. However, in the light of the results that hypothesis can be rejected at all relevant significance levels.
7. SUMMARY
In our work, we applied the SVM procedure, a relatively new and still infrequently used method in applied economics literature, to the database of the first Hungarian bankruptcy model.
Classification accuracies achieved with use of the SVM method were compared with the results received by Virág and Kristóf (2005) on the same database by means of neural networks. Aggregate classification accuracy as an average of the six samples achievable with the SVM method is close to 5% higher than in the case neural networks. We also evaluated the models constructed for prediction reliability based on AUC values and received a strikingly high 95% as an average of the six samples.
In our paper we drew attention to the paramount importance of appropriate data preparation in bankruptcy modelling. Although with our database it was justified to eliminate outliers, we did not omit observations with strikingly high or low values as opposed to general practice.
Having transformed each variable into the [0, 1] interval, by adjusting these outliers to the appropriate end of the interval we retained them in modelling. We performed our analyses without filtering out outliers and by also applying other screening procedures, but the best result was achieved by means of the presented screening technique.
In the process of modelling, in addition to applying kernel functions widely used in the literature we also attempted to apply the ANOVA kernel function, of which we had found no example in the bankruptcy prediction literature. We achieved the best result using this kernel function on one of the six samples under review and therefore came to a relevant finding from the aspect of both scientific research and practical application.
References
Boyacioglu, M. A. – Kara, Y. – Baykan, Ö. K. (2009): Predicting Bank Financial Failures Using Neural Networks, Support Vector Machines, and Multivariate Statistical Methods: A Comparative Analysis in the Sample of Savings Deposit Insurance Fund (SDIF) Transferred Banks in Turkey. Expert Systems with Applications, 36: 3355- 3366.
Burges, C. J. C. (1998): A Tutorial on Support Vector Machines for Pattern Recognition.
Data Mining and Knowledge Discovery, 2(2): 955-974.
Ding, Y. – Song, X. – Zen, Y. (2008): Forecasting Financial Condition of Chinese Listed Companies Based on Support Vector Machines. Expert Systems with Applications, 34:
3081-3089.
Erdal, H. I. – Ekinci, A. (2012): A Comparison of Various Artificial Intelligence Methods in the Prediction of Bank Failures. Computational Economics, Online First Articles,
16
http://link.springer.com/article/10.1007/s10614-012-9332-0 (accessed 4 November 2012).
Fan, A. – Palaniswami, N. (2000): Selecting Bankruptcy Predictors Using a Support Vector Machine Approach. Proceedings of the International Joint Conference on Neural Networks.
Hearst, M. A. (1998): Support Vector Machines. IEEE Intelligent Systems, 13(4): 18-28.
Huang, Z. – Chen, H. – Hsu, C. H. – Chen, W. H. – Wu, S. (2004): Credit Rating Analysis with Support Vector Machines and Neural Networks: A Market Comparative Study.
Decision Support Systems, 37: 543-558.
Kim, H. K. – Sohn, S. Y. (2010): Support Vector Machines for Default Prediction of SMEs based on technology credit. European Journal of Operational Research, 201: 838-846.
Kristóf, T. – Virág, M. (2012): Data Reduction and Univariate Splitting – Do they Together Provide Better Corporate Bankruptcy Prediction? Acta Oeconomica, 62(2): 205-227.
Lee, M. C. – To, C. (2010): Comparison of Support Vector Machine and Back Propagation Neural Network in Evaluating the Enterprise Financial Distress. International Journal of Artificial Intelligence & Applications, 1(3): 31-43.
Lensberg, T. L. – Eilifsen, A. – McKee, T. E. (2006): Bankruptcy Theory Development and Classification via Genetic Programming. European Journal of Operational Research 169: 677-697.
Min, J. H. – Lee, Y. C. (2005): Bankruptcy Prediction Using Support Vector Machine with Optimal Choice of Kernel Function Parameters. Expert Systems with Applications, 28:
603-614.
Moradi, M. – Sardasht, M. S. – Ebrahimpour, M. (2012): An Application of Support Vector Machines in Bankruptcy Prediction; Evidence from Iran. World Applied Sciences Journal, 17 (6): 710-717.
Moro, R. – Hardle, W. – Aliakbari, S. – Hoffmann, L. (2011): Forecasting Corporate
Distress in the Asian and Pacific Region, Economics and Finance Working Paper No.
11-08. Department of Economics and Finance, Brunel University.
Rüping, S. (2000): MySVM – Manual. http://www-ai.cs.uni-
dortmund.de/SOFTWARE/MYSVM/mysvm-manual.pdf (accessed 20 November 2012).
Shin, K. S. – Lee, T. S. – Kim, H. J. (2005): An Application of Support Vector Machines in Bankruptcy Prediction Model. Expert Systems with Applications, 28: 127-135.
Sun, L. – Shenoy, P. P. (2007): Using Bayesian Networks for Bankruptcy Prediction: Some Methodological Issues. European Journal of Operational Research, 180: 738-753.
Szűcs, I. (2010): Support vector gépek alkalmazása hitelpontozó kártyák fejlesztésében (The Application of Support Vector Machines in Developing Scorecards). Acta Agraria Kaposváriensis, 14(3): 173-182.
Vapnik, V. M. (1995): The Nature of Statistical Learning Theory. New York: Springer.
Vapnik, V. M. (1998): Statistical Learning Theory. New York: Springer.
Virág, M. – Hajdu, O. (1996): Pénzügyi mutatószámokon alapuló csődmodell-számítások (Financial Ratio Based Bankruptcy Model Calculations). Bankszemle, 15(5): 42–53.
Virág, M. – Kristóf, T. (2005): Neural Networks in Bankruptcy Prediction – a Comparative Study on the Basis of the First Hungarian Bankruptcy Model. Acta Oeconomica, 55(4): 403–425.
Virág, M. – Kristóf, T. (2008): Vizuális klaszterező csődmodellezés többdimenziós skálázás segítségével (Bankruptcy Modelling with Visual Clustering Using Multidimensional Scaling). In: István Bartók, Judit Simon (szerk.) 60 éves a Közgáz: A jubileumi tudományos konferencia alkalmából készült tanulmányok. Aula Kiadó: Budapest, pp 11-24.
17
Yang, Y. (2007): Adaptive Credit Scoring with Kernel Learning Methods. European Journal of Operational Research 183: 1521-1536.
Yoon, J. – Kwon, J. S. – Lee, C. H. (2008): Bankruptcy Prediction for Small Businesses Using Credit Card Sales Information: Comparison of Classification Performance.
Proceedings of the 9th Asia Pacific Industrial Engineering & Management Systems Conference: 2920-2935.
Appendix 1 – Name and calculation formula of the applied financial ratios
Name of ratio Calculation of ratio
Quick Liquidity Ratio (Current Assets – Inventory) / Short-term Liabilities Liquidity Ratio Current Assets / Short-term Liabilities Cash Funds Ratio (%) (Cash / Total Assets) × 100 Cash-Flow and Total Debts Ratio Cash-flow / Total Debts
Current Assets Ratio (%) (Current Assets / Total Assets) × 100
Capital Coverage Ratio (%) [(Invested Assets + Inventory) / Own Equity] × 100 Assets Turnover Ratio Net Sales / Total Assets
Inventory Turnover Ratio Net Sales / Inventory
Accounts Receivable Turnover (days) (Accounts Receivable × 360) / Net Sales Debt Ratio (%) (Liabilities / Total Assets) × 100 Own Equity Ratio (%) (Own Equity / Total Assets) × 100
Solvency Ratio Liabilities / Own Equity
Long-term-loans-covered Investments (%) (Long-term Loans / Invested Assets) × 100 Short-term-loans-covered Current Assets (%) (Short-term Loans / Current Assets) × 100
Return on Sales (%) (After-tax profit / Net Sales) × 100 Return on Assets (%) (After-tax profit / Own Equity) × 100 Receivable and Payable Accounts Ratio Accounts Receivable / Accounts Payable
18