FISCAL ADJUSTMENT AND ECONOMIC GROWTH IN THE EUROPEAN UNION
1. INTRODUCTION
Although the current economic crisis put deficit financing in the centre of atten- tion, it has been a general practice since the early 1970s, carried out on a permanent basis in the majority of European countries. Such behaviour triggered an increase in the debt stock relative to the GDP; that is, the pro-cyclical fiscal policy was hardly ever able to achieve its classical objective to stabilise the national economy (EC 2000). The aim of this paper is to map out what may determine a fiscal consolida- tion to be successful in terms of a reduced debt ratio and a positive economic growth; to identify those conditions/factors which can be responsible for delivering these desired effects. However, the paper points further since it tries to reconcile the findings of our short data analysis and case studies with the experience of one of the new member states of the EU.
Following the short introduction, Part 2 elaborates on a simple data analysis of a sample of old member states, concentrating on the large fiscal adjustments and their macroeconomic consequences such as the debt-to-GDP ratio and economic activity.
A short data analysis can be indicative in several respects; however, country case studies may contribute to a better understanding of how governments were able to implement not just large but also permanent and growth-accelerating fiscal contrac- tions. Accordingly, in Part 3, five cases have been selected for further study: Ireland (1987–89), Denmark (1983–84), Netherlands (1993 and 1996), Great Britain (1997–98) and Sweden (1996). Hopefully, the case study approach makes it possible to concentrate on those conditions/factors that may prove to be indispensable for The current world economic crisis induced countries to launch wide-scale spending programmes all over the world. Member states of the European Union have not been an exception to this trend. While deficit spending may increase the aggregate demand, it can also accelerate indebtedness and make the required spending cuts politically risky later on. However, deficit financing is not a new phenomenon in the EU; it has been widely practiced in the last couple of decades. As the crisis seems to come to an end, countries with huge deficits should adopt exit strategies now, thereby reducing deficit and debt and reintroducing fiscal discipline, a requirement laid down in the Stability and Growth Pact. Nevertheless, former adjustment processes can provide ample evidence for successful and politically viable fiscal consolidations. In certain cases, even economic activity started to accelerate as a response to the well- designed adjustment measures. Based on the previous experiences of EU states, the aim of this paper is, therefore, to identify the conditions that may determine a fiscal consolidation to be successful in terms of a reduced debt ratio and a positive economic growth.
success, especially the composition of fiscal adjustment and the institutional envi- ronment, such as the reform of the budgetary process. Part 4 concludes.
2. SUCCESSFUL FISCAL CONSOLIDATIONS: A COMPARATIVE DATA ANALYSIS
First of all, we need to specify what is meant by successwith respect to a fiscal con- solidation. In the following, “successful fiscal adjustment” means that a (i) relatively large fiscal consolidation provides (ii) a permanent recovery in public finances and also (iii) a recovery (or acceleration) in economic activity.1Accordingly, by using the relevant literature, three definitions have been adopted for our specific purposes.
(Definition 1) “Relatively large fiscal adjustment”: a fiscal consolidation in which the cyclically adjusted primary balance improves by at least 1.5 percent- age points of the GDP.
(Definition 2)“Permanent adjustment”: a fiscal adjustment in year t is perma- nent if the gross debt-to-GDP ratio is at least 5 percentage points of the GDP lower in yeart+3 than in year t.
(Definition 3)“Growth-accelerating or expansionary permanent consolida- tion”: a permanent fiscal adjustment in year t is expansionary if the average real GDP growth rate in years t+2 and t+3 exceeds the average real GDP growth rate measured in years t–2and t–1.
First, the so-called “relatively large fiscal adjustment” will be identified in the EU-14 between 1980 and 2005. Second, the latter group will be restricted to those episodes where the debt-to-GDP ratio fell substantially, providing a permanent con- solidation. Third, the growth-effects of adjustment – as the politically most impor- tant consequence – will also be taken into account, while assessing the macroeco- nomic consequences of fiscal consolidations.
(Ad 1)In the relevant empirical studies, fiscal consolidation is always defined in terms of a given improvement in the specified form of fiscal balance over a given time period. Defining the measure of adjustment is always critical since the results may be sensitive to the chosen concept. A minimum of a 1.5 percentage point improvement in the primary fiscal balance (in cyclically adjusted terms) is usually characterised as a very tight adjustment indeed, which is not undertaken by govern- ments too often.2The relatively high threshold applied in our study enables us to
1 By focusing on fiscal aggregates and their macroeconomic consequences (such as debt-reduction and economic growth), the data set is comprised of the EU-14 (except Luxembourg) between 1980 and 2005. The data were taken from two sources. Fiscal aggregates are excerpted from the Economic Outlook of the OECD (see OECD 2009), while the data on economic growth were provided by the Statistical Annex of the European Economy, European Commission (1999 and 2009)
2 The norm in the literature is to define changes in the cyclically adjusted primary balance below +/- 0.5 percentage point as neutral, while changes between +/- 0.5 percentage point and +/- 1.5 (sometimes 2) percentage point as expansionary/tight. Above 1.5 (or sometimes 2) the change is said to be very expan- sionary or very tight. See especially Alesina and Perotti (1995), Alesina and Ardagna (1998) and Hagen et al. (2001).
select just a few, probably the most robust cases of fiscal adjustments. Moreover, the magnitude itself makes it difficult to achieve such an enormous consolidation by one-off measuresexclusively – at least not too frequently. As far as the specification of the balance is concerned, the OECD's cyclically adjusted (or structural) balance was chosen in order to filter out the effects of business cycles. With cyclically adjust- ed terms, the discretionarypart of fiscal impetus can be detected.3The reason for concentrating on the primary balance is that interest payments are out of the direct competence of decision-makers in the annual budgeting process, where the politi- cal decisions are made.
Accordingly, the total number of annual observations in the sample of EU-14 over the period of 1980 and 2005 is 375 (25 x 15), out of which 62 episodes proved to be exceptional adjustments, based on our Definition 1.4 Each of the 14 countries embarked on at least one large consolidation throughout the scrutinised period, although with a rather different frequency. While France, Germany and Spain reduced its cyclically adjusted primary balance only once, Finland, Greece, Ireland, Italy, Portugal adopted severe measures several times. Nevertheless, the number of exceptional fiscal episodes exclusively cannot say anything about the degree of fis- cal discipline or the success of an adjustment. The fact that Germany adopted a severe contraction only once clearly reflects the fact that this country was the ideal- type case of the stability-policy during the eighties and nineties. Intuitively, the more frequent adjustments there are in a country, the less disciplined are public finances.
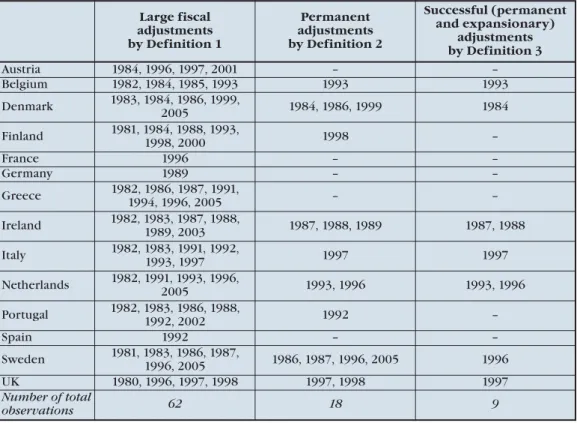
(Ad 2)Following our definition of successful fiscal consolidation, the group of large fiscal episodes (62 in total) will be restricted to those only which proved to be permanent (see Definition 2). In our sample, less than one-third of the large fiscal adjustments provided the required 5 percentage point drop in the debt ratio, there- by qualifying for the status of a permanent adjustment (in concrete numbers: 18 out of the total 62 episodes – see Table 1). That is, two-thirds of the attempts to consoli- date public finances ended up without the hoped results. Interestingly, the selected 18 episodes gravitated to 10 countries only, out of which Denmark, Ireland and Sweden experienced at least three such successful occasions.
It was also checked in our sample whether the 5 percentage point decline occurred earlier than the maximum three years. The results are surprising: only four out of the 18 episodes required three years to become effective, the rest provided a significant fall in the debt-to-GDP ratio within one or two years already. More impressively, in half of the cases, the decline in debt over the three year period was above 10 percentage points. Ireland for instance produced a staggering cumulated 36.5 percentage point decline between 1986 and 1992. The same country experi- enced, however, a catastrophic fiscal consolidation just a few years earlier, in 1982–83, when the unsuccessful attempt ended up with a 38.4 percentage point total increase in the debt-to-GDP ratio by 1986. The UK (1998–2001), the Netherlands (1996–99), Belgium (1993–96), Denmark (1984–87), Italy
3 Detecting the cyclical component in fiscal variables is not without controversies, however (see espe- cially P. Kiss and Vadas 2005).
4 Each episode is enlisted in Table 1.
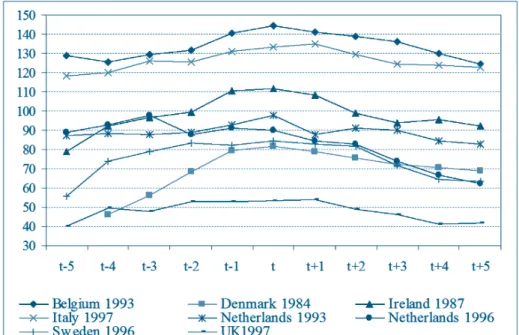
(1997–2000) and Sweden (1996–99 and 2005–08) also experienced a robust drop in the debt ratio due to fiscal contraction. It is worth noticing, however, that neither the UK nor Sweden belongs to the single currency area, for these countries the ulti- mate reason for fiscal restructuring was not simply the fulfilment of the Maastricht numerology. On the other hand, Austria, France, Germany, Portugal and Spain – all are members of the euro-zone – never experienced significant drops in their debt ratios between 1980 and 2005, albeit some of them initiated large scale consolida- tions.5(Further information in Figure 1.)
Source: own compilation based on the data set of OECD (2006).
Note: 18 episodes proved to be permanent according to our Definition 2, but the Figure displays only eight of them which also provided some acceleration in economic output.
Figure 1 Large-scale adjustments with a significant drop in the debt-to-GDP ratio
(Ad 3) A large fiscal consolidation was said to be successful if not just the debt ratio fell significantly, but economic activity also accelerated due to the adjustment efforts. That growth has been chosen as a part of the definition of success can be rationalised by the fact that without the ultimate growth effects, which can make fis- cal contraction more acceptable by the public, it is hard to believe that politicians would be willing to embark on wide-scale consolidations programmes (see especial- ly Benczes 2008). Based on our Definition 3,nine episodes out of the total 18 large
5 Italy, another EMU member state, provided a rather hectic performance during the nineties by strug- gling with reducing its debt-ratio. The first attempt proved to be a total failure: the debt ratio increased between 1993 and 1996 by 11 percentage points. The negative trend was broken off only by the 1996- 97 consolidation attempt, assuring Italy's position among the members of the euro-zone.
and permanent adjustments proved to be growth-supporting in our sample.6See Table 1.
Table 1 Summary table of successful adjustments in the EU-14 (the year in which fiscal adjustment evolved)
Source: own construction.
It might be surprising indeed that more than half of the large and permanent adjust- ments qualified also for being growth-supporting. According to the Keynesian argu- ment, a large and permanent adjustment ends up in a deceleration of economic activity due to the positive fiscal multiplier. However, in our sample it turned out that quite a few episodes do not support this general claim. In fact, except for Italy (1997), these fiscal episodes provided some increase in the level of economic activ- ity in the first year already. Such surprising outcomes are often labelled as the per- verse effects of fiscal policy, which also received a new name in modern macro economy: non-Keynesian effects.7
6 It is reasonable, however, to reduce the nine episodes to eight only in the further study, because Ireland proved to be successful in two consecutive years (1987–88).
7 The term “non-Keynesian effects” refers by definition to a situation where the fiscal multiplier turns out to be negative: the indirect effects of fiscal impetus on private consumption and/or investment offset the direct effects of government action. Such a surprising outcome is triggered by the changing behaviour of rational, forward-looking private agents, who expect their tax liabilities to decline in the future and/or who work under a more competitive (wage) structure in the international market (see especially Giavazzi and Pagano 1990).
Large fiscal adjustments by Definition 1
Permanent adjustments by Definition 2
Successful (permanent and expansionary)
adjustments by Definition 3
Austria 1984, 1996, 1997, 2001 – –
Belgium 1982, 1984, 1985, 1993 1993 1993
Denmark 1983, 1984, 1986, 1999,
2005 1984, 1986, 1999 1984
Finland 1981, 1984, 1988, 1993,
1998, 2000 1998 –
France 1996 – –
Germany 1989 – –
Greece 1982, 1986, 1987, 1991,
1994, 1996, 2005 – –
Ireland 1982, 1983, 1987, 1988,
1989, 2003 1987, 1988, 1989 1987, 1988
Italy 1982, 1983, 1991, 1992,
1993, 1997 1997 1997
Netherlands 1982, 1991, 1993, 1996,
2005 1993, 1996 1993, 1996
Portugal 1982, 1983, 1986, 1988,
1992, 2002 1992 –
Spain 1992 – –
Sweden 1981, 1983, 1986, 1987,
1996, 2005 1986, 1987, 1996, 2005 1996
UK 1980, 1996, 1997, 1998 1997, 1998 1997
Number of total
observations 62 18 9
Certainly, the descriptive data analysis of large fiscal adjustments and their macroeconomic consequences is not without doubts. Nevertheless, the internation- al comparative studies on the success of fiscal consolidation have one main point in common: they almost all found some evidencefor success.8 By summarising the main findings of Part 2, two major conclusions can be drawn. First, not every single fiscal consolidation results in improved public finances (that is, in a reduced debt- to-GDP ratio); in fact, a lasting debt-reduction is rather rare. Second, a fiscal contrac- tion is not always accompanied by economic decline; in fact, there are some instances when economic activity does accelerate relatively early on.
3. FIVE SUCCESSFUL EPISODES
A short data analysis can be indicative in several respects; however, country case stud- ies may contribute to a better understanding of how governments were able to imple- ment not just large but also permanent and growth-accelerating fiscal contractions – an unexpected double result that should be achieved now as the current economic crisis is coming to its end. Accordingly, five cases (out of our eight episodes) have been selected from our EU-14 sample for further study. The five case studies will be the following: Ireland (1987–89), Denmark (1983–84), Netherlands (1993 and 1996), Sweden (1996) and Great Britain (1997–98). Belgium (1993) and Italy (1997) have been left out from the further study since their initial conditions (the extremely high level of debt reaching 110–120 per cent of their GDP) can make the lessons not that straightforward. Moreover, Belgium experienced a significant drop in economic growth already in the second year after the adjustment, while Italy's adjustment efforts were strongly supplemented by creative accounting measures in 1997.
3.1 THE COMPOSITION OF ADJUSTMENT
Ireland
After the first failed fiscal consolidation of 1982–83, the newly elected right-wing cabinet initiated an ambitious adjustment programme in 1987, followed by several other supplementing economic measures. The consolidation – started in February 1987 – was based exclusively on expenditure cuts; in fact, taxes even fell slightly between 1987 and 1989 (see Table 2). Throughout these years, the total spending was decreased by 8.5 per cent of the GDP and revenues also declined by a couple of percentage points. The Irish government did not hesitate after a failed adjustment attempt in 1982 to drastically cut back the politically most sensitive items such as the wage bill of the public sector and the cuts in transfers.
More importantly, between 1988 and 1989, the Irish government reduced the number of public servants by 9 per cent, by which 30 000 people were made redun- dant. This was carried out not simply in the form of dismissals, but rather in the
8 See for instance Giudice et al. (2003).
form of early retirement and by freezing recruitments. The fiscal consolidation pro- gramme was supplemented with a wage agreement among social partners and the state in both the private and the public sector. One of the crucial elements of the wage agreement between social partners was that the claims on real wage increase could not exceed improvements in productivity. The significant lay-off proved to be politically sustainable because it involved a wide-scale tax reduction, and as a corol- lary, the private sector absorbed so many that unemployment rate even decelerated.
Additionally, the government spent a significant amount of money on re-training courses.
It is worth mentioning, however, that an increase in employment and an overall recovery of the economy probably would not have been possible without a favourable international economic environment, especially in the case of the most important trading partners of Ireland, which boosted export. Besides, the accelera- tion of capital inflow via foreign direct investment also contributed to the positive growth effects. Capital inflow was also supported by the timely liberalisation of cap- ital accounts and the devaluation of the Irish pound in 1986. In fact, the lowest cor- porate tax was introduced, which – together with low wages and the devaluated Irish pound – made Ireland attractive for foreign investors, especially in comparison to other EU countries. In sum, the restored overall competitiveness of the Irish econ- omy, along with the accommodative monetary and exchange rate policy were inte- gral parts of the economic policy package of the right-wing cabinet.
Denmark (1983–84)
The Danish started the consolidation in the first half of the eighties, following a seri- ous deterioration in fiscal performance, price stability, and economic activity.
Public debt doubled within five years (before the consolidation occurred), and fis- cal deficit got close to 10 per cent. As opposed to the other four countries, howev- er, Denmark initiated a revenue-based adjustment (Table 2), although according to other authors, it is better to say that it embarked on a mixed strategy of both expen- diture cuts and revenue increase (see especially Perotti et al. 1998).
For sure, besides revenue increase, the spending cut was unavoidable since the redistribution achieved an extremely high ratio in the country: 60 per cent of the GDP by 1980. Similarly to Ireland, transfers and compensation to employees were decreased – although at a more moderate rate. In concrete terms, the earlier prac- tice of price indexation of welfare spending was given up and maximum ceilings on some welfare cash benefits (such as sickness) were introduced. Wage-freezing, dras- tic stop on pension payments and unemployment benefits contributed to the suc- cess of the consolidation programme, too. The determination of the government can be touched upon by contrasting current spending cuts with cuts in public investment: the ratio of current expenditure cuts versus public investment was around 5. Still, the balance of overall expenditures did not improve due to the steep increase in the payment of interest. The dramatic recovery in fiscal balance (which turned into a sufficit as early as 1985) was therefore mostly due to the significant increase of direct taxes (both on business and households) and social security con-
tributions. Revenues increased by 7 per cent of the GDP between 1981 and 1988, causing a serious increase in the tax burden.
The judgement of the Danish “miracle” is not without doubts, however. On the one hand, the favourable internal and external economic conditions might have played a crucial role in the success story of the early eighties – especially the easing of monetary policy due to the strengthened credibility of macroeconomic policies.
On the other hand, in 1987, wage-freezing was abolished and employees pushed the government successfully towards a serious wage increase. The suspension of wage moderation broke the positive growth trend of the economy experienced through the years of adjustment. Significant increase in real costs of labour deteriorated com- petitiveness and economic growth slowed down from 1988 onwards. That is, Denmark did experience a successful fiscal consolidation which, however, did not prove to be long-lived.
The Netherlands (1993 and 1996)
Seemingly, the Dutch adjustment efforts coincide with the launching of the EMU plan. However, the restructuring of the Holland public finances had already started in the eighties, well before the Maastricht process. By 1997, public spending had decreased by one-third from the peak reached in 1983 (in GDP). The wide-scale reforms of the mid-eighties encompassed the following elements: mutually strength- ening measures in fiscal policy and labour incomes policy (along with labour mar- ket reform) such as tax cut and the reduction of the real value of minimum wage.
Social transfers were cut back significantly too: welfare transfers (especially sick- ness and disability benefits) were vigorously reduced and restructured. Public sec- tor salaries were cut back and the links between the wages of the public and the pri- vate sector were also severed.
Starting in 1993, the Netherlands embarked on a drastic reduction of current expenditures: the level of current expenditure declined from 50.6 per cent (1993) to 42.3 per cent (1998). Savings on final consumption and interest payments con- tributed significantly to the recovery of the general budget. Interestingly, current revenues fell enormously, too: the decrease was 4.7 points of the GDP between 1992 and 1997 (data can be found in Table 2). The government and the trade unions worked in close cooperation with each other and were able to increase the flexibil- ity of the Dutch labour market substantially, thereby the demand for labour rose, too. The improvement in competitiveness produced a robust growth compared to the neighbouring countries (Watson et al. 1999). In sum, the Dutch success story was not a one-off event, but a result of a long process that had already started in the early eighties. The ultimate aim of the reform was not simply the reduction of deficit and debt but the restoration of competitiveness of the overall economy, thereby pro- moting sustainability.
The UK (1997–98)
One of the most successful fiscal stabilisations was achieved in the UK in the nineties. Nevertheless, the British experience received attention not just because of
the significant improvement in fiscal stance but also due to the remarkably high level of real growth rate and falling rate of unemployment, stabilising at 5–6 per cent in the second half of the nineties, an outstandingly low level in comparison with other EU countries.9 As far as the fiscal position is concerned, the debt-to-GDP ratio was placed on a downward course: the average ratio between 1991 and 1995 was recorded at 51.8 per cent, while the average of 1996 and 2000 was reduced by 10 percentage points. The same ratios for the deficit were 6.0 per cent versus0.3 per cent. From 1998 onwards, the general government balance turned into a sufficit which prevailed until 2001. Meanwhile, the growth rate of the country accelerated, providing a spectacular 3.2 per cent annual average in the second half of the nineties, as opposed to 1.7 per cent in the first half of that decade. This certainly rais- es the issue of causality: it might be easily the case that the recovery in economic performance made it possible for the government to collect more revenues while spending less, thereby experiencing a recovery in the general balance.10
Turning to the composition of adjustment, Table 2in fact reveals that both the increased revenues (possibly due to the accelerated economic growth) and the reduced expenditures contributed significantly to the recovery in fiscal position.
While current expenditures exceeded current revenues by 2 percentage points (in GDP) in 1996, three years later the current revenues were well above current expen- ditures. The change in the trend can be traced back to several budget items: there was a general decrease in the level of all expenditure-types in the UK. Compensation per employees for instance witnessed a decline of 0.8 percentage points (in GDP), which means a 7.5 per cent decrease (using 1996 the base year). Reductions in pub- lic investment and interest payment contributed significantly to the recovery of the general balance, too. The success of the corrections was mainly the result of the increased credibility of policymakers and the improved transparency of the policy- making process (see in section 3.2). Moreover, the commitment of New Labour was also reflected in the fact that several public services were privatised and thereby the number of public sector workers dropped significantly. The status of public sector employees also changed, by which the government was able to reduce the staff of the education sector for instance (OECD 2001).
Sweden (1994–97)
The overheated economy of Sweden in the late eighties and early nineties found itself in an unpleasant recession, boosting government spending and dampening revenues. The relatively large size of the public sector in Sweden (two-thirds of the income was centralised) gave birth to a generous welfare state where even the auto- matic stabilisers could have a devastating effect in times of recession on the fiscal position of the general government. Accordingly, the dramatic increase in the num-
9 The IMF (1998) in fact warned the country that an overheating might have evolved in 1998 already, due to the strong performance of the economy.
10 According to the IMF (1999: 4), for instance, the strong recovery of the budget was “transient in nature, and hence not grounds to relax policies. The bulk of the gains [of the accelerated economic growth] appears to be cyclical, reflecting the greater buoyancy of the economy.”
ber of unemployed (which peaked at almost 9 per cent in the early nineties from an extremely low level of 1.8 per cent in the eighties) contributed significantly to the undermining of fiscal sustainability in the early nineties. Deficit was higher than 10 per cent for several years before the adjustment was implemented, and the debt ratio was 1.5 times higher than just half a decade before.
The drastic changes in the fiscal course of Sweden were initiated after the crisis from 1994 onwards which were, however, preceded by a strong devaluation of the Swedish koruna and the adoption of a flexible exchange rate regime later on.
Revenues were increased dramatically in 1996; while the general level of spending decreased by around 8 percentage points (in GDP) between 1993 and 1998. By decomposing expenditures, it becomes visible that mostly current spending, espe- cially the transfers to households were cut back significantly (see Table 2).
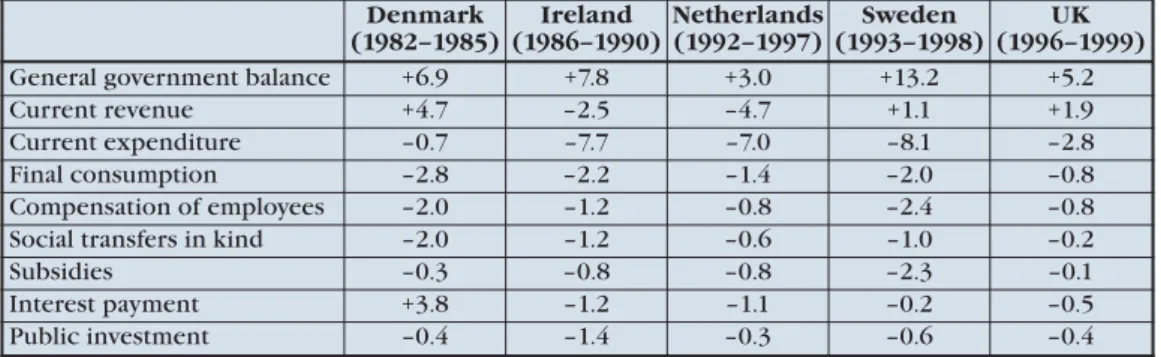
Table 2 The composition of fiscal adjustments
Source: EC (2006).
Remarks: the data cover the years of the adjustment itself, plus one year before and after the consolida- tion was initiated.
In Sweden, the government tried to implement a shift from a general, all-encompass- ing regime to an individual-based, targeting scheme by redistributing sources to those in need. Childcare and family allowances, along with housing support – polit- ically highly sensitive measures – were reduced substantially.11By restructuring the welfare state, Sweden has introduced a funded pillar in its pension system, thereby reducing the increasing burden of the ageing population. The government achieved a positive primary balance as early as 1996, putting an end to debt accumulation (in 2000 it was already below the Maastricht criterion with its value of 52.8 per cent).
Remarkably, the relatively low performance of the economy showing a 0.7 average growth rate per year between 1991 and 1995, showed a steady increase by climbing to 1.3 per cent in 1996, 2.4 in 1997, 3.6 in 1998, and peaking at 4.6 in 1999. In sum, after the crisis years, due to a quick and credible policy and regime change, the Swedish economy bounced back relatively quickly, and its economic performance –
11 The IMF (2003) also added that the decline in current transfers also reflected the privatisation efforts and the reform of the pension system.
Denmark (1982–1985)
Ireland (1986–1990)
Netherlands (1992–1997)
Sweden (1993–1998)
UK (1996–1999)
General government balance +6.9 +7.8 +3.0 +13.2 +5.2
Current revenue +4.7 –2.5 –4.7 +1.1 +1.9
Current expenditure –0.7 –7.7 –7.0 –8.1 –2.8
Final consumption –2.8 –2.2 –1.4 –2.0 –0.8
Compensation of employees –2.0 –1.2 –0.8 –2.4 –0.8
Social transfers in kind –2.0 –1.2 –0.6 –1.0 –0.2
Subsidies –0.3 –0.8 –0.8 –2.3 –0.1
Interest payment +3.8 –1.2 –1.1 –0.2 –0.5
Public investment –0.4 –1.4 –0.3 –0.6 –0.4
regarding growth – can be compared only to the golden ages of the sixties, the hey- days of the welfare state.
The case studies nicely illustrated that the composition of fiscal consolidation can have a significant effect on determining whether an adjustment proves to be successful. The short case studies underpinned the idea that expenditure-based fis- cal stabilisations have a significantly higher chance of ending up in reduced-cost adjustment than revenue-based adjustments. It has been also revealed that basically two budget elements need to be cut back if the government aims at reducing the debt stock and also producing growth effects relatively early on: (1) compensation of public sector employees and (2) household transfers. Nevertheless, these items are considered to be the politically most sensitive items of the budget, the constitu- tive elements of any welfare state. Therefore, the cutback of these politically sensi- tive items may call for political decisiveness which in turn can be backed up by changed institutional conditions, especially a centralised budgeting process and/or a restructuring of the labour market.
3.2 THE PROCESS OF PUBLIC BUDGETING
According to the findings of the political economy literature on deficit bias, the decentralized nature of public budgeting, the lack of a firm-handed finance or prime minister, the lack of a coalition agreement, and the absence of transparency result in a deficit bias which makes it impossible to achieve a close to balanced position of the budget. Reforming the budget process, strengthening transparency and introducing binding fiscal rules (such as the Maastricht fiscal criteria for instance) can induce therefore significant recovery in the budget balance.12Any change in the institution- al design of the budgetary process (and/or the adoption of numerical fiscal policy rules) induces automatically a change in political motives. The inefficient allocation of resources can be reduced significantly by the appropriate design of fiscal institu- tions, which might not be a first best solution for providing socially optimal resource allocation, but still works as a second best scenario. Accordingly, Hagen (1992:54–55) argues: “[o]ur results suggest that institutional reform of the budgeting process is a promising avenue to achieve a large degree of fiscal discipline.”
Among others, Hauptmeier et al. (2006) in their empirical study argue that expenditure reduction is always embedded in a more comprehensive reform pack- age inclusive of the reform of fiscal institutionsand structural measures. “Virtually all episodes of ambitious reform feature a significant strengthening of national and sub-national budgetary procedures and institutions… one could indeed talk about a major change in the policy regime” (ibid. 9). Fiscal adjustment is therefore initiated with the ultimate aim of achieving long-term macroeconomic stability. The authors' claim can be supported by the experience of several European countries, inclusive of the five states that have been selected for a deeper scrutiny in this study. Besides the widely known fiscal convergence criteria of Maastricht, several EU member
12 See especially the monographs of Drazen (2000) and Persson and Tabellini (2000).
states introduced so-called expenditure rulesin the nineties. Instead of deficit and debt criteria covering public finances as a whole (such as the Maastricht reference values), these expenditure rules (limits) corresponded to different chapters of the budget, which made them more transparent and reflected personal responsibilities.
Generally speaking, the advantage of an expenditure rule is that it guarantees the internalisation of the full costs of public spending, i.e. the rule ensures that policy- makers take explicitly into account the budget constraint of the government.
Expenditure rules are usually embedded into a medium-term fiscal framework.
The medium-term plan is not simply informative but can be adopted as a law by the national legislation. The essence of medium-term fiscal framework is that the gov- ernment sends out a clear signal to the market about its commitmenton fiscal con- solidation, proving that fiscal adjustment is not a one-off measure but part of a coherent long-term economic programme. The framework main contain major eco- nomic policy objectives, the assumed macro-economic environment and develop- ment path, the programming time span, a list of expenditure items, a definition of exceptional and transitional conditions, the standard exemptions from expenditure limits – especially cyclically sensitive factors, such as unemployment benefit and reserve funds. Such a framework has been adopted earlier in Australia, Canada or New Zealand. Among the EU member states, it was Finland, Sweden, the Netherlands, Denmark and the UK (countries under scrutiny of this paper), and later on Germany and Spain that introduced national medium-term fiscal planning programmes in order to achieve a successful fiscal consolidation.13
One of the most well-known system of expenditure rules has been adopted in Sweden, where starting in 1996, the Act on Public Finances introduced 27 nominal expenditure caps for all of the lines of the central budget and the social security sys- tem. The aim has been to achieve a 2 per cent surplus in the cyclically adjusted total balance. The country initiated even constitutional amendments in order to cement the reform steps. The finance minister's position in the cabinet was substantially strengthened and also the strength of the minority government vis-a`-vis the opposi- tion forces was increased significantly, thereby making it possible for the incum- bents to scale down the politically motivated overspending activity dramatically.
Similar to Sweden, but almost ten years earlier, the Irishright-wing government also secured the position of the finance minister. As a corollary, the government made the claims of spending ministries redundant and guaranteed a tough expendi- ture-based consolidation. In fact, the whole reform process was executed by the Irish Finance Ministry, which enjoyed the full-hearted support of the prime minis- ter. Interestingly enough, the seemingly over-centralised power of the executive body did not trigger severe attacks from the side of the opposition in the parliament or the wider public, that is, a strong consensus supported the reform programmes.14
13 Although Finland is not among the selected cases, because it did not fulfil the second requirement of success, it is worth noting that Finland was able to achieve a dramatic drop in its debt ratio and also the economic performance accelerated substantially some years later following the fiscal contraction of 1998.
14 See especially Hallerberg (2004).
As far as the Dutchreform attempts are concerned, they first adopted a medium- term fiscal framework from 1994 onwards and after that a binding coalition agree- ment in 1998.15The aim was the same in both cases: to reduce public spending in the sphere of the central government and the social security system. The expendi- ture limits were expressed in real terms and also rainy day funds were created in order to finance temporary overspendings. One of the most important aspects of the Dutch medium-term planning was that the decisions on spending and revenues were clearly distinguished from each other.
Nevertheless, it was probably the UKwhich developed the most sophisticated system of medium-term planning. The British have adopted a programme, the ele- ments of which have to correspond to five main points: specificity, measurable, adoptability, relevance and timing, or to use the English abbreviation, SMART. Both spending ministries and budget offices have to renew their fiscal framework pro- grammes every two years, in which they must report on the use of discretionary spending that has to be in line with the so-called departmental expenditure limits (no overspending is tolerated). These data are made available for the wider public as well in a document called “public service agreements”. In accordance with the programme-budgeting, the planners do not focus on the inputs (financial sources), but the measurable and controllable outputs (services). Another interesting aspect of the British planning system was that a 4 to 6 per cent of particular expenditures were allocated to a reserve fund which was used up only in extraordinary times.
Similarly to Sweden and Ireland, the UK also transposed substantial political power on the Chancellor, who was backed by the prime minister.
Certainly, the crisis of 2008 and 2009 significantly changed the previously estab- lished fiscal regimes in each of the analysed countries. Even the most developed British fiscal framework was suspended in 2008. The UK was not able to meet its national fiscal rules established in 1997. Nevertheless, countries have started to negotiate on the main aspects of a future fiscal framework in order to create a cred- ible exit strategy that puts back public finances on the track of sustainability.
4. CONCLUSION
The ultimate aim of this paper was to provide some lessons about how successful fis- cal consolidation can be achieved. As a first step a short statistical analysis made it overt that not every single fiscal consolidation results in improved public finances;
in fact, a lasting debt-reduction is rather rare. More surprisingly, however, a fiscal contraction is not always accompanied by economic decline. It has been shown that there were some instances when economic activity did accelerate relatively early on in EU countries between 1980 and 2005.
15 In their comparative studies, Perotti et al. (1998) and Hallerberg and Hagen (1999) recommended binding coalition agreements for continental Europe to reduce deficit bias. Such an agreement contains formal objectives and rules - in the form of numerical targets for instance - which can guarantee fiscal discipline in the long run. The contract approach proves to be superior to the delegation one (where the position of finance minister is strengthened vis-a-vis the other ministries) in the case of coalition governments.
Relying on the “successful” episodes of five countries, it was also shown that the consolidations were initiated almost exclusively on the expenditure side. Ireland provided one of the most remarkable fiscal adjustments in the second half of the 1980s. Both the deficit and the debt ratios dropped substantially, while economic activity accelerated to staggering levels. In Great Britain, expenditure cuts played a central role also in the adjustment process. In addition to transfers, the freezing and reduction of government wages proved to be useful in stabilising fiscal position, thereby providing a ground for economic growth even in the short run.16 The Netherlands benefited from the Maastricht process of the nineties, which triggered two adjustment waves in the country. Nevertheless, some corrections had been already initiated in the eighties. The crisis-hit Sweden implemented a drastic consol- idation between 1994 and 1997: it cut back primarily the transfers to households, that is, it was ready to reform the Nordic welfare state. Denmark is not a trivial case, however, in the sense that both revenue increase and spending cuts contributed to the short-lived economic recovery during the mid-eighties. Unfortunately for Denmark, a reversal evolved in its fiscal profile as early as 1987, resulting in a dete- riorated fiscal balance.
By studying the experiences of EU countries, it has been concluded that the suc- cess of a fiscal consolidation is very much dependant on the budgetary decision-mak- ing process, its transparency and the power structure within the cabinet. Therefore, it seems to be reasonable to recognise that if the excessive deficit is the result of con- tinuous collisions of interests within the government (or parliament) and/or of insuf- ficient coordination, then the solution is in the discontinuation of political fragmen- tation and the strengthening of centralisation. Accordingly, besides the composition of adjustment, the redesign of the budgetary process can substantially increase the chance of success. The centralisation of political power, the adoption of a binding coalition agreement possibly supplemented by a medium-term fiscal framework and the strengthening of the position of the finance minister can make it more likely for a consolidation to deliver permanent and growth-supporting results.
16 Nevertheless, both Ireland and the UK failed to maintain fiscal discipline in the last couple of years.
Ireland quadrupled its debt ratio, while the UK doubled it in just five years by 2010. That is, even the most successful countries fail to meet fiscal discipline on every occasion. Certainly, the current crisis hit both countries severely, but the magnitude of indebtedness has also revealed serious structural deficiencies in their respective economies.
REFERENCES
Alesina, Alberto and Roberto Perotti (1995): “Fiscal expansions and adjustment in OECD countries” Economic Policy, 10(21): 207–248.
Alesina, Alberto and Silvia Ardagna (1998): “Tales of fiscal adjustments. Why they can be expansionary?” Economic Policy, 13(27): 489–545.
Benczes, István (2008): Trimming the sails. The comparative political economy of expansionary fiscal consolidations. CEU Press, New York-Budapest.
Boltho, Andrea (2000): “What matters for economic success? Greece and Ireland compared” In. Bara Z. and Csaba L.: Small economies' adjustment to global ten- dencies. Aula, Budapest, pp. 151–170.
Davis, Steven J. and Magnus Henrekson (2006): “Economic performance and work activity in Sweden after the crisis of the early 1990s” SSE/EFI Working Paper Series in Economics and Financeno. 467.
Drazen, Allen (2000): Political economy in macroeconomics. Princeton University Press, Princeton, N. J., p. 775.
Ebbinghaus, Bernhard (2004): “The changing union and bargaining landscape:
union concentration and collective bargaining trends”, Industrial Relations Journal, 35(6): 574–587.
European Commission (1999): European Economy, Statistical Annex, Spring, Brussels.
European Commission (2006): European Economy, Statistical Annex, Spring, Brussels.
European Commission (2009): European Economy, Statistical Annex, Spring, Brussels.
Giavazzi, Francesco and Marco Pagano (1990): “Can severe fiscal contractions be expansionary? Tales of two small European countries”. In: Blanchard, O. and Fischer, S (eds.): NBER Macroeconomics Annual, MIT Press, Cambridge, MA.
Giudice, Gabriele, Alessandro Turrini and Jan in't Weld (2003): “Can fiscal consoli- dations be expansionary in the EU? Ex-post evidence and ex-ante analysis.”
European Economy, European Commission, no. 195.
Hagen, Jürgen von (1992): “Budgeting procedures and fiscal performance in the European Communities” Economic Paper, Brussels, no. 96.
Hagen, Jürgen von, Andrew Hughes Hallett and Rolf Strauch (2001): “Budgetary con- solidation in EMU” Economic Papers, European Commission, no. 148.
Hallerberg, Mark (2004): Domestic budgets in a united Europe. Fiscal governance from the end of Bretton Woods to EMU. Cornell University Press, New York.
Hallerberg, Michael and Jürgen von Hagen (1999): “Electoral institutions, cabinet negotiations and budget deficits in the European Union” In: Poterba, J. and J.
von Hagen: Fiscal institutions and fiscal performance. The University of Chicago Press.
Hauptmeier, Sebastian, Martin Heipertz and Ludger Schuknecht (2006):
“Expenditure reform in industrialised countries” ECB Working Paper Series no.
634.
IMF (2003): “Hungary: selected issues” Country Reportno. 03/125
IMF (1999): United Kingdom, 1999 Article IV Consultation. 24 November 1999.
IMF (1998): United Kingdom, 1998 Article IV Consultation. 21 December 1998.
Kiss P., Gábor and Gábor Vadas (2005): “Mind the gap. International comparison of cyclical adjustment of the budget” Hungarian National Bank Working Paper no 4, p.29.
OECD (2009): Economic Outlook, no. 78, Paris
Perotti, Robert, Strauch, R. and Hagen, von Jürgen (1998): Sustainability of public finances.ZEI.
Persson, Torsten és Guido Tabellini (2000): Political Economics. MIT Press, Cambridge, Massachusetts.