Magdolna Csath1 – Csaba Fási2 – Balázs Nagy3 – Nóra Pálfi4 – Balázs Taksás5 – Sergey Vinogradov6
The role of knowledge and value intangibles in the age of great changes:
the case of Hungary in international comparison
Th e future belongs to those who are clever and brave enough to make the right decisions today and also act upon them now. Th e reason is that all actions have time lags, with other words it takes a considerable time before we can see the results of our today’s decisions. So the future is actually being made today, even if we are not aware of it. Th is paper assesses how well Hungary is prepared to face the challenges of the rapid technological changes of our age. Values of key indicators measuring preparedness are contrasted with those of the three other V4 countries (Visegrad countries) and three developed countries in the EU.
Special emphasis is put on the knowledge and value intangibles, among them ethics, social responsibility and social cohesion, which are getting to be the key drivers of competitiveness success.
Governance quality can be measured – among others - by presenting examples of how much focus is put on developing knowledge intangibles. One approach to illustrate this is to compare the size of state investment into these factors of competitiveness.
Links are also analyzed among diff erent indicators in order to show where governments can do much better for improving the quality of intangible factors of competitiveness.
Th e paper concludes by a warning: Hungary and the other three V4 countries are not in real good shape in the fi elds of human and knowledge capabilities and skills necessary for being fi t to handle the ongoing disruptive changes throughout their economies and societies. Yet they do not seem to be properly prepared to upgrade those skills rapidly enough either, as they do not invest enough into upskilling their human resources. Th erefore governance quality improvement is necessary in order to avoid to be left out of the new wave of modernization. All the data used come from the Eurostat (Statistical Offi ce of the EU) and the Hungarian Statistical Offi ce sources except value intangible indicators which are collected from the Institute for Management Development (IMD) World Competitiveness Yearbook 2014, 2018.
1 Doctor of the Hungarian Academy of Sciences (DSc), Professor, National University of Public Service (Hungary)
2 PhD student, National University of Public Service (Hungary) 3 PhD student, University of Sopron
4 PhD student, Szent István University
5 senior lecturer, PhD, National University of Public Service (Hungary) 6 associate professor, PhD, Szent István University
1. Introduction
Th e fourth industrial revolution is just around the corner. Robots will take the jobs of humans, especially those so-called low-skilled, easily automatable routine jobs performed in assembly line operations. On the other hand, as it was always usual in the history of industrial revolutions new, more sophisticated jobs will also be created, which will change economic structure, and promote inventing new products and services. In order to remain competitive countries have to embrace change, capitalize on the emerging opportunities and avoid threats by being prepared to cope with uncertainties. Th e key resources facilitating a successful change process are human skills and talents, and sophisticated, forward looking government policies, which guarantee educational upgrading, skill adjustment, and multidimensional skills creation throughout the society. Value intangibles, among them ethical values, social responsibility and cohesion are also crucial elements of building competitive economies and societies.
Th ose nations which fail to develop and invest into intangibles will be sidelined by the more strategically oriented and more sophisticated competitors. Investments into machines and technologies will remain important, but need to be surpassed by investments into the so-called knowledge and value intangibles aiming at developing human resources. A working paper7 by the OECD fi nds that the share of automatable jobs in diff erent countries will depend not only on the diff erences in previous investments into automation technologies, but also on the level of education of workers. Th is means that it is mostly the low skilled people who face a high risk of being automatable. A recent IMF report8 draws the attention to the fact that the economies of the newer member states are highly integrated into the European supply chains through foreign direct investments by businesses from the advanced European countries. Th is means that external conditions and market shocks are easily transmitted to the domestic economies of the Eastern European countries. In line with the tight global value chain integration about 85 percent of inward foreign direct investment to Eastern Europe is from within the EU. In 2016 Hungary had the highest stock of inward FDI in percentage of the GDP, followed by the Czech Republic. Th e greatest diffi culty of being integrated into these, mostly German global value chains is the low knowledge, and value-added content of the local operations, as typically the lowest value-added stage, the assembly-line operation is located into the less developed Eastern countries of the EU. Th ese are typically those routinized jobs which will the automated fi rst. As another OECD report9 points out the highest risk of job automation will happen in Eastern European countries due to the large proportion of low skilled manufacturing jobs along the assembly lines. Th e report forecasts that Slovak and Hungarian jobs will be at the highest risk of automation, as the
7 Th e Risk of Automation for Jobs in OECD Countries. A Comparative Analysis. OECD. Social, Employment and Migration Working Papers No.189.OECD Publishing, Paris.(http:dx.doi.org/10.1787/5jlz9h56dvq7-en) 8 Managing the Upswing in Uncertain Times. World Economic and Financial Surveys. Regional Economic Outlook. Europe. May 2018. IMF (www.imf.org/en/Publications/REO/EU/Issues/2018/05/14/
EURREO1518?cid=em-com-123-37064
9 Nedelkoska, L. and G. Quintini (2018), „Automation, skills use and training”, OECD Social, Employment and Migration Working Papers, No.202, OECD Publishing, Paris.( http://dx.doi.org/10.1787/2e2f4eea-en)
share of screwdriver operations of foreign manufacturing affi liates is the most signifi cant in these countries. Putting this into a diff erent perspective value chains are too short in Eastern Europe.
Figure 1. Value chains in industry and services (%, 2016)
Th is is demonstrated on Figure 1. Th e numbers illustrate the length of industry and services value chains expressed by the locally created new value as a percentage of the produced total value. In accordance with these data – in perfect harmony with the OECD report – the shortest value chains in the industry can be found in Hungary and Slovakia. In the following points we will examine how well prepared the so-called V4 countries – Czech Republic, Poland, Hungary and Slovakia – are for taking advantage of the on-going disruptive economic and technological changes. We will use – as benchmark – three countries: Austria, Germany and Denmark. Th e reason in the case of Austria and Germany is that these countries are the largest investors in the region. Denmark, on the other hand is used for comparison as it has one of the most knowledge- based competitive economy in the EU.
We will also focus on analyzing the preparedness level of the governments in the V4 countries to see how deliberately they invest in human resources in order to make the population capable of riding the waves of change. We have to note that the V4 countries are the most developed in Eastern Europe.
2. How to measure intangibles?
Haskel and Westlake10 argue that why investment in general is central to the functioning of any economy, the nature of it has been gradually changing. Th e types of investment important for success are more and more the intangibles, that is investment into ideas, knowledge, values, network and relationships. Th e European Investment Bank11 also emphasizes the
10 Haskel, J., Westlake S. (2018): Capitalism without Capital. Th e Rise of the Intangible Economy. Princeton University Press. Princeton&Oxford.
11 From recovery to sustainable growth. Investment report 2017/2018. Editors: Haynes P., Morrison N.
importance of investment into intangibles. It concludes by saying: enhancing the productivity and competitiveness of the EU economy requires attention to be paid to innovation, including investment in intangibles, particularly skills, R&D, but policy should also target all types of intangibles. (Executive summary, page 2.)
Th e report also presents the proportion of investment in the diff erent areas in the EU in 2016 measured as % of total investment. Th e share of investment in intangibles is the lowest, less than 24% in Hungary, and more than 40% in Ireland. R&D, training of employees, investment in soft ware, date, IT networks, website activities, organization and business process improvement are considered as intangible investments. Th is is serious warning sign in the case of Hungary.
In this paper we understand intangibles in a more complex way. We cover all those factors as intangibles which are especially crucial for modernizing economies in the V4 countries, like knowledge and skills levels of human resources along with the levels of government investments into the most important knowledge fi elds. We also compare the position of the analyzed countries on the list of IMD for ethical practices, social responsibility and social cohesion, and contrast it with the general competitiveness positions of these countries. Finally we look at structural weaknesses expressed by the percentage of the innovative enterprises and competitiveness positions. In conclusion indicator interrelationships are presented, and recommendations are formulated. Th e following indicators and their connections are surveyed and analyzed:
• population by educational attainment levels
• number of people with doctoral level in sciences per 100 of population
• graduates in sciences per 1000 of population
• employment in knowledge intensive activities
• percentage of innovative enterprises
• R&D expenditure as % of GDP, and the breakdown of it among the diff erent sectors
• R&D expenditure per inhabitant and by sectors
• government expenditure on tertiary education as a share of total expenditure on education
• adult participation (life-long learning) as a percentage of population (aged 25-64)
3. Knowledge skills and knowledge intangibles in the V4 countries
Modern economies require a population with a well-balanced educational attainment level.
Also within the knowledge structure the proportion of those with higher educational level should increase. On the other hand graduates and PhD holders in sciences are in increasingly high demand in countries which want to be active players in the fourth industrial revolution.
Figure 2 shows the proportions of three diff erent educational levels in the 15-74 age population.
Th e European Investment Bank. www.eib.org/attachments/efs/economic_investment_report_2017_en.pdf
Figure 2. Population by educational attainment level (2017, 15-74 years, %)
Within the V4 countries the Czech Republic has the lowest proportion of population with low level (elementary or less) education, which is at the same time the lowest level of all countries analyzed. It is even less than the EU average. Hungary has the worst data, 22,1% within the V4 countries. Poland has the highest proportion of population with high level (tertiary) education.
Th e high percentage of population with medium level education in the V4 countries is probably a refl ection of the dominating assembly line operations which do not require higher education knowledge, but cannot employ people with low level education. Th e low proportion of population with high level education at the same time may indicate that there are not enough jobs off ered to people with higher level education.
As far as the V4 countries educational profi le is concerned the low proportion can be a serious disadvantage in the context of moving towards a more knowledge – based, digital economy, especially because there is a gap between the V4 and the developed countries at present. Of course the gap can be closed with deliberate educational strategy. We will see later, how much the V4 countries spend on education in order to catch up with the more developed countries.
As mentioned before technological change will demolish a large proportion of job, will alter the character of further jobs and will also create new jobs. In this process demand will grow for people with technological and scientifi c background.
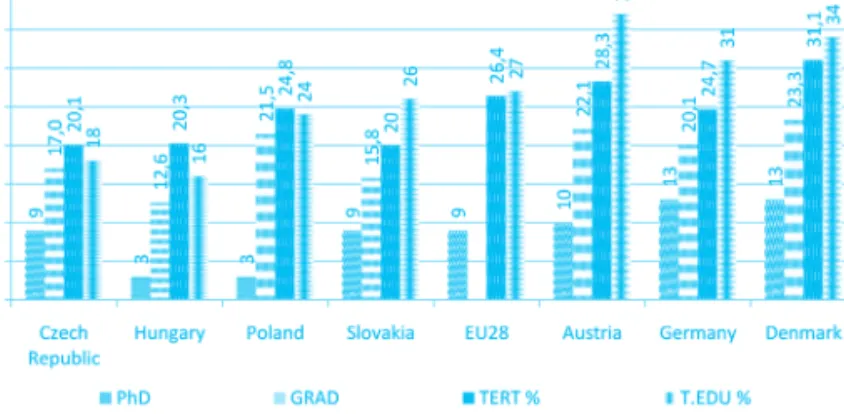
Th erefore it is important for a country to have enough graduates and also people with doctoral degree in science, mathematics, computing and engineering. On Figure 3 the fi rst column represents the number of people with doctoral level in sciences per 100 of population aged 20-29 in 2016 in the selected countries (PhD).
Th e second column shows the number of people graduated from these fi elds per 1000 of population aged 20-29 in 2016 (GRAD).
Th e third column demonstrates the percentage of population having any type of tertiary level education. (Age group 15-74, in 2017) (TERT %) Th e third column is equal with the third column on Figure 2.
Th e fourth column is an input indicator which highlights the emphasis governments put on higher education. Th e numbers show the percentage spent on tertiary education out of the total government expenditure spent on education as a percentage of GDP. (T.EDU %)
Figure 3. Knowledge indicators
1. PhD: Th e number of doctoral degree holders in sciences per 100 of population (20-29 ages, 2016)
2. GRAD: Th e number of graduates in sciences per 1000 of population (20-29 ages, 2016) 3. TERT %: Population having tertiary level education (15-74 ages, 2017, %)
4. T.EDU %: Percentage spent on tertiary education out of the total government expenditure on education as a percentage of GDP.
What are the numbers suggesting? For all the four data set V4 countries are far behind the three developed countries and the EU28 average. Within the V4 countries the Hungarian data are consistently the worst. If we accept that these indicators are important for describing levels of human capacity needed for facing new challenges of the fourth industrial revolution then V4 countries, and especially Hungary are in great trouble.
Of course proper investment into knowledge intangibles could help. We will see the level of these investments later. However the very low percentage spent on tertiary education out of the total is already a dangerous phenomenon. Especially when one also considers the serious diff erences in the amount of GDP produced in the developed and less developed countries. For example Hungary spent on education 4.9% of the GDP in 2016. Austria also spent 4.9%, but because the GDP of Austria is three time higher than that of Hungary therefore the 4.9% spent on education is also three times higher (measured in euro, at current prices). So if we consider that Austria spends 2.3 time more on tertiary education as a percentage of the total expenditure on education (37%, and 16%) out of a three times higher GDP, then altogether Austria spends about 7% more on tertiary education. How can then Hungary catch up with Austria in the fi eld of highly skilled human resources? How can companies in Hungary create knowledge intensive jobs without enough skilled people to fi ll them? How can the country then step onto a knowledge based development path which would help improve competitiveness? We get some answers to these questions if we examine the following three fi gures.
Figure 4. Employment in knowledge intensive activities in businesses as a percentage of total employment (2017, %)
Employment in knowledge intensive activities is in relation to the number of jobs available in the knowledge intensive fi elds. But are companies motivated to create knowledge intensive jobs?
Th ere are many reasons for them to make such a decision. One is obviously the availability of skilled labor force. As we have already proved however highly skilled human resources are not abundantly available in the V4 countries, especially not in Hungary. Th is is probably refl ected in the low level of employment in knowledge intensive activities in the V4 countries compared to that in the more developed countries. Also - as mentioned earlier - short value chains concentrating basically on low-skilled assembly line operations in the V4 countries may explain the lower percentage of knowledge intensive operations. Th is is reinforced by the percentage of innovative enterprises depicted on Figure 5.
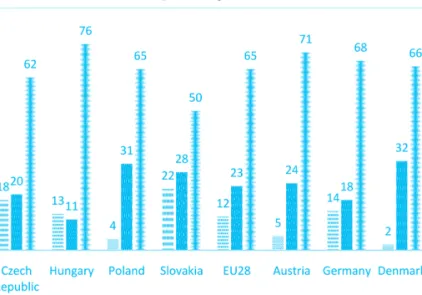
Figure 5. Percentage of innovative enterprises (2014)
Th e graphs illustrate 3 types of innovation: product, process and organizational. Th e total number is not equal with the sum of the 3 types of innovation, as some other types of innovation – like marketing – are not measured. Looking at Figure 5 the diff erences between the V4 and the advanced countries are striking. All types of innovation are much more typical for the enterprises of the more developed countries. Also the balance among the diff erent types of innovation is more harmonious. Poland and Hungary are doing especially poorly in process and organizational innovation which may be related to the low level of investment in the knowledge intangibles and to problems of value intangibles analyzed later. It is also worth comparing the percentage of innovative enterprises to the competitiveness ranking of the examined countries.
We use the latest 2018 competitive ranking of IMD 12 to search for correlation. Th e lower the ranking the more competitive the country is. On Figure 6 we use the percentage of the total number of innovative enterprises from among all the enterprises.
Figure 6 Relationship of the percentage of innovative enterprises and competitiveness ranking.
Th e third number in brackets, next to the country names shows the total R&D expenditure as a percentage of GDP in 2016. Figure 6 highlights two clusters: one of the developed Western countries, where the high percentage of innovative enterprises and high proportion of R&D spending correlate with leading competitiveness positions on the IMD list. Th e other extreme cluster is that of the three V4 countries, Poland, Hungary and Slovakia. Finally in between we see the Czech Republic with slightly better indicators than the other three V4 countries, but quite far from the excellent positions of the three developed countries. Th e positions prove that those countries having a greater proportion of innovative enterprises and spending more on R&D are more competitive. One conclusion can be that it makes sense to spend more on R&D, the other that governments should encourage businesses with innovative rather than assembly line operations to invest. One method of encouragement is government investment into knowledge intangibles, as well as innovation and competitiveness-friendly value intangibles.
12 IMD: Institute for Management Development, a prestigious business school located in Lausanne, Switzerland.
It has published competitive rankings every year since 1989. Th e latest report analyzes 63 countries.
4. Investment into human resources: how are V4 government doing?
So far we have analyzed key indicators characterizing knowledge and skills levels in diff erent countries. Let us turn now to the strategies governments are following in order to develop human resources. To highlight the typical patterns we have selected a few important indicators.
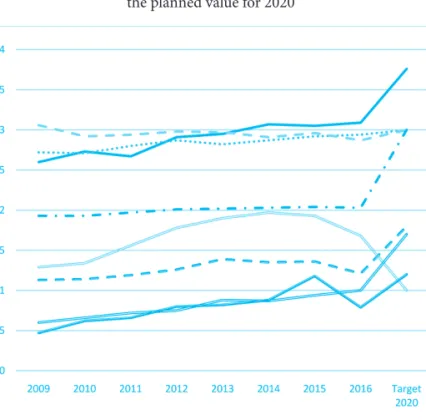
On Figure 7 we can observe time series of gross domestic R&D expenditure as a percentage of GDP for the 7 selected countries and also for the EU as an entity. Th e last data is the so-called EU2020 target member countries have planned to achieve by 2020. Figure 7 shows low level of spending and even a very low target level for R&D as a percentage of GDP. In the case of the Czech Republic we can suppose that the reason for the very low level (1%) target for 2020 is just a problem of reporting. Th e country probably had not fi nished planning this number by the time statistical reporting for the Eurostat (Th e Statistical Offi ce of the EU) was due.
Considering the present level of the knowledge and skills in the V4 countries we should raise the question: how will the V4 countries ever catch up with the most developed countries, or at least with the EU average if they spend so little on knowledge creation? And the question is especially relevant in the case of Hungary.
Figure 7. Gross domestic expenditure on R&D as % of GDP in selected countries and the planned value for 2020
Will the V4 countries have any chance to create knowledge or will they just be compelled to buy knowledge from those countries who spend more on creating new knowledge? Of course it is also important to examine how the total R&D expenditure is divided among the diff erent economic sectors. Th ere is a general argument in the EU that business expenditure has to dominate. However this argument cannot be accepted in the age of great technological changes.
As Mazzucato 13 points out government and higher education have to be also responsible for innovation especially in the times of great changes. On the other hand as the Triple Helix concept by Etzkowitz 14 proves successful innovations require a close cooperation among government, university and business.
On Figure 8 we see a very diverse pattern. It looks like strategies are very diff erent in the diff erent countries.
Figure 8. R&D expenditure in the diff erent sectors as percentage of the total R&D expenditure measured as a percentage of GDP (%, 2016).
Within the V4 countries and also in the entire sample Hungary has the largest proportion of R&D expenditure in the business sector and the lowest in higher education. Of course the large business participation is only a statistical consequence of the lower higher education proportion which will be verifi ed on Figure 9. In the case of the other countries we can observe a more balanced distribution with the exception of Denmark and Poland. In these two countries higher education has a strong role to play. On the other hand participation by government in fi nancing R&D seems to be less emphasized. As mentioned before however the size of GDP in the case of diff erent countries determines how much countries really spend on education or R&D. Th erefore it is helpful to analyze the R&D expenditure per inhabitant indicator, too.
13 Mazzucato, M. (2015): Th e Entrepreneurial State. Anthem Press.
14 Etzkowitz H. (2008): Th e Triple Helix. Routledge, Abingdon
Figure 9. R&D expenditure per inhabitant by sectors. (Euro, 2016)
Looking at these numbers one can immediately realize how bad the situation is in the V4 countries. It is striking to see that the business sector expenditures are also far lower here than in the developed countries. Within the V4 countries the Czech Republic spends the most on R&D in every sector. Austria spends 9 times and Germany 8 times more than Hungary.
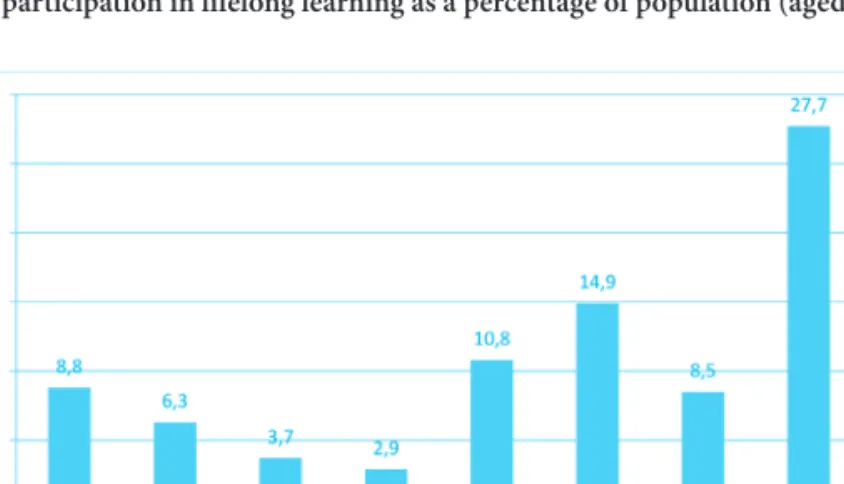
Again the lowest amount spend on higher education – 16 euro per inhabitant – can be found in Hungary. Without spending appropriate amount of money on R&D countries cannot really develop a knowledge and innovation oriented economy off ering good quality and well paid jobs to the population. Finally another important indicator showing how much emphasis is put on reskilling people, upgrading their knowledge is the adult participation in lifelong learning as a percentage of population. Th is is presented on Figure 10.
Figure 10. Adult participation in lifelong learning as a percentage of population (aged 25-64, 2016, %)
What strikes us immediately is the very low level in the V4 countries compared to Austria and Denmark. Surprisingly the German data is also quite low, but there is a logical explanation for it. As the British “Th e Economist” journal reported on Oct. 2nd 2015, 25 years aft er unifi cation there still was – and probably still is – a great East-West divide in Germany. GDP per person, life satisfaction, household assets and employment rates are all considerably lower in the Eastern part of Germany. Th is may cause a lower level participation in lifelong learning in the East which consequently deteriorates the country-wide, overall value. Otherwise the rest of Western Europe performs very well. Th e highest participation rates can be found in Sweden (30.4 %) and Switzerland (34.4%) which is not an EU member country.
As lifelong learning is becoming an economic imperative for benefi ting from the opportunities off ered by technological changes, the V4 countries may just miss taking advantage of those due to their human talent defi ciencies.
5. Value intangibles
It is not easy to defi ne what should we mean by value intangibles. Th e term itself it not well known, and well researched yet. Th e authors of this paper have put the value intangibles into the context a competitiveness, and have used the IMD World Competitiveness Report from year 2014 and 2018 to fi nd relationships among changes in value intangibles and competitiveness positions. Th e value intangibles which may be the most relevant for competitiveness are ethical values, social responsibility and social cohesion.
Th ese three social characteristics support work motivation and fair competition which are important factors creating competitiveness.
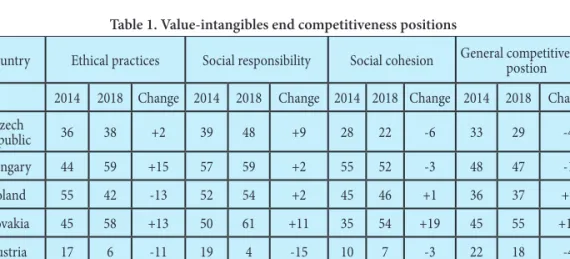
Table 1 shows value-intangibles and competitiveness positions in 2014 and 2018 for the analyzed 7 countries. It is important to note, that lower numbers indicate better positions.
Th erefore positive numbers in the change column demonstrate deteriorating, and negative numbers show improving positions. Furthermore it is worth mentioning that in year 2014 only 60, but in year 2018 already 63 countries were examined by IMD.
Table 1. Value-intangibles end competitiveness positions
Country Ethical practices Social responsibility Social cohesion General competitiveness postion 2014 2018 Change 2014 2018 Change 2014 2018 Change 2014 2018 Change Czech
Republic 36 38 +2 39 48 +9 28 22 -6 33 29 -4
Hungary 44 59 +15 57 59 +2 55 52 -3 48 47 -1
Poland 55 42 -13 52 54 +2 45 46 +1 36 37 +1
Slovakia 45 58 +13 50 61 +11 35 54 +19 45 55 +10
Austria 17 6 -11 19 4 -15 10 7 -3 22 18 -4
Germany 4 9 +5 8 20 +12 12 27 +15 6 15 +9
Denmark 3 2 -1 1 1 0 5 2 -3 9 6 -3
Th e positions on Table 1 show interesting correlations among the three value intangibles and general competitiveness. Th e V4 countries, and among them especially Hungary have very weak positions for the three analyzed intangibles. Th ey also lag behind in the competitiveness lists. It also deserves attention how positions have changed since 2014. For all the three value intangibles the position of both Slovakia and Germany has deteriorated, and their competitiveness position has also weakened. Denmark has kept excellent position for all the value intangibles, and has also moved ahead by three positions on the competitiveness list. As far as the V4 countries are concerned they show mixed results. Th e Czech Republic demonstrates the best positions in general. In terms of ethical practices the Hungarian position has deteriorated the most, followed by Slovakia. Although these relationships require further investigation and more convincing analysis they still suggest that value intangibles cannot be neglected when methods for improving competitiveness are searched for. Of course they have to be considered together with the earlier examined knowledge intangibles. If we do this however then an even more worrying competitiveness situation is taking shape for the V4 countries, among them for Hungary.
6. Summary and conclusions
Th is article has overviewed the human resources, knowledge and value intangibles capacity of the V4 countries measured against three developed countries.
Th e conclusions drawn suggest that these countries are not in the best position to benefi t from the ongoing technological changes. On the top of it their governments do not invest enough into improving the knowledge and skills of the population.
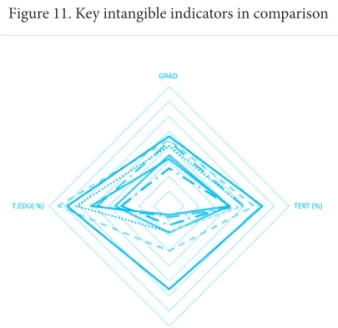
Th e general situation is summarized on Figure 11.
Figure 11. Key intangible indicators in comparison
On Figure 11 four indicators are combined to demonstrate investment into knowledge intangibles and characterizing human assets. Th e numbers next to the country names below the graph show the planned total R&D expenditure as a percentage of GDP by 2020 which expresses a strategic objective. Th ree indicators come from Figure 3 (GRAD, TERT %, T.EDU %), the fourth one comes from Figure 10.
Figure 11 clearly prove the problems V4 countries are facing because of their low level of investment into knowledge intangibles compared to those of the developed countries. At the same time we can also realize how strongly these investments would be needed because of the defi ciencies in human resources qualities. Figure 11 and all the other indicators analyzed in this article prove that the V4 countries lag behind considerably in investing into knowledge – and skills - related intangibles in spite of the fact that they are less well equipped with the necessary human resources needed in the future.
It also calls for special attention what we see on Table 1. Value-intangibles and their changes in the analyzed countries demonstrate important – but very diffi cult to measure - competitiveness factors. Ethical values, social responsibility and cohesion express society values which reinforce or inhibit the creation of a competitiveness friendly environment. It is also obvious that governance quality improvement can help strengthening values of the society. But of course this is a less well researched fi eld which will gain more attention in the future. Further value-intangibles could also be analyzed in contact with competitiveness: like morality or spirituality. Liu (2008) 15 for example writes about “spiritual capital” and warns that if an imbalance emerges between the
“material” and “spiritual” capital, it could lead to economic and competitiveness crises. Strong spiritual capital on the other hand can lessen probability of high corruption level, which is again an important issue for improving competitiveness.
Summing up, we live now in the age of great changes, which requires timely, game changing, novel solutions. Th e V4 countries have been famous of their highly trained and disciplined human resources for a long time. However recently they seem to have slowed down with developing their human resources, and their value intangibles have also deteriorated. Th is could put them at a serious disadvantage compared to those countries the V4 countries had planned to catch up with when joining the EU in 2004. Th e Czech and Polish achievements in some areas are better than that of the rest in the V4 group, however compared to those of the developed countries it is still too little. Human resources, value intangibles, R&D and innovation are and will be the key to competitiveness and social well-being. Th erefore these countries should reconsider their government strategies in order to guarantee that they will not stay behind in the future revolutionary technological changes. Of course the indicators covered in this article are not suffi cient to draw absolute convincing consequences. Further indicators could be included, and correlation could be looked for among them. Cause and eff ect analysis could also further clarify the situation. Other countries from Eastern and Western Europe, as well, could be included into the sample of analyzed countries. And, as indicated, value intangibles and their correlation with competitiveness also require further investigation.
15 Liu, A. (2008): Spiritual Capital Index (SCI): Ranking Countries by Spiritual Capital.
Acknowledgement
Th e research presented in the paper is supported by the National University of Public Service Ludovika priority project KÖFOP-2.1.2-VEKOP-15-2016-00001 entitled “Public Service Development Establishing Good Governance”.
Appendix
Table 1. Value chains in industry and services in selected countries (2016)
Country Industry Services
Hungary 26,3 57,8
Czech Republic 28,9 50,8
Poland 31,5 56,3
Slovakia 23,2 51,0
Austria 31,6 60,2
Germany 35,9 60,4
Table 2. Population by educational attainment level (2017, 15-74 years, %) Country Low level education Medium level
education
High level education
Czech Republic 12,3 67,6 20,1
Hungary 22,1 57,6 20,3
Poland 15,3 59,9 24,8
Slovakia 15,3 64,7 20,0
EU28 28,1 45,2 26,4
Austria 20,5 51,2 28,3
Germany 19,5 55,8 24,7
Denmark 27,2 41,7 31,1
Table 3. Knowledge indicators Country
PhD (capita per 100 of population)
GRAD (capita per 1000 of population)
TERT % T.EDU %
Czech Republic 9 17,0 20,1 18
Hungary 3 12,6 20,3 16
Poland 3 21,5 24,8 24
Slovakia 9 15,8 20,0 26
EU28 9 - 26,4 27
Austria 10 22,1 28,3 37
Germany 13 20,1 24,7 31
Denmark 13 23,3 31,1 34
Table 4. Employment in knowledge intensive activities in businesses as a percentage of total employment (2017, %)
Country %
Czech Republic 12,9
Hungary 11,6
Poland 10,3
Slovakia 10,6
EU28 14,2
Austria 15,0
Germany 14,8
Denmark 15,1
Table 5. Percentage of innovative enterprises (2014) Country All types of
innovation
Product innovation
Process innovation
Organizational innovation
(Total) (Product) (Process) (Org.)
Czech Republic 42,0 10,5 7,7 6,8
Hungary 25,6 6,6 4,2 5,0
Poland 21,0 3,9 5,3 4,7
Slovakia 31,8 5,4 5,7 6,3
EU28 49,1 10,6 8,3 13,1
Austria 59,5 9,9 11,9 17,9
Germany 67,0 19,0 8,7 14,8
Denmark 49,5 12,0 11,4 9,4
Table 6. Relationship of the percentage of innovative enterprises and IMD competitiveness ranking.
Country Competitiveness Innovative R&D as percentage of GDP
Czech Republic 29 42,0 1,68
Hungary 47 25,6 1,21
Poland 34 21,0 1,00
Slovakia 55 31,8 0,79
Austria 18 59,5 3,o9
Germany 15 67,0 2,94
Denmark 6 49,5 2,87
Table 7. Gross domestic expenditure on R&D as % of GDP in selected countries and the planned value for 2020
Country 2009 2010 2011 2012 2013 2014 2015 2016 Target 2020 Hungary 1,13 1,14 1,19 1,26 1,39 1,35 1,36 1,21 1,8 Czech Republic 1,29 1,34 1,56 1,78 1,9 1,97 1,93 1,68 1,0 Poland 0,6 0,66 0,72 0,75 0,88 0,87 0,94 1,0 1,7 Slovakia 0,47 0,62 0,66 0,8 0,82 0,88 1,18 0,79 1,2 Austria 2,6 2,73 2,67 2,91 2,95 3,07 3,05 3,09 3,76 Germany 2,72 2,71 2,8 2,87 2,82 2,87 2,92 2,94 3,0 Denmark 3,06 2,92 2,94 2,98 2,97 2,91 2,96 2,87 3,0 EU28 1,93 1,93 1,97 2,01 2,02 2,03 2,04 2,03 3,0
Table 8. Proportion of R&D expenditure in the diff erent sectors as percentage the total R&D expenditure in the percentage of GDP (%, 2016)
Country Government Higher education Business
Czech Republic 18 20 62
Hungary 13 11 76
Poland 4 31 65
Slovakia 22 28 50
EU28 12 23 65
Austria 5 24 71
Germany 14 18 68
Denmark 2 32 66
Table 9. R&D expenditure per inhabitants by sectors. (Euro, 2016)
Country Government sector Higher education Business sector
Czech Republic 51 57 172
Hungary 19 16 103
Poland 3 34 71
Slovakia 25 33 60
EU28 67 137 385
Austria 58 295 896
Germany 155 206 765
Denmark 31 442 919
Table 10. Adult participation in lifelong learning as a percentage of population (aged 25-64, 2016, %) (LLL %)
Czech Republic 8,8
Hungary 6,3
Poland 3,7
Slovakia 2,9
EU28 10,8
Austria 14,9
Germany 8,5
Denmark 27,7
Table 11. Key intangible indicators in comparison Country R&D 2020
(%) GRAD TERT % LLL (%) T.EDU%
Czech Republic 1,0 17 20,1 8,8 18
Hungary 1,8 12,6 20,3 6,3 16
Poland 1,7 21,5 24,8 3,7 24
Slovakia 1,2 15,8 20,0 2,9 26
EU28 3,0 - 26,4 10,8 27
Austria 3,76 22,1 28,3 14,9 37
Germany 3,0 20,1 24,7 8,5 31
Denmark 3,0 23,3 31,1 27,7 34