https://doi.org/10.1177/1403494817744074
© Author(s) 2017
Reprints and permissions: sagepub.co.uk/journalsPermissions.nav DOI: 10.1177/1403494817744074
journals.sagepub.com/home/sjp
Scandinavian Journal of Public Health, 1–5
Introduction
All-cancer mortality rates in both sexes have been high in the last three decades in Hungary. The most common causes of death from cancer in the last 30 years have been cancers of the lung (7586 deaths/
year on average), followed by colorectal (4608), stomach (2348) and female breast (2174) cancer.
These are also the leading causes of death from can- cer in the European Union. However, among the countries in the European Union in 2012, Hungary recorded one of the highest standardised death rates from oral cavity and pharynx, colorectal, pancreatic, larynx and lung cancers and leukaemia [1].
The seasonal variation in the aetiology of a disease can shed light on the effect of certain environmental factors (e.g. the role of infections). However, cyclical variation is rarely investigated in mortality. Our aim was to investigate the seasonal pattern in cancer mor- tality in Hungary between 1984 and 2013.
Methods
The Hungarian monthly cancer mortality and popu- lation data for the period 1984–2013 were supplied by the Hungarian Central Statistical Office [2]. The underlying causes of death were classified according to the International Classification of Diseases (ICD), Ninth and Tenth Revisions. The major cancer sites under examination together with ICD-10 codes are as follows: all cancers (C00–C96), lip, oral cavity and pharynx (C00–C14), oesophagus (C15), stomach (C16), small intestine (C17), colorectum (C18–
C21), liver and intrahepatic bile ducts (C22), gall- bladder, other and unspecified parts of the biliary tract (C23–C24), pancreas (C25), trachea, bronchus and lungs (C33–C34), female breasts (C50), cervix uteri (C53), corpus uteri (C54), ovaries (C56), pros- tate (C61), bladder (C67) and brain (C71), as well as malignant neoplasms of the lymphoid, hematopoietic and related tissues (C81–C96).
Seasonal variation of cancer mortality in Hungary between 1984 and 2013
KATAlIN VIRág1 & TIbOR ANDRáS NyáRI2
1Bolyai Institute, and 2Department of Medical Physics and Informatics; University of Szeged, Hungary
Abstract
Aims: Despite decreasing trends, Hungary is the leader in cancer mortality among European countries. We examined the seasonal variation of cancer mortality in Hungary between 1984 and 2013. Methods: Hungarian monthly cancer mortality and population data were used in the analysis. The Walter–Elwood method was used to determine seasonal variation in both mortality rates and proportionate mortality. Results: Significant winter-peak seasonality was found in all-cancer mortality.
A similar seasonal trend with a peak from November to January was observed in death rates from colorectal, lung, female breast, prostate, bladder, brain, lymphoid and hematopoietic cancers. However, no more cyclical variation was identified in the mortality rates from other cancers. In addition, significant seasonal variation in proportionate mortality was shown for all cancer sites examined, with a peak in August or September. Conclusions: This study presents the seasonality pattern of different types of cancer mortality which might be related to environmental factors (e.g. infections).
Key Words: Cancer, mortality, proportionate mortality, seasonal variation, epidemiology, Hungary
Correspondence: Tibor András Nyári, Department of Medical Physics and Informatics, University of Szeged, H-6720 Szeged, Korányi fasor 9, Hungary.
E-mail: nyari.tibor@med.u-szeged.hu
Date received: 12 May 2017; revised: 29 September 2017; accepted: 10 October 2017
SHorT CoMMunICATIon
Seasonal trends on deaths from cancer in aggre- gated monthly data were investigated using general- ised linear models [3] and the Walter–Elwood method [4]. Seasonality in proportionate mortality and in crude mortality rates was also analysed. Monthly deaths were adjusted for month length. Monthly pop- ulation estimates were calculated on the basis of the monthly number of births and deaths supplied by the Hungarian Central Statistical Office. Proportionate mortality is calculated as the fraction of all deaths due to a specific cause. The monthly average and the total number of cancer deaths were also calculated for each cause of death as descriptive statistics. Winter-to- summer ratios for all causes of death were calculated as the total number of deaths in December, January and February divided by the total number of deaths in June, July and August.
p-Values <0.05 were considered to be statistically significant. All analyses were conducted with Stata Statistical Software v9 (StataCorp lP, College Station, TX).
results
Seasonality in cancer mortality rates
Overall, 959,307 deaths from malignant neoplasms were registered in Hungary during the study period.
The highest mortality of 227,581 was found from lung cancer, and the smallest from cancer of the small intestine (2073). The monthly and the total numbers of deaths from different types of cancer are summarised in Table I.
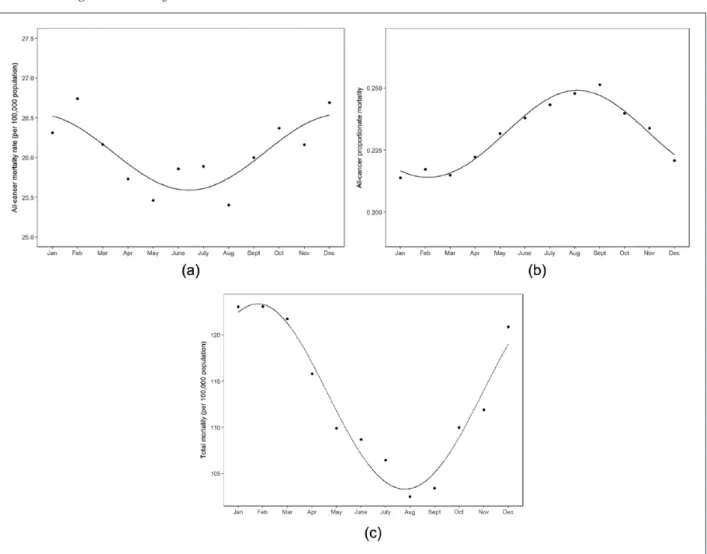
The Walter–Elwood method indicated significant seasonality in the mortality rates from all malignant neoplasms combined with a winter peak (p<0.001, peak in December; Figure 1(a)). A similar cyclical vari- ation was observed in the mortality rates from cancers of the trachea, bronchus and lungs (p<0.001, December), and bladder (p<0.001, December). A win- ter peak was also found in the mortality rates from female breast (p<0.001, January) and prostate (p<0.001, January) cancers and cancers of the lym- phoid, hematopoietic and related tissues (p<0.001, January). Colorectal and brain cancer deaths were sig- nificantly the highest in November (p=0.016 and 0.002, respectively). The mortality rates from cancer of the oesophagus were significantly the highest in August (p=0.006). However, no more cyclical variation was identified in the mortality rates from other cancers (Table I). In spite of the higher numbers of deaths from gastric (stomach) cancer, no evidence of a significant cyclical trend in mortality rates was found (p=0.603).
Negative binomial regression models confirmed the findings reached with the Walter–Elwood method.
All models provided a reasonable fit using the devi- ance goodness-of-fit test (Table I). The winter-to- summer ratio varied from 0.951 (cancer of the oesophagus) to 1.089 (malignant neoplasms of lym- phoid, hematopoietic and related tissues; Table I).
Seasonality in proportionate mortality from cancer
The all-cancer proportionate mortality rates have varied from 21.4% to 25.1% in January and in September, respectively. Walter–Elwood tests and negative binomial regression models on proportion- ate mortality indicate that there is significant evi- dence of seasonality for all cancer sites under examination (p<0.001), with a peak in August or September. Figure 1(b) shows the monthly all-cancer proportionate mortality.
Discussion Main findings
Either significant late autumn-winter peak seasonal- ity or non-cyclical variation was found in the mortal- ity rates from the main cancer sites under examination.
Nevertheless, significant seasonality was found in the proportion of deaths from all cancers detected and in the main cancer sites under examination, with a peak in August and trough in February.
Strengths and weaknesses of the study
Our data were obtained from published tables and civil registers, which could have been influenced by a cer- tain simplification of the categorisation and by the dif- ference in the two revisions of the ICD that were introduced in Hungary during the study period.
Additionally, minor changes occurred in the structure of the reported data. However, the Walter–Elwood method was used on aggregated mortality data with a long study period of 30 years. Moreover, negative bino- mial regression models confirmed the findings from the Walter–Elwood tests. An investigation of seasonal- ity stands as an important component in understand- ing the aetiological description of certain diseases.
Comparison with other studies
Previous studies have demonstrated a link between season of diagnosis and survival for many cancer types in several European populations. Moreover, Ho et al. [5] showed that seasonality depends on latitude.
However, seasonal variation in cancer mortality is rarely investigated. It is already known that overall
Table I. Average monthly and total number of cancer deaths in Hungary between 1984 and 2013. All cancerslip, oral cavity and pharynx OesophagusStomachSmall intestineColorectumliver and intrahepatic bile ducts gallbladder, other and unspecified parts of biliary tract PancreasTrachea, bronchus and lungs
Female breastCervix uteriCorpus uteriOvaryProstatebladderbrainMalignant neoplasms of the lymphoid, hematopoietic and related tissues January*269411549201638276771306391894228531097053155 February*273712651204639078761356481914328561096756159 March*267711749194638578761336361834329531057153156 April*263211350191538174741316251774329541066552152 May*260411750194637575711346201774028551006350148 June*264412053196637978761336201814227521026555143 July*264711854197638676751366251764429551026552142 August*25971165119373827175128612172412954996656147 September*265711754199638975751336311764227571036653150 October*269511851197638880761366411814230541086657150 November*267311950189638077731336421834527521086955151 December*272711950194639376761366471894329521126957157 Total319821415613234869460991390015987587217551134164712628036481809 Significant cyclical peakDecAugNovDecJanJanDecNovJan p-Value<0.0010.5750.0060.6030.9110.0160.3980.4830.780<0.001<0.0010.4410.9980.726<0.001<0.0010.002<0.001 Winter-to-summer ratio1.0341.0160.9511.0230.9741.0161.0151.0121.0111.0411.0751.0090.9960.9871.0881.0511.0181.089 gOF0.2130.2170.650.2140.8460.2140.2110.5040.2110.2090.2080.2820.2140.2160.4970.2160.2110.583 *Adjusted for month length. gOF: deviance goodness-of-fit test p-value.
mortality is higher in cooler than in warmer months in Europe [6]. Nevertheless, Marti-Soler et al. [7]
found little or no seasonal variation in cancer mortal- ity in most countries. Nakaji et al. [8] reported major influences of seasonal change on the overall causes of death in Japan, with the highest rates in winter, but not on mortality from cancer. Similarly, an increase in deaths from non-cancer during winter was reported in sub-tropical Asian cities [9]. However, Medenwald and Kuss [10] observed noticeably more deaths from cancer than expected in the week preceding Christmas.
In our study, significant winter peak seasonality was found in mortality rates from all cancer. Additionally, significant cyclical variation on proportionate mortal- ity was observed for all cancer sites examined, with a peak in August or September. The proportionate mor- tality rates varied from 21.4% to 25.1% in January and September, respectively, and yielded a summer peak in the proportionate cancer mortality. This inverse seasonal cycle must be the result of the very
same variation, with a much stronger variation for non-cancer mortality than for cancer mortality (Figure 1(a)–1(c)). However, both seasonal patterns are inter- esting and informative to potentiate prevention.
De’ Donato et al. [11] reported that an increase was detected in the effect of high temperatures for all causes of death considered in budapest (and in eight other European cities), although statistical signifi- cance was only reached for cardiovascular causes.
Furthermore, in Hungary, the warmest period of the year is late July and early August, though higher extreme temperatures were registered in August [12].
by contrast, the excess winter mortality can be attrib- uted to environmental factors such as air pollution, residential heating and seasonal infections [13].
Although seasonal patterns in all-cancer mortality have already been examined by other investigators, as far as we are aware, this is the first epidemiological study to report the effect of seasonality in mortality at different cancer sites.
Figure 1. (a) Seasonal variations in monthly all-cancer mortality rates (per 100,000 population) in Hungary between 1984 and 2013. (b) Seasonal variations in monthly all-cancer proportionate mortality in Hungary between 1984 and 2013. (c) Seasonal variations in monthly total (all cause) mortality rates (per 100,000 population) in Hungary between 1984 and 2013.
Conclusions
Our ecological study presented the seasonality pat- tern of some cancer mortality which might be related to environmental factors (e.g. infections, tempera- ture). We speculate that infectious diseases may increase the risk of mortality among immune defi- cient patients. However, further cohort studies are required to explain the seasonal pattern of mortality due to cancer.
Declaration of conflicting interests
The authors declare that there is no conflict of interest.
Funding
The authors disclosed receipt of the following finan- cial support for the research, authorship, and/or pub- lication of this article: Katalin Virág and this study were supported by the European Union and the State of Hungary, co-financed by the European Social Fund within the framework of the TáMOP- 4.2.4.A/2-11/1-2012-0001 ‘National Excellence Programme’ and EFOP-3.6.1-16-2016-00008.
references
[1] Ferlay J, Steliarova-Foucher E, lortet-Tieulent J, et al. Can- cer incidence and mortality patterns in Europe: estimates for 40 countries in 2012. Eur J Cancer 2013;49:1374–1403.
[2] Hungarian Central Statistical Office. Demographic yearbook 1984–2013. budapest, Hungary: Hungarian Central Statisti- cal Office.
[3] Stolwijk AM, Straatman H and Zielhuis gA. Studying seasonality by using sine and cosine functions in regres- sion analysis. J Epidemiol Community Health 1999;53:
235–238.
[4] Walter SD and Elwood JM. A test for seasonality of events with a variable population at risk. Br J Prev Soc Med 1975;29:18–21.
[5] Ho A, gabriel A, bhatnagar A, et al. Seasonality pattern of breast, colorectal, and prostate cancer is dependent on lati- tude. Med Sci Monit 2014;20:818–824.
[6] Healy JD. Excess winter mortality in Europe: a cross coun- try analysis identifying key risk factors. J Epidemiol Commu- nity Health 2003;57:784–789.
[7] Marti-Soler H, gonseth S, gubelmann C, et al. Seasonal variation of overall and cardiovascular mortality: a study in 19 countries from different geographic locations. PLoS One 2014;9:1–13.
[8] Nakaji S, Parodi S, Fontana V T, et al. Seasonal changes in mortality rates from main causes of death in Japan. Eur J Epidemiol 2004;19:905–913.
[9] goggins Wb, Chan Eyy, yang C, et al. Associations between mortality and meteorological and pollutant vari- ables during the cool season in two Asian cities with sub- tropical climates: Hong Kong and Taipei. Environ Heal 2013;12:1.
[10] Medenwald D and Kuss O. Deaths and major biographical events: a study of all cancer deaths in germany from 1995 to 2009. BMJ Open 2014;4:e004423.
[11] De’ Donato FK, leone M, Scortichini M, et al. Changes in the effect of heat on mortality in the last 20 years in nine European cities. Results from the PHASE project. Int J Environ Res Public Health 2015;12:15567–15583.
[12] OMSZ, www.met.hu/en/eghajlat/magyarorszag_eghajlata/
altalanos_eghajlati_jellemzes/homerseklet/ (2017, accessed May 12, 2017).
[13] The Eurowinter group. Cold exposure and winter mortality from ischaemic heart disease, cerebrovascular disease, respi- ratory disease, and all causes in warm and cold regions of Europe. Lancet 1997;349:1341–1346.