Pigments of the Moss Paraleucobryum longifolium: Isolation and Structure Elucidation of Prenyl-Substituted 8,8 ′ -Linked 9,10- Phenanthrenequinone Dimers
Dezső Csupor, Tibor Kurtán,* Martin Vollár, Norbert Kúsz, Katalin E. Kövér, Attila Mándi, Péter Szűcs, Marianna Marschall, Seyyed A. Senobar Tahaei, István Zupkó, and Judit Hohmann*
Cite This:J. Nat. Prod.2020, 83, 268−276 Read Online
ACCESS
Metrics & More Article Recommendations*
sı Supporting InformationABSTRACT: In a search for new secondary metabolites from mosses, leucobryns A−E, axially chiral 9,10-phenanthrenequinone dimers, were isolated fromParaleucobryum longifolium(1−5), together with diosmetin triglycoside. Leucobryns B (2) and C (3) were proved to be homodimeric atropodiastereomers containing both axial and central chirality elements, while leucobryns D (4) and E (5) were found to be heterodimeric atropodiastereomers containing central chirality in only one of the two monomeric units.
Axial chirality of the compounds was determined by ECD measurements and sTDA ECD calculations, while the central chirality elements were assigned by TDDFT-SOR calculations. Leucobryns represent the first 9,10-phenanthrenequinone dimers, the monomers of which are linked through their C-8 atoms. Leucobryns B−E contain an uncommon C10monoterpenoid side chain, in which isoprenoid units are joined by 3,4 linkages. Leucobryns A and B exhibited weak antiproliferative activity against several human cancer cell lines.
B
ryophytes, comprising about 23 000 species worldwide, are a source of structurally unique, bioactive compounds.Although the phytochemical and pharmacological potential of bryophytes is poorly explored because of the difficulties of their collection and botanical identification, numerous new com- pounds have been discovered from liverworts so far, including more than 40 new carbon skeletons of terpenoids and phenolic compounds.1−5 Many moss species have been used as medicinal plants for infections and neurological disorders and also for their nutritional value.3−5 The biological effects ascribed to the compounds identified in liverworts are mainly related to cytotoxic, antimicrobial, antifungal, antiviral, insecticide, nematocide, enzyme inhibitory, antiallergic, muscle relaxant, and antioxidant activities.3−6Mono-, sesqui-, di-, and triterpenoids, highly unsaturated fatty acids, flavonoids, bibenzyls, bis-bibenzyls, acetogenins, and phenanthrenes are the main chemical types of secondary metabolites of liverworts.3−5
Paraleucobryum longifolium (Ehrh. ex Hedw.) Loeske, belonging to the Dicranaceae family, is widely distributed in North America, Russia, and Europe. The plant grows on cliffs,
tree trunks, stumps, and rotten logs, at moderate to high (400−2900 m) altitudes.7 P. longifolium was investigated earlier for lipid constituents; wax esters, hydrocarbons, and steryl esters have been described from the plant.8 In the present study, secondary metabolites of P. longifolium were analyzed with special attention to the pigments with a violet color. Herein, we report the isolation, structure determination, and pharmacological evaluation of five new 9,10-phenanthre- nequinone dimers, named leucobryns A−E (1−5).
■
RESULTS AND DISCUSSIONP. longifoliumwas extracted with MeOH, and the evaporated extract was subjected to column chromatography (CC) on polyamide. Fractions eluted with 80% MeOH displayed a strong violet color. Dark violet compounds1−5were isolated
Received: July 15, 2019 Published: February 20, 2020
Article pubs.acs.org/jnp
© 2020 American Chemical Society and
License, which permits unrestricted use, distribution and reproduction in any medium, provided the author and source are cited.
Downloaded via 178.164.224.3 on March 13, 2020 at 16:13:52 (UTC). See https://pubs.acs.org/sharingguidelines for options on how to legitimately share published articles.
using vacuum liquid chromatography, gel filtration on Sephadex LH-20, and RP-HPLC.
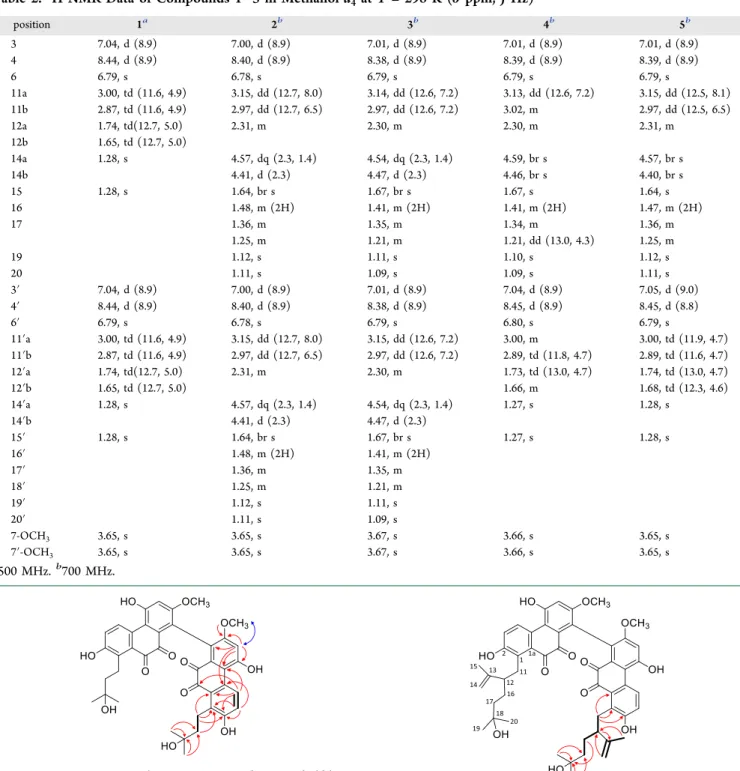
Compound 1 was obtained as a dark violet amorphous powder with UV maxima at 542.5, 370, 305, 272, and 213.5 nm. The molecular formula was established as C40H38O12 based on HRESIMS data, which showed the sodium adduct ion [M + Na]+ at m/z 733.2252 (calcd for 733.2255 C40H38O12Na). The 13C JMOD spectrum displayed 20 resonances, which indicated that compound1 is a symmetric dimer (Figure 1).
The monomeric moiety of the molecule is constructed by 10 nonprotonated carbons (δC 71.98, 118.00, 121.19, 129.50, 131.07, 131.23, 133.91, 155.84, 156.81, and 157.65), two carbonyl (δC192.01 and 192.77), three methines (δC107.65, 122.06, and 129.97), two methylenes (δC23.07 and 44.21), a methoxy group (δC 56.29), and two methyls (δC 28.86 and 28.99) (Table 1). The evaluation of 1D 1H and 2D1H−1H
COSY spectroscopic data revealed the presence of twoortho- doublets (δH8.44 d, 7.04 d), an isolated aromatic proton (δH
6.79 s), an ethylene group (δH, 3.00 td, 2.87 td, 1.74 td, 1.65 td), two methyls [δH1.28 s (6H)], and a methoxy group [δH
3.65 s (3H)] (Table 2). HMBC correlations between H-6 and C-5, C-7, C-8, and C-5a, between H-3 and C-1, C-2, C-4, and C-4a, and between H-4 and C-2, C-1a, and C-10 disclosed that compound1contains a 9,10-phenanthrenedione parent system with O-functionalities at C-2 (δC 155.84), C-5 (δC 156.81), and C-7 (δC157.65) andC-functionalities at C-1 (δC133.91) and C-8 (δC 121.19) (Figure 2). The alternative anthraqui- none structure was ruled out because the strong HMBC cross- peak observed between H-4 and C-5a suggested that they are separated by three rather than four bonds. The other three- bond correlations of H-4 with C-2 and C-1a had similar intensities. On the other hand, a weak four-bond heteronuclear interaction was detected between H-4 and the carbonyl carbon Figure 1.Structures of leucobryns A−E (1−5).
at δC‑10 192.77. Furthermore, the proposed structure was confirmed by a weak cross-peak exhibited between H-6 and C- 4a, which would not be expected in an anthraquinone, due to the long distance (5 bonds) between these atoms.
The presence of the methoxy group at C-7 was established by HMBC correlations between the OCH3protons and C-7
and C-6 and by a NOESY cross-peak between H-6 and the OCH3 group. A 3-hydroxyisopentyl substituent was corrobo- rated with the HMBC cross-peaks observed between the methyl protons atδH1.28 (H3-14, H3-15) and C-13 (δC71.98) and C-12 (δC44.21); this group was placed at C-1 on the basis of the H-11/C-1, H-11/C-1a, H-11/C-2, and H-12/C-1 HMBC correlations. A hydroxy group, concluded from the HRESIMS data, is attached at C-7, as confirmed by its chemical shift value ofδC157.65. In accordance with all these data, the structure of compound1, named leucobryn A, could be established as a dimer in which the monomers are connected via their C-8 atoms as depicted inFigure 1.
Compound2 possessed a molecular formula of C50H54O12 as determined by the HRESIMS ion at m/z 869.3505 [M + Na]+ (calcd for 869.3507, C50H54O12Na). The 1H NMR and
13C JMOD spectra revealed a structure containing 25 carbon atoms only, suggesting a symmetric dimeric structure, similarly to compound 1. The 1H NMR and 13C JMOD spectra of2 also resembled those of 1. In particular, the 1H and 13C chemical shifts of the 9,10-phenanthrenedione part were close to those of 1 (Tables 1and 2). The main differences were found in the C5prenyl side chain, which was changed to a C10 moiety in2. Combined analysis of1H NMR,13C JMOD, and HSQC spectra proved that this C10substituent consists of a nonprotonated, oxygenated carbon (δC71.46), a disubstituted carbon−carbon double bond (δH4.41 d, 4.57 dq; δC112.61, 148.85), three sp3 methylenes [δH 1.25 m, 1.36 m, 1.48 m (2H), 2.97 dd, 3.15 dd;δC28.28, 31.26, 42.85], a methine (δH
2.31 m;δC50.13), and three methyl groups (δH1.11 s, 1.12 s, 1.64 br s;δC18.56, 28.88, 29.30). Based on the1H−1H COSY spectrum, two structural fragments could be unambiguously assigned for the C10part:−CH2−CHR−CH2−CH2−(A) and CH2(CH3)C−(B) (Figure 3).
Structural fragment A (C-11−C-12−C-16−C-17) was connected to the phenanthrenedione skeleton based on the long-range C−H correlations of H-11/C-1a, H-11/C-1, and H-11/C-2. In addition, a 2-hydroxyisopropyl group, attached to C-17, was confirmed by the HMBC correlations between H3-19/C-17, H3-19/C-18, and H3-20/C-17. HMBC cross- peaks between H-14/C-12, H-15/C-12, and H-12/C-13 unambiguously established that unit B (C-13−C-14−C-15) is linked to C-12. The data above provided evidence for a C10 monoterpene side chain, in which, interestingly, the isoprenoid units are joined by 3,4 linkages, instead of the regular head-to- tail, tail-to-tail, or head-to-head connection. Collectively, the structure of compound2was established as shown inFigure 1 and named leucobryn B.
Compound3(leucobryn C) was isolated the same way as2, and in thefinal step of the purification procedure compounds2 and3 were separated by RP-HPLC. The HRESIMS data of3 displayed a sodium adduct ion at m/z 869.3507 [M + Na]+, indicating the same molecular formula of C50H54O12as that of compound2. 1D and 2D1H/13C NMR characteristics of2and 3 were similar, with only minute differences observed in the chemical shifts of H-14, H-16, C-10, C-11, and C-14 (Tables 1 and2). These data suggest that the structural differences are explicable in terms of the stereochemistry of the compounds.
Compound 4 (leucobryn D) was isolated as a dark violet amorphous solid. HRESIMS data revealed a molecular formula of C45H46O12 according to the sodium adduct ion at m/z 801.2876 [M + Na]+ (calcd for C45H46O12Na 801.2881). 1H NMR and 13C JMOD data contained signals similar to the resonances of both compounds 1 and 2 (Tables 1 and 2), Table 1.13C NMR Data of Compounds 1−5 (Methanol-d4,
T= 298 K,δppm)
position 1a 2b 3b 4b 5b
1 133.91 132.32 132.30 132.29 132.30
1a 129.50 130.39 130.20 130.21 130.37
2 155.84 156.31 156.35 156.35 156.31
3 122.06 121.70 121.81 121.81 121.69
4 129.97 129.95 129.98 129.97 129.95
4a 131.07 130.94 131.10 131.09 130.95
5 156.81 156.73 156.74 156.75 156.71f
5a 118.00 118.15 118.12 118.13 118.13
6 107.65 107.62 107.60 107.65 107.67g
7 157.65 157.44 157.78 157.61 157.47e
8 121.19 120.83 120.96 120.97 120.95c
8a 131.23 131.14 130.94 130.95c 130.91h
9 192.01 n. o. 192.38 192.44d 192.68d
10 192.77 192.06 193.57 193.68 193.81
11 23.07 31.26 31.84 31.22 31.25
12 44.21 50.13 50.02 50.04 50.12
13 71.98 148.85 149.07 149.07 148.83
14 28.99 112.61 112.29 112.30 112.60
15 28.86 18.56 18.59 18.58 18.54
16 28.28 28.04 28.05 28.13
17 42.85 42.84 42.83 42.85
18 71.46 71.47 71.46 71.46
19 29.30 29.30 29.28 29.30
20 28.88 28.86 29.00 28.99
1′ 133.91 132.32 132.30 133.92 133.92
1′a 129.50 130.39 130.20 129.51 129.52
2′ 155.84 156.31 156.35 155.84 155.84
3′ 122.06 121.70 121.81 122.06 122.05
4′ 129.97 129.95 129.98 129.97 129.95
4a′ 131.07 130.94 131.10 131.25 131.25
5′ 156.81 156.73 156.74 156.88 156.79f
5a′ 118.00 118.15 118.12 118.01 118.01
6′ 107.65 107.62 107.60 107.65 107.60g
7′ 157.65 157.44 157.78 157.85 157.60e
8′ 121.19 120.83 120.96 121.17 121.06c
8a′ 131.23 131.14 130.94 131.09c 131.25h
9′ 192.01 n. o. 192.38 191.98d 191.96d
10′ 192.77 192.06 193.57 192.67 192.68
11′ 23.07 31.26 31.24 23.06 23.07
12′ 44.21 50.13 50.02 44.21 44.22
13′ 71.98 148.85 149.07 71.98 71.98
14′ 28.99 112.61 112.29 28.86 28.88
15′ 28.86 18.56 18.59 28.86 28.88
16′ 28.28 28.04
17′ 42.85 42.84
18′ 71.46 71.47
19′ 29.30 29.30
20′ 28.88 28.86
7-OCH3, 56.29 56.27 56.28 56.28 56.28
7′-OCH3 56.29 56.27 56.28 56.28 56.28
a125 MHz.b175 MHz; n.o. not observed. c,d,e,f,g,hSignals in each column are interchangeable.
indicating that compound4 is a heterodimer constructed by the monomeric moieties of1and2. As in compounds1and2, the monomeric constituents of4 are connected via their C-8 atoms. 2D NMR studies provided further evidence to confirm the structure of this compound as depicted in structural formula4.
Compound 5 (leucobryn E) was separated from 4 by RP- HPLC using a gradient system of MeCN−H2O mixtures. All HRESIMS and NMR characteristics of compound 5 were highly similar to those of 4, suggesting a molecular pair with the same 2D structure, but with different chirality.
In addition, diosmetin 7-O-[2,4-di-O-(α-L-rhamnopyrano- syl)]-β-D-glucopyranoside was also isolated fromP. longifolium
and identified based on NMR data (Table S1, Supporting Information).
For the configurational assignment of the axial chirality elements of 1−5, conformational analysis and the sTDA (simplified Tamm−Dancoff approximation) approach9 were applied on the arbitrarily chosen (aS,12R,12′R)-2 and (aR,12R,12′R)-3 stereoisomers differing in the axial chirality.
When both central and axial chirality elements are present in biaryl compounds, the ECD spectrum is governed by the axial chirality element, which can be elucidated by ECD calculations.10 The experimental ECD spectrum of 1, Table 2.1H NMR Data of Compounds 1−5 in Methanol-d4at T= 298 K (δ ppm,JHz)
position 1a 2b 3b 4b 5b
3 7.04, d (8.9) 7.00, d (8.9) 7.01, d (8.9) 7.01, d (8.9) 7.01, d (8.9)
4 8.44, d (8.9) 8.40, d (8.9) 8.38, d (8.9) 8.39, d (8.9) 8.39, d (8.9)
6 6.79, s 6.78, s 6.79, s 6.79, s 6.79, s
11a 3.00, td (11.6, 4.9) 3.15, dd (12.7, 8.0) 3.14, dd (12.6, 7.2) 3.13, dd (12.6, 7.2) 3.15, dd (12.5, 8.1)
11b 2.87, td (11.6, 4.9) 2.97, dd (12.7, 6.5) 2.97, dd (12.6, 7.2) 3.02, m 2.97, dd (12.5, 6.5)
12a 1.74, td(12.7, 5.0) 2.31, m 2.30, m 2.30, m 2.31, m
12b 1.65, td (12.7, 5.0)
14a 1.28, s 4.57, dq (2.3, 1.4) 4.54, dq (2.3, 1.4) 4.59, br s 4.57, br s
14b 4.41, d (2.3) 4.47, d (2.3) 4.46, br s 4.40, br s
15 1.28, s 1.64, br s 1.67, br s 1.67, s 1.64, s
16 1.48, m (2H) 1.41, m (2H) 1.41, m (2H) 1.47, m (2H)
17 1.36, m 1.35, m 1.34, m 1.36, m
1.25, m 1.21, m 1.21, dd (13.0, 4.3) 1.25, m
19 1.12, s 1.11, s 1.10, s 1.12, s
20 1.11, s 1.09, s 1.09, s 1.11, s
3′ 7.04, d (8.9) 7.00, d (8.9) 7.01, d (8.9) 7.04, d (8.9) 7.05, d (9.0)
4′ 8.44, d (8.9) 8.40, d (8.9) 8.38, d (8.9) 8.45, d (8.9) 8.45, d (8.8)
6′ 6.79, s 6.78, s 6.79, s 6.80, s 6.79, s
11′a 3.00, td (11.6, 4.9) 3.15, dd (12.7, 8.0) 3.15, dd (12.6, 7.2) 3.00, m 3.00, td (11.9, 4.7) 11′b 2.87, td (11.6, 4.9) 2.97, dd (12.7, 6.5) 2.97, dd (12.6, 7.2) 2.89, td (11.8, 4.7) 2.89, td (11.6, 4.7)
12′a 1.74, td(12.7, 5.0) 2.31, m 2.30, m 1.73, td (13.0, 4.7) 1.74, td (13.0, 4.7)
12′b 1.65, td (12.7, 5.0) 1.66, m 1.68, td (12.3, 4.6)
14′a 1.28, s 4.57, dq (2.3, 1.4) 4.54, dq (2.3, 1.4) 1.27, s 1.28, s
14′b 4.41, d (2.3) 4.47, d (2.3)
15′ 1.28, s 1.64, br s 1.67, br s 1.27, s 1.28, s
16′ 1.48, m (2H) 1.41, m (2H)
17′ 1.36, m 1.35, m
18′ 1.25, m 1.21, m
19′ 1.12, s 1.11, s
20′ 1.11, s 1.09, s
7-OCH3 3.65, s 3.65, s 3.67, s 3.66, s 3.65, s
7′-OCH3 3.65, s 3.65, s 3.67, s 3.66, s 3.65, s
a500 MHz.b700 MHz.
Figure 2.Key 2D NMR correlations in compound1;―bold line:
1H−1H COSY,→red arrows: HMBC,↔blue arrow: NOESY.
Figure 3.Key 2D NMR correlations in the monoterpenoid part of2;
―bold line:1H−1H COSY,→red arrows: HMBC.
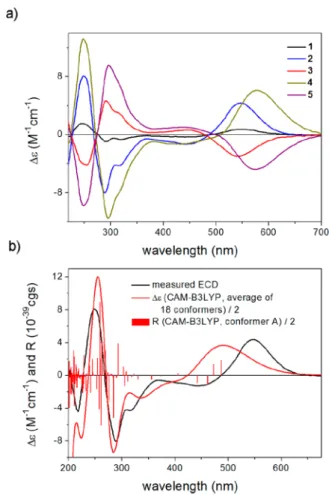
containing only an axial chirality element, was found to be similar to those of 2 and 4, but with weaker intensity, and nearly mirror-images of the ECD spectra of 3 and 5 were recorded, indicating that the central chirality elements of2−5 do not significantly contribute to the ECD spectra (Figure 4a).
In axially chiral biaryls, the absolute configuration of the central chirality elements was determined by ECD analysis of the monomers co-isolated from the same source11,12 or, alternatively, by VCD calculations.13 The configurational assignment of both central and axial chirality elements in axially chiral natural biaryls is considered a challenging task by even the combination of different chiroptical methods and their computation.10a,11a,14 Owing to the substitution pattern in the ortho-positions of the biaryl axis, biaryls 1−5 were expected to have a rotational energy barrier exceeding 93.6 kJ/
mol, which is considered the minimum rotational energy barrier for the presence of separable atropisomers.15
Biaryls 1−5 are expected to have a large number of ECD transitions to compute, which required the use of the sTDA method9c,d developed for large molecules and/or for compounds with a large number of ECD transitions. This method was developed for complex molecules, the TDDFT calculation of which would be quite demanding computation- ally or not feasible at an advanced DFT level. Despite the
strengths of this method, there are only a few examples for application in the field of natural products.16,17 The initial Merck Molecular Force Field (MMFF) conformational search of (12R,12′R)-2/3resulted in 1326 conformers in a 21 kJ/mol energy window, including both the (aS,12R,12′R)-2 and (aR,12R,12′R)-3 stereoisomers, which were separated man- ually. Subsequently, they were reoptimized at the AM1 semi- empirical level to reduce the number of conformers18and then at the CAM-B3LYP/TZVP19PCM/MeCN level.
sTDA-ECD calculations were performed for conformers above 1% population at the CAM-B3LYP, LC-BLYP,20 and ωB97X21 levels, for which the required single-point calcu- lations were performed with the same functionals and the TZVP basis set. All of the Boltzmann-averaged ECD spectra of (aS,12R,12′R)-2 and (aR,12R,12′R)-3 consistently gave moderate to good agreement with the experimental ECD spectrum of 2 and 3, respectively, and all the low-energy conformers of the same axial chirality exhibited similar ECD spectra, permitting the elucidation of the absolute confi- guration of the axial chirality as (aS) in2and (aR) in3(Figure 4b andFigure 5).
Thus, compounds 2 and 3 are atropodiastereomers with identical absolute configuration of their stereogenic centers.
Comparing the ECD spectra of1,4, and5to those of2and3 revealed the absolute configuration of1and4as (aS) and that of5 as (aR) (Figure 4a).
Since both the experimental and computed ECD spectra of (aS,12R,12′R)-2and (aR,12R,12′R)-3 showed a mirror-image relationship, in principle the determination of the central chirality element was not feasible with the ECD spectra.
However, the experimental specific rotation (SR) values of 2 and3had different magnitudes with opposite signs [2: [α]23D
= +162,3: [α]23D=−222], which suggested that the SR values are also influenced by the central chirality elements, although the different signs derived from the different axial chirality. In order to elucidate the absolute configuration of the central chirality elements, SR calculations of (aS,12R,12′R)-2 and (aR,12R,12′R)-3 were performed on the CAM-B3LYP/TZVP PCM/acetone conformers.22 Considering that 2 and 3 are Figure 4.(a) Comparison of the experimental ECD spectra of1−5
measured in MeCN; (b) comparison of the experimental ECD spectrum of 2 in MeCN to the sTDA-CAM-B3LYP spectrum of (aS,12R,12′R)-2 computed from the CAM-B3LYP/TZVP single- point data. Level of optimization: CAM-B3LYP/TZVP PCM/MeCN.
Bars represent the rotational strength values of the lowest-energy conformer.
Figure 5.Comparison of the experimental ECD spectrum of 3 in MeCN with the sTDA-CAM-B3LYP ECD spectrum of (aR,12R,12′R)-3 computed from the CAM-B3LYP/TZVP single- point data. Level of optimization: CAM-B3LYP/TZVP PCM/MeCN.
Bars represent the rotational strength values of the lowest-energy conformer.
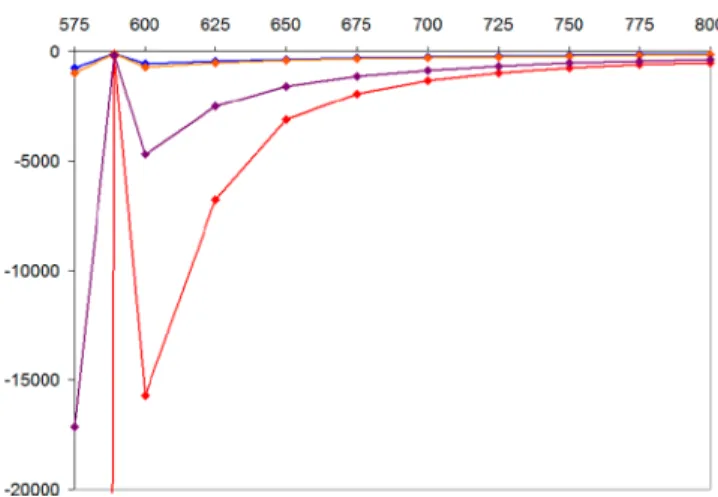
homodimers with identical C-12 and C-12′ absolute configuration in the monomeric units, the (aS,12R,12′R)-2 and (aR,12R,12′R)-3 stereoisomers fully cover all four possibilities. In line with the ECD results, Boltzmann-averaged SR values computed at four levels of theory for (aS,12R,12′R)- 2 showed consistently positive values ranging from 46.5 to 161.6 vs the experimental SR value of 162, while those computed for (aR,12R,12′R)-3gave negative values with larger magnitude in the range of −102.8 to −234.0 vs the experimental SR of −222. Although the magnitude of computed SRs can be considerably different from that of the experimental ones,23 all four applied combinations of levels showed a clear tendency with larger absolute values for the (aR,12R,12′R) configuration compared to those of (aS,12R,12′R). A good agreement for the B3LYP/TZVP PCM/acetone // CAM-B3LYP/TZVP PCM/acetone level [161.6 vs experimental 162 for (aS,12R,12′R)-2and−234.0 vs experimental −222 for (aR,12R,12′R)-3)] permitted a probable assignment of the central chirality as (aS,12R,12′R)-2 and (aR,12R,12′R)-3. The wavelength of experimental SR values measured at the sodium D line (589.3 nm) falls in the higher-wavelength range of the highest- wavelength ECD transition of2and3, and they had the same signs as those of the corresponding ECD transition.24In order to check that the SR values of2 and3recorded at 589.3 nm belong to the monotonously increasing wavelength range of the ORD spectrum without a change of sign (ORD anomaly) or they contain the effect of the ORD anomaly, SR values of (aS,12R,12′R)-2 and (aR,12R,12′R)-3 were calculated at 10 selected wavelengths in the range of 575−800 nm with four methods (Figures 6and7). These SR calculations consistently
showed that there was no sign inversion of SR values in the 600−800 nm wavelength range, while anomalous ORD appears around the wavelength of the sodium D line. The ORD anomaly expected below 600 nm and the MMFF-AM1- clustering-DFT reoptimization sequence for the conforma- tional analysis to reproduce the biaryl dihedral angles and the side-chain conformation may expose some uncertainty in the determination of the central chirality. However, the computed SR values clearly support the conclusion, and characteristic
differences in the magnitudes of the computed SR values for (aS,12R,12′R)-2and (aR,12R,12′R)-3appeared consistently at all the computed wavelengths.25
The SR calculations of (aS,12R,12′R)-2and (aR,12R,12′R)- 3represent thefirst example to determine the central chirality of a homodimeric biaryl natural product in the presence of axial chirality on the basis of the SR calculations. VCD measurement and calculations were reported earlier to determine both axial and central chirality for the biaryl natural product (aS,2R,2′R)-cephalochromin, the SR calculation of which could not decide on the central chirality.13However, the same VCD approach failed to determine the central chirality of flavomannin A in the presence of axial chirality.10a SR calculations were also successfully utilized to determine the central chirality of quinolinophane derivatives containing both planar and central chirality elements.26The recent example of leucobryns B and C also demonstrated that the specific rotation values can contain stereochemical information, which are either missing from or supplementary to the ECD data, and it can be utilized to determine stereochemical properties, which would not be feasible by using only ECD calculations.
Phenanthrenes are characteristic compounds of bryophytes.
The first derivative, 2-hydroxy-3,7-dimethoxyphenanthrene, was isolated fromMarchantia polymorphaby Asakawa et al.27 To date, about two dozen compounds belonging to phenanthrenes, 9,10-dihydrophenanthrenes, biphenanthrenes, and bisbibenzyl-phenanthrenes were isolated from different genera of bryophytes.1,28−36 Leucobryns (1−5) are the first representatives of dimeric phenathrenes with a 9,10-ortho- quinone structure. Monomeric 9,10-phenanthraquinones are extremely rare in nature: previously such compounds have only been isolated from some lichens,37bacteria,38−40and vascular plant species.41,42 9,10-Phenanthraquinones produced by microorganism have been reported to have strong antibiotic properties and antiviral activity.35,36
The possible biogenetic origin of phenanthraquinones is rarely discussed in the literature. Regarding their oxygenation patterns, acetate-derived polyketide biogenesis was suggested for some phenanthraquinones based on isotope feeding experiments.36,43,44On the other hand, phenanthrenes can be formed by intramolecular oxidativeortho-coupling of dihydro- Figure 6.Average SR values of (aS,12R,12′R)-2computed at various
wavelengths at four levels of theory (red: B3LYP/TZVP PCM/
acetone, blue: BH&HLYP/TZVP PCM/acetone, orange: CAM- B3LYP/TZVP PCM/acetone, purple: PBE0/TZVP PCM/acetone) with the TZVP basis set and PCM solvent model for acetone. Level of optimization: CAM-B3LYP/TZVP PCM/acetone.
Figure 7.Average SR values of (aR,12R,12′R)-3computed at various wavelengths at four levels of theory (red: B3LYP/TZVP PCM/
acetone, blue: BH&HLYP/TZVP PCM/acetone, orange: CAM- B3LYP/TZVP PCM/acetone, purple: PBE0/TZVP PCM/acetone) with the TZVP basis set and PCM solvent model for acetone. Level of optimization: CAM-B3LYP/TZVP PCM/acetone.
stilbenes (bibenzyls).45 In such cases the hydroxylation/
methoxylation pattern of at least one of the two aromatic rings in phenanthrene corresponds to the 3,5-disubstitution pattern of stilbenes. This structural feature is also characteristic of leucobryns. Considering that bibenzyls and bis-bibenzyls belong to the most important secondary metabolites of bryophytes, their biogenetic relationship with dimeric phenan- thraquinones can be accepted. The occurrence of bibenzyl− phenanthrene and bibenzyl−dihydrophenanthrene compounds in some bryophytes (Buzzania and Cavicularia species)24,25 provides further evidence for the presumption that leucobryns are biosynthesized by dimerization of bibenzyls with a C−C linkage, followed by oxidative steps yielding a 9,10-dioxo functionality. Similar to leucobryns1−5, certain bibenzyls are also substituted with prenyl or geranyl groups.1,2
The antiproliferative action of the isolated compounds (1− 5) was determined against four human cancer cell lines of gynecological origin, but only moderate (<10 μM) or negligible activities were measured (Table S6).
■
EXPERIMENTAL SECTIONGeneral Experimental Procedures.UV spectra were measured on a Shimadzu UV-1800 UV−vis spectrophotometer in MeOH. The NMR spectra were recorded in methanol-d4on a Bruker Avance DRX 500 spectrometer operating at 499.9 MHz for1H and 125.7 MHz for
13C and a Bruker Avance NEO 700 spectrometer operating at 700.25 MHz (1H) and 176.08 MHz (13C), respectively. All measurements were performed at 298 K. The signals of the methanol-d4(1H: 3.35 ppm,13C: 49.3 ppm) were taken as reference. 2D NMR data were acquired and processed with Bruker TopSpin 4.0.5 software. Standard pulse programs available in the Bruker library were used for 2D
1H−1H magnitude COSY (cosygpqf), gradient- and sensitivity- en ha nce d H SQ C (hsqcetgpsisp2.2) , m ag ni tu d e H MB C (hmbcgplpndqf), and EASY-ROESY (roesyadjsph) experiments. The high-resolution MS spectra were acquired on an FTHRMS-Orbitrap (Thermo-Finnigan) mass spectrometer equipped with an ESI ion source in positive ionization mode. HPLC was performed on a Waters 600 HPLC system (Waters Corporation, Milford, USA), equipped with a 2998 photodiode array detector and online degasser. ECD spectra were recorded on a JASCO J-810 spectropolarimeter. Solvents were distilled prior to use, and spectroscopic grade solvents were applied for spectroscopic measurements.
Plant Material. Paraleucobryum longifolium (Dicranaceae) was collected in Mátrafüred (Hungary) in June 2016. A voucher specimen (No. 883) has been deposited in the Herbarium of the Department of Pharmacognosy of University of Szeged, Szeged, Hungary. The plant material was dried at room temperature and chopped in a Retsch SM 100 chopper.
Extraction and Isolation. The plant material (4.0 kg) was extracted in a percolator with 75 L of MeOH at room temperature.
The extract was evaporated (331.1 g) and the residue was subjected to column chromatography on polyamide using MeOH−H2O mixtures (20%, 40%, 60%, 80%, 100%). Fractions obtained with 80% MeOH contained compounds with a violet-black color. The 80%
MeOH fraction was further separated by vacuum liquid chromatog- raphy (VLC) on normal-phase silica gel (particle size 45−63 μm) with a gradient system of CHCl3−MeOH (10:0, 9.6:0.4, 9.3:0.7, 9:1, 8:2, 7:3, and 0:1). This separation yielded 12 subfractions; among them subfractions 9−12 contained a MeOH-soluble, but a CHCl3- insoluble violet-black material, and subfraction 9 was chosen for further purification on NP-CC (silica gel, particle size 45−63 μm) using toluene−CHCl3−MeOH (4:12:3) as eluent. This chromatog- raphy afforded subfractions A−I; the violet-black material was concentrated in subfractions D, E, and F. Subfraction D was separated by reversed-phaseflash chromatography (FC) using a gradient system of MeCN−H2O mixtures (from 50% to 50% to 100% MeCN)], then by gelfiltration on Sephadex LH-20 eluted with MeOH, andfinally by
RP-HPLC on a Kinetex XB-18 column (100 A, 250×4.6 mm, 5μm, Phenomenex, Torrance, CA, USA) using a H2O−MeCN gradient system (0 min: H2O−acetonitrile 6:4, 1 min: 6:4, 10 min: 4:6, 11 min: 1:9, 12 min: 6:4, 17 min: 6:4) as eluent at aflow rate of 1.5 mL/
min. By this means leucobryn B (2) (0.8 mg,tR= 9.95 min) and leucobryn C (3) (0.65 mg, tR = 10.27 min) were separated.
Subfraction E was chromatographed on Sephadex LH-20 eluted with MeOH and further purified by RP-HPLC on a Kinetex XB-18 column. The detection was in the full UV wavelength range. Elution was carried out with the gradient system of H2O−MeCN (0 min:
H2O−MeCN 65:35, 1 min: 65:35, 10 min: 62:38, 12 min: 62:38, 13 min: 0:100, 13.5 min: 65:35, 18 min: 65:35) at aflow rate of 1.5 mL/
min, affording leucobryn E (5) (0.6 mg, tR = 14.42 min) and leucobryn D (4) (0.6 mg, tR = 14.96 min). Subfraction F was chromatographed on Sephadex LH-20 with MeOH, yielding the pure compound leucobryn A (1) (3.6 mg). The 60% MeOH fraction of the polyamide column was subjected to VLC on normal-phase silica gel (particle size 45−63μm) using a gradient system of cyclohexane− CHCl3−MeOH (90:9.9:0.1, 80:19.8:0.2, 70:29.7:0.3, 0:9:1, 0:8:2, 0:7:3, 0:6:4, 0:5:5, 0:4:6, 0:3:7, 0:2:8, and 0:0:1). The separation yielded subfractions A−R, and subfraction M was selected for further purification on RP-VLC with a gradient system of H2O−MeOH (6:4, 5:5, 4:6, 3:7, 2:8, and 0:1) and yielded subfractions 1−9. Subfraction 1 was purified by gelfiltration on Sephadex LH-20 with MeOH and by RP-HPLC on Kinetex C-18 (100 A, 150 × 4.6 mm, 5 μm, Phenomenex) using a H2O−isopropanol (IPA) gradient system (0 min: H2O−IPA 9:1, 1 min: 9:1, 10 min: 4:6, 11 min: 3:7, 12 min: 9:1, 18 min: 9:1) as eluent at aflow rate of 1 mL/min. This separation afforded diosmetin 7-O-[2,4-di-O-(α-L-rhamnopyranosyl)]-β-D-gluco- pyranoside (tR= 9.93 min). This compound was described previously from the bryophyteDicranum scopariumHedw.46
Leucobryn A (1):purple, amorphous solid; [α]23D+316 (c0.03, acetone); UVλmax(logε) 542.5 (3.40), 370 (3.55), 305 (4.14), 272 (4.50), 213.5 (4.64) nm; ECD (MeCN,λ[nm] (Δε), c 0.087 mM) 550 (+0.75), 441 (−0.33), 318sh (−0.67), 291 (−0.92), 248 (+1.53), 221sh (−0.25);1H NMR (700 MHz, methanol-d4) seeTable 1;13C NMR (175 MHz, methanol-d4) seeTable 2; HRESIMS (positive)m/
z 733.2252 [M + Na]+, calcd for 733.2255 C40H38O12Na, m/z 749.2002 [M + K]+, calcd for 749.1995 C40H38O12K.
Leucobryn B (2):purple, amorphous solid; [α]23D +162 (c0.07, acetone); ECD (MeCN,λ[nm] (Δε), c 0.066 mM) 547 (+4.36), 441 (−1.26), 316sh (−4.27), 289 (−8.01), 249 (+8.09), 218 (−4.43);1H NMR (700 MHz, methanol-d4) seeTable 1;13C NMR (175 MHz, methanol-d4) seeTable 2; HRESIMS (positive)m/z869.3505 [M + Na]+, calcd for 869.3507 C50H54O12Na, m/z 885.3249 [M + K]+, calcd for 885.3247 C50H54O12K.
Leucobryn C (3):purple, amorphous solid; [α]23D −222 (c0.08, acetone); ECD (MeCN,λ[nm] (Δε), c 0.044 mM) 540 (−2.99), 446 (+0.67), 313sh (+3.09), 291 (+4.66), 254 (−4.17), 247sh (−3.98), 216sh (+2.85); 1H NMR (700 MHz, methanol-d4) see Table 1;13C NMR (175 MHz, methanol-d4) seeTable 2; HRESIMS (positive) m/z 869.3507 [M + Na]+, calcd for 869.3507 C50H54O12Na, m/z 885.3258 [M + K]+, calcd for 885.3247 C50H54O12K.
Leucobryn D (4):purple, amorphous solid; [α]23D +160 (c0.07, acetone); ECD (MeCN,λ[nm] (Δε), c 0.064 mM) 577 (+6.09), 431 (−1.26), 314sh (−8.19), 295 (−11.52), 255sh (12.08), 248 (+13.19), 221sh (−1.11);1H NMR (700 MHz, methanol-d4) seeTable 1;13C NMR (175 MHz, methanol-d4) seeTable 2; HRESIMS (positive)m/
z 801.2874 [M + Na]+, calcd for 801.2881 C45H46O12Na, m/z 817.2624 [M + K]+, calcd for 817.2621 C45H46O12K.
Leucobryn E (5):purple, amorphous solid; [α]23D −357 (c0.03, acetone); ECD (MeCN,λ[nm] (Δε), c 0.065 mM) 575 (−4.77), 436 (+1.03), 317sh (+6.83), 297 (+9.56), 258sh (−8.63), 248 (−9.77), 220sh (+0.94); 1H NMR (700 MHz, methanol-d4) see Table 1;13C NMR (175 MHz, methanol-d4) seeTable 2; HRESIMS (positive) m/z 801.2876 [M + Na]+, calcd for 801.2881 C45H46O12Na, m/z 817.2617 [M + K]+, calcd for 817.2621 C45H46O12K.
Computational Section. Mixed torsional/low-frequency mode conformational searches were carried out by means of the MacroModel 10.8.011 software by using the MMFF with an implicit solvent model for CHCl3.47 Geometry reoptimizations were carried out first at the semiempirical AM1 level and then at the CAM- B3LYP/TZVP level with the PCM solvent model for both MeCN and acetone. Specific rotation data and single-point calculations for the sTDA ECD calculations were run with various functionals (B3LYP, BH&HLYP, CAM-B3LYP, and PBE0 for the SR and CAM-B3LYP, LC-BLYP, and ωB97X for the sTDA calculations) and the TZVP basis set as implemented in the Gaussian 09 package.48The sTDA calculations were performed with the sTDA 1.6 package.49Electronic circular dichroism spectra were generated as sums of Gaussians with 3000 cm−1 width at half-height, using dipole-velocity-computed rotational strength values.50Boltzmann distributions were estimated from the CAM-B3LYP/TZVP energies. The MOLEKEL software package was used for visualization of the results.51
■
ASSOCIATED CONTENT*sı Supporting Information
The Supporting Information is available free of charge at https://pubs.acs.org/doi/10.1021/acs.jnatprod.9b00655.
Low-energy conformers of (aS,12R,12′R)-2, 1D and 2D NMR and HRESIMS spectra of compounds 1−5, and table of NMR data of diosmetin 7-O-[2,4-di-O-(α-L- rhamnopyranosyl)]-β-D-glucopyranoside; tables of Boltzmann populations and specific optical rotations of the low-energy conformers of (aS,12R,12′R)-2 and (aR,12R,12′R)-3 computed at various levels for the CAM-B3LYP/TZVP PCM/acetone reoptimized AM1 conformers (PDF)
■
AUTHOR INFORMATION Corresponding AuthorsTibor Kurtán−Department of Organic Chemistry, University of Debrecen, H-4032 Debrecen, Hungary; orcid.org/0000- 0002-8831-8499; Email:kurtan.tibor@science.unideb.hu Judit Hohmann−Department of Pharmacognosy,
Interdisciplinary Excellence Centre and Interdisciplinary Centre of Natural Products, University of Szeged, H-6720 Szeged, Hungary; orcid.org/0000-0002-2887-6392;
Email:hohmann@pharm.u-szeged.hu Authors
DezsőCsupor−Department of Pharmacognosy,
Interdisciplinary Excellence Centre and Interdisciplinary Centre of Natural Products, University of Szeged, H-6720 Szeged, Hungary
Martin Vollár−Department of Pharmacognosy,
Interdisciplinary Excellence Centre, University of Szeged, H- 6720 Szeged, Hungary
Norbert Kúsz −Department of Pharmacognosy,
Interdisciplinary Excellence Centre, University of Szeged, H- 6720 Szeged, Hungary
Katalin E. Kövér−Department of Inorganic and Analytical Chemistry, University of Debrecen, H-4032 Debrecen, Hungary Attila Mándi−Department of Organic Chemistry, University of
Debrecen, H-4032 Debrecen, Hungary; orcid.org/0000- 0002-7867-7084
Péter Szűcs− Department of Botany and Plant Physiology, Institute of Biology, Eszterhazy Ká roly University, H-3300 Eger,́ Hungary
Marianna Marschall− Department of Botany and Plant Physiology, Institute of Biology, Eszterházy Károly University, H-3300 Eger, Hungary
Seyyed A. Senobar Tahaei−Department of
Pharmacodynamics and Biopharmacy, Interdisciplinary Excellence Centre, University of Szeged, H-6720 Szeged, Hungary
István Zupkó−Department of Pharmacodynamics and Biopharmacy, Interdisciplinary Excellence Centre, University of Szeged, H-6720 Szeged, Hungary
Complete contact information is available at:
https://pubs.acs.org/10.1021/acs.jnatprod.9b00655
Notes
The authors declare no competingfinancial interest.
■
ACKNOWLEDGMENTSFinancial support from the Economic Development and Innovation Operative Programme GINOP-2.3.2-15-2016- 00012 is gratefully acknowledged. Grant 20391-3/2018/
FEKUSTRAT awarded by the Ministry of Human Capacities, Hungary, is acknowledged. This work was supported by the National Research, Development and Innovation Fund (NKFI) under grant numbers K115796 and K120181, and NN 128368 (to K.E.K), and the János Bolyai Research Scholarship of the Hungarian Academy of Sciences. Procure- ment of the 700 MHz NMR spectrometer in Debrecen was supported by the EU and cofinanced by the European Regional Development Fund under the project GINOP-2.3.3-15-2016 00004. The Governmental Information-Technology Develop- ment Agency (KIFÜ) is acknowledged for CPU time.
■
(1) Asakawa, Y.; Ludwiczuk, A.; Nagashima, F.REFERENCES Phytochemistry2013, 91, 52−80.(2) Asakawa, Y.; Ludwiczuk, A.J. Nat. Prod.2018,81, 641−660.
(3) Asakawa, Y.Prog. Chem. Org. Nat. Prod.1982,42, 1−285.
(4) Asakawa, Y.Prog. Chem. Org. Nat. Prod.1995,65, 1−618.
(5) Asakawa, Y.; Ludwiczuk, A.; Nagashima, F.Prog. Chem. Org. Nat.
Prod.2013,95, 1−795.
(6) Glime, J. M. Medical Uses: Medical Conditions. Chapters 2−1.
InBryophyte Ecology, Vol 5; Glime, J. M., Ed.; Michigan Technological University and the International Association of Bryologists, 2017; pp 1−26.
(7)Flora of North America, Vol.27, pp 395, 426, 427, 428. [Online]
Available:http://www.efloras.org/florataxon.aspx?flora_id=1&taxon_
id=200001018.
(8) Gellerman, J. L.; Anderson, W. H.; Schlenk, H.Lipids1975,10, 656−661.
(9) (a) Grimme, S.J. Chem. Phys.2013,138, 244104. (b) Risthaus, T.; Hansen, A.; Grimme, S. Phys. Chem. Chem. Phys. 2014, 16, 14408−14419. (c) Bannwarth, S.; Grimme, C.Comput. Theor. Chem.
2014,1040−1041, 45−53. (d) Bannwarth, C.; Grimme, S. J. Phys.
Chem. A2015,119, 3653−3662.
(10) (a) Bara, R.; Zerfass, I.; Aly, A. H.; Goldbach−Gecke, H.;
Raghavan, V.; Sass, P.; Mándi, A.; Wray, V.; Polavarapu, P. L.;
Pretsch, A.; Lin, W.; Kurtán, T.; Debbab, A.; Broetz-Oesterhelt, H.;
Proksch, P.J. Med. Chem.2013,56, 3257−3272. (b) Rönsberg, D.;
Debbab, A.; Mándi, A.; Vasylyeva, V.; Böhler, P.; Stork, B.; Engelke, L.; Hamacher, A.; Sawadogo, R.; Diederich, M.; Wray, V.; Lin, W.;
Kassack, M. U.; Janiak, C.; Scheu, S.; Wesselborg, S.; Kurtán, T.; Aly, A. H.; Proksch, P.J. Org. Chem.2013,78, 12409−12425.
(11) (a) Li, X. L.; Kurtán, T.; Hu, J. C.; Mándi, A.; Li, J.; Li, X. W.;
Guo, Y. W.J. Agric. Food Chem.2017,65, 1550−1555. (b) Wu, G.;
Yu, G.; Kurtán, T.; Mándi, A.; Peng, J.; Mo, X.; Liu, M.; Li, H.; Sun, X.; Li, J.; Zhu, T.; Gu, Q.; Li, D.J. Nat. Prod.2015,78, 2691−2698.
(12) Zhang, Q.; Mándi, A.; Li, S.; Chen, Y.; Zhang, W.; Tian, X.;
Zhang, H.; Li, H.; Zhang, W.; Zhang, S.; Ju, J.; Kurtán, T.; Zhang, C.
Eur. J. Org. Chem.2012,2012, 5256−5262.
(13) Polavarapu, P. L.; Jeirath, N.; Kurtán, T.; Pescitelli, G.; Krohn, K.Chirality2009,21, E202−E207.
(14) Li, J.; Seupel, R.; Bruhn, T.; Feineis, D.; Kaiser, M.; Brun, R.;
Mudogo, V.; Awale, S.; Bringmann, G.J. Nat. Prod.2017,80, 2807−
2817.
(15) Bringmann, G.; Mortimer, A. J. P.; Keller, P. A.; Gresser, M. J.;
Garner, J.; Breuning, M.Angew. Chem., Int. Ed.2005,44, 5384−5427.
(16) Covington, C. L.; Junior, F. M. S.; Silva, J. H. S.; Kuster, R. M.;
de Amorim, M. B.; Polavarapu, P. L.J. Nat. Prod. 2016,79, 2530−
2537.
(17) Frank, M.; Hartmann, R.; Plenker, M.; Mándi, A.; Kurtán, T.;
özkaya, F. C.; Müller, W. E. G.; Kassack, M. U.; Hamacher, A.; Lin, W.; Liu, Z.; Proksch, P.J. Nat. Prod.2019,82, 2159−2166.
(18) Kicsák, M.; Mándi, A.; Varga, S.; Herczeg, M.; Batta, Gy.;
Bényei, A.; Borbás, A.; Herczegh, P. Org. Biomol. Chem. 2018,16, 393−401.
(19) Yanai, T.; Tew, D. P.; Handy, N. C.Chem. Phys. Lett.2004, 393, 51−57.
(20) Iikura, H.; Tsuneda, T.; Yanai, T.; Hirao, K.J. Chem. Phys.
2001,115, 3540−44.
(21) Chai, J.-D.; Head-Gordon, M. J. Chem. Phys. 2008, 128, 084106.
(22) (a) Polavarapu, P. L.Chirality2008,20, 664−672. (b) Sun, P.;
Yu, Q.; Li, J.; Riccio, R.; Lauro, G.; Bifulco, G.; Kurtán, T.; Mándi, A.;
Tang, H.; Li, T.-J.J. Nat. Prod.2016,79, 2552−2558.
(23) (a) Polavarapu, P. L.Chirality2006,18, 348−356. (b) Mándi, A.; Kurtán, T.Nat. Prod. Rep.2019,36, 889−918.
(24) Giorgio, E.; Viglione, R. G.; Zanasi, R.; Rosini, C.J. Am. Chem.
Soc.2004,126, 12968−12976.
(25) Sun, Y. Z.; Kurtán, T.; Mándi, A.; Tang, H.; Chou, Y.; Soong, K.; Su, L.; Sun, P.; Zhuang, C. L.; Zhang, W.J. Nat. Prod.2017,80, 2930−2940.
(26) Mazzeo, G.; Longhi, G.; Abbate, S.; Buonerba, F.; Ruzziconi, R.
Eur. J. Org. Chem.2014,2014, 7353−7363.
(27) Asakawa, Y.; Tori, M.; Takikawa, K.; Krishnamurty, H. G.; Kar, S. K.Phytochemistry1987,26, 1811−1816.
(28) Adam, P.; Becker, H.Phytochemistry1993,35, 139−143.
(29) So, M. L.; Chan, W. H.; Xia, P. F.; Cui, Y.Nat. Prod. Lett.2002, 16, 167−171.
(30) Asakawa, Y. Chemical Constituents of the Bryophytes. In Progress in the Chemistry of Organic Natural Products; Kinghorn, A. D.;
Falk, H.; Gibbons, S.; Kobayashi, J.; Asakawa, Y.; Liu, J.-K., Eds.;
Spinger: Vienna, 1995; Vol.65.
(31) Asakawa, Y.Phytochemistry2004,65, 623−669.
(32) Anton, H.; Kraut, L.; Mues, R.; Maria, I.; Morales, Z.
Phytochemistry1997,46, 1069−1075.
(33) Nagashima, F.; Momosaki, S.; Watanabe, Y.; Toyota, M.;
Huneck, S.; Asakawa, Y.Phytochemistry1996,41, 207−211.
(34) Flegel, M.; Adam, K. P.; Becker, H.Phytochemistry1999,52, 1633−1638.
(35) Martini, U.; Zapp, J.; Becker, H.Phytochemistry1998,47, 89− 96.
(36) Toyota, M.; Yoshida, T.; Kan, Y.; Asakawa, Y.Tetrahedron Lett.
1996,37, 4745−4748.
(37) Krivoshchekova, O. E.; Stepanenko, L. S.; Mishchenko, N. P.;
Denisenko, V. A.; Maksimov, O. B. Chem. Nat. Compd. 1983, 19, 270−274.
(38) Johnson, B. C.; Cohen, P.; Polonsky, J.; Lederer, E. Nature 1963,199, 285−286.
(39) Krone, B.; Hinrichs, A.; Zeeck, A.J. Antibiot.1981,34, 1538−
1543.
(40) Gould, S. J.; Melville, C. R.; Chen, J. Tetrahedron1997,53, 4561−4568.
(41) Majumder, P. L.; Sen, R. C.Phytochemistry1991,30, 2092−
2094.
(42) Zhang, C.; Li, L.; Xiao, Y. Q.; Li, W.; Yin, X. J.; Tian, G. F.;
Chen, D. D.; Wang, Y.Chin. Chem. Lett.2010,21, 816−817.
(43) Zylber, J.; Zissmann, E.; Polonsky, J.; Lederer, E.; Merrien, M.
A.Eur. J. Biochem.1969,10, 278−283.
(44) Sargent, M. V.; Smith, D. N.J. Chem. Soc. C1970, 329−331.
(45) Tóth, B.; Hohmann, J.; Vasas, A.J. Nat. Prod.2018,81, 661−
678.
(46) Österdahl, B. G.Acta Chem. Scand.1978,32, 714−716.
(47) MacroModel; Schrödinger, LLC, 2015, http://www.
schrodinger.com/MacroModel.
(48) Frisch, M. J.; Trucks, G. W.; Schlegel, H. B.; Scuseria, G. E.;
Robb, M. A.; Cheeseman, J. R.; Scalmani, V.; Barone, G.; Mennucci, B.; Petersson, G. A.; Nakatsuji, H.; Caricato, M.; Li, X.; Hratchian, H.
P.; Izmaylov, A. F.; Bloino, J.; Zheng, G.; Sonnenberg, J. L.; Hada, M.;
Ehara, M.; Toyota, K.; Fukuda, R.; Hasegawa, J.; Ishida, M.;
Nakajima, T.; Honda, Y.; Kitao, O.; Nakai, H.; Vreven, T.;
Montgomery, J. A., Jr.; Peralta, J. E.; Ogliaro, F.; Bearpark, M.;
Heyd, J. J.; Brothers, E.; Kudin, K. N.; Staroverov, V. N.; Kobayashi, R.; Normand, J.; Raghavachari, K.; Rendell, A.; Burant, J. C.; Iyengar, S. S.; Tomasi, J.; Cossi, M.; Rega, N.; Millam, J. M.; Klene, M.; Knox, J. E.; Cross, J. B.; Bakken, V.; Adamo, C.; Jaramillo, J.; Gomperts, R.;
Stratmann, R. E.; Yazyev, O.; Austin, A. J.; Cammi, R.; Pomelli, C.;
Ochterski, J. W.; Martin, R. L.; Morokuma, K.; Zakrzewski, V. G.;
Voth, G. A.; Salvador, P.; Dannenberg, J. J.; Dapprich, S.; Daniels, A.
D.; Farkas, Ö.; Foresman, J. B.; Ortiz, J. V.; Cioslowski, J.; Fox, D. J.
Gaussian 09(Revision E.01); Gaussian, Inc.: Wallingford, CT, 2013.
(49) Grimme, S.; Bannwarth, C.; Shushkov, P.; de Wergifosse, M.
sTDA - A Program Package to Calculate Excited States via a Simplified Tamm-Dancoff Approximation to TD-DFT Version 1.6; Mulliken Center for Theoretical Chemistry Institut für Physikalische und Theoretische Chemie der Universität Bonn: Bonn, Germany, 2018.
(50) Stephens, P. J.; Harada, N.Chirality2009,22, 229−233.
(51) Varetto, U. MOLEKEL 5.4; Swiss National Supercomputing Centre: Manno, Switzerland, 2009.