1
https://doi.org/10.7896/j.2010 Studies in Agricultural Economics 122 (2020) 1-12
Introduction
In the farming business it is crucial to understand the decision-making environment and behaviour of farm house- holds, particularly subsistence smallholders that are often exposed to various types of risk and uncertainties. Under- standing decisions such as the allocation of limited resources among a diverse production portfolio requires empirical evi- dence. Traditionally, Crop Diversification (CD) is regarded as a management strategy, particularly in the context of subsistence farming, where farmers choose the appropriate crop mix to reduce production risks and sustain their live- lihoods and income. Previous studies have established the economic value of CD as an alternative strategy that farm- ers utilise to enhance productivity and even improve and sustain their incomes (Joshi et al., 2007; Kurosaki, 2003;
Weinberger and Lumpkin, 2007). To respond effectively to changing market demand and altering consumption patterns, both farmers and agriculture policy makers require a solid empirical understanding of the production decision-making environment, farmers’ socio-economic characteristics and the behaviours that drive decisions regarding crop diversi- fication. This paper aims to explore farm households’ deci- sions with regard to the magnitude of crop diversification at the farm level in Afghanistan. It analyses the extent of diversity in crop production, and the empirical relationship between CD and household socio-economic, demographic, farm, and farmer characteristics with a key focus on house- hold off-farm income.
Heterogeneity in farmer crop portfolios under a given set of socio-economic circumstances is an important empirical discussion. Even in the presence of high-return alternatives both on- and off-farm, a large number of farm households still engage in producing low yield food commodities (mainly staple food grains), and crop portfolio choices vary greatly among similar households (Stoeffler, 2016). Hence, farmer’s knowledge, technical know-how, and production
management practices have critical implications for their income and costs. This implies that without additional costs, there is a great potential for farm households to improve their productivity and income simply by adding high value crops to their production agenda. In addition, markets for particular commodities are imperfect and often fail to facili- tate the efficient trade of farm produce, forcing farmers to adjust their production decisions to compensate for losses due to the presence of such market risks. These decisions often involve opting for crop or enterprise diversification to a lesser or greater extent.
Since emerging out of conflict and the establishment of a market-led economy in 2001, Afghanistan’s agricultural economy has undergone a drastic policy change, which has created opportunities but also posed risks and uncertainties.
The primary emphasis of Afghanistan’s National Develop- ment Framework (ANDF) 2009 is to increase productiv- ity so as to attain food self-sufficiency and increase farm incomes at national, regional, and household levels. With increased international aid being pledged, Afghanistan’s economy grew at a steady rate of 9.4% during 2003-2012 with a significant contribution (about 25%) coming from the agriculture sector (World Bank, 2014). Economic growth has been accompanied by changes in agriculture production and consumption patterns, whilst other economic sectors (e.g. services and manufacturing industries) have been revi- talised. With the revitalisation of other sectors and improved levels of education, farm households may have had the opportunity to diversify into off-farm activities. This high- lights the importance of understanding the household deci- sions about labour and resource allocation between on- and off-farm activities.
Current studies on production efficiency find evidence of a positive relationship between crop diversification and pro- duction efficiency in Afghanistan (Ahmadzai, 2017; Tavva et al., 2017). Broader research also confirms that CD signifi- cantly improves farm level efficiency in other countries with Hayatullah AHMADZAI*
How is Off-farm Income Linked to On-farm Diversification?
Evidence from Afghanistan
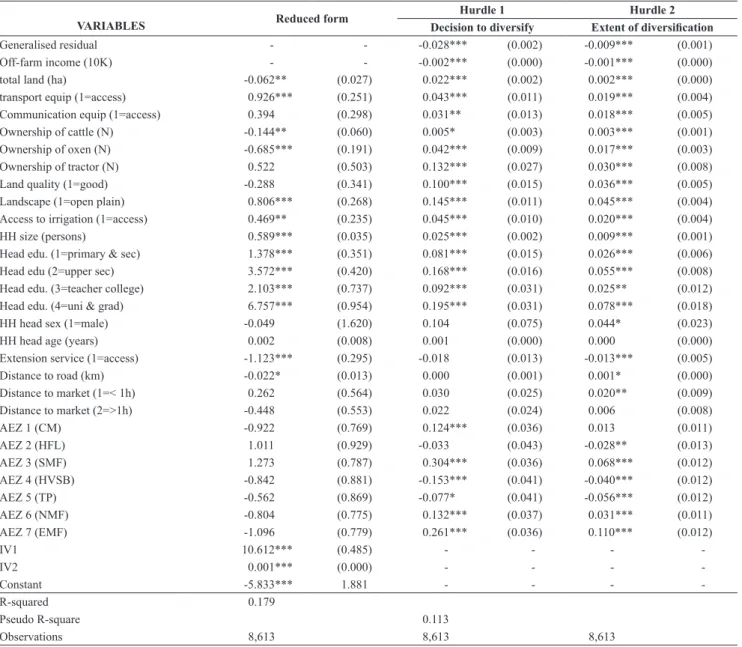
The analysis in this paper estimates micro-economic drivers of diversity in crop production in Afghanistan with particular emphasis on the implications of household access to non-farm income. Descriptive analysis shows that a third of farmers do not diversify, while the majority of those that do, grow only two or three crops. Econometric analysis reveals that while landholding size, farm characteristics and assets, and proximity to markets significantly increase diversification, a significantly lower degree of diversification is found for households with higher non-farm income. This is consistent with the hypothesis that allocation of farm labour away from non-farm activities decreases diversity due to negative labour effects, perhaps because the opportunity cost of farm labour is higher than rural wages. Identification through instrumental variables confirms endoge- neity in off-farm income, revealing that unobserved factors such as risk-aversion behaviour and relative efficiency may drive household decisions to diversify into both non-farm activity and crop mixing.
Keywords: Off-farm Income, Diversification, Crop Production, Cragg’s Type Double Hurdle Models, Afghanistan JEL classifications: Q12, Q18
* External Research Fellow, Centre for Research in Economic Development and International Trade (CREDIT), School of Economics, University of Nottingham, Nottingham, UK NG7 2RD. E-mail: hayatullah.ahmadzai1@nottingham.ac.uk
Received: 2 February 2020, Revised: 13 March 2020, Accepted: 15 March 2020.
Hayatullah Ahmadzai
2
a similar socioeconomic context (Coelli and Fleming, 2004;
Ogundari, 2013; Rahman, 2009). However, Afghanistan’s agriculture sector is still highly dominated by production of staple food grains (mainly wheat), leaving production sys- tems highly undiversified. In addition, the decrease in farm income among rice/wheat producers in Afghanistan due to declining productivity has triggered a change toward farm diversification, especially a shift in production from staple food crops to higher value commodities (Oushy, 2010).
Empirical evidence suggests that grain-based production systems may not continue to contribute as significantly in countries with a policy focus on raising incomes and pro- duction of high value market crops, generating employment opportunities, and alleviating poverty (Joshi et al., 2007).
This therefore calls for a transformation in agriculture sys- tems to diversify towards high value crops such as vegeta- bles and fruits.
Concept and Measures of Crop Diversification
There are two common and complementary approaches to crop diversification in agriculture, namely horizontal and vertical diversification. Horizontal diversification as a pri- mary approach to crop diversification, takes place through crop intensification by adding new crops to existing pro- duction line or cropping systems. Vertical diversification involves value-added activities such as processing, branding, packaging, and other post-harvest activities to enhance the marketability of farm product. In the context of this study, diversification is defined as a shift in production portfolio away from mono-cropping to adopting a multiple cropping system.
The most common method to measure the extent of crop diversification is the calculation of a vector of income/rev- enue shares related to different income sources. While this approach puts diversification and income changes directly into the relationship, a relevant part of information related to different aspects of diversification is neglected such as the actual number of crops grown (Asfaw et al., 2018; Barrett and Reardon, 2000). The diversity methods that measure crop or species richness are usually used in the ecological research to capture spatial biodiversity of crops and the rich- ness of genetic resources. Count measures provide a general level of overall diversity on a farm, but do not account for whether the farm is growing high value cash crops or staple crops and the percentage of resources allocated among dif- ferent crops (Turner, 2014).
Given the objective of this study, Composite Entropy Index (CEI) was selected as a primary measure for crop diversification. In addition to revenue shares of individual crops, CEI gives due weighting to the total number of crops grown by the farm household. This is important as the rev- enue share captures the relative importance of crops based on their economic value which may largely vary depending on the type of crops (i.e. the value of the index will be higher for households that grow high value crops). Thus, the CEI index is sensitive to the changes in the number of crops and
their respective revenues. While the CEI index possesses all the desirable properties of Entropy and Modified Entropy Indices, it is adjusted by the number of crops. The CEI can be calculated as:
, , , , ( , , )
( ) ( )
( )
( , , , )
( )
( )
( , , )
( , , , , ) ( , , , , , , )
log ln ln
max
max
D P P N
N P P N P
C C L X A U C C l
p Q C C Q Y
p C w L L Q f L X A
T L L
Y y L
h V C C l
h h A Y
D D A L Y
I X
y gr I X v
y gr I X
y if y
if y and
y if otherwise y if y and y
1 1
0 0
1 0
0
0 0
* * *
*
*
*
*
*
* *
i n N n
n N
n n
N
n n
f nf f nf hh
f f f f f
nf
nf nf f nf
f f f
f nf
nf nf nf
f nf hh
nf hh f m
nf hh f nf m
i i i i i
i i i i i i
i i i i i i
i 1
1
1
2
1
1 1
2
2 2 1
2
2 2
;
;
;
;
;
# a
a a
a cr b f
a d i b
a d i b f
U U
U
U
U
U U U U U U U
=- - =
= -
- - + =
= + +
=
= +
=
=
=
= + + +
= + + + +
= + + + +
=
=
=
=
;
6 6
:
: D
E D
@
@
( (
2
2 Z
Z
/
/
, (1)Where Di represents CEI, Pn is the share of revenue from the nth crop (for n = 1, 2, …, N) grown by the ith farmer, and is the number of total crops grown in a given year. The computed value of the index increases with level of diversifi- cation ranging from 0 implying no diversification (i.e. mono- cropping) to 1 implying the highest level of CD.
Theoretical Framework and the Agriculture Household Model
Farm household decisions pertaining to crop choices and the extent of diversification can be best understood in the context of the standard farm household model initially developed by Singh et al. (1986) which assumes farm households are both consumers and producers of agricul- tural goods operating under a number of constraints. Previ- ous studies adopted this approach to explore the decision of farm households with regard to the intensity of farm or crop diversification (Hitayezu et al., 2016; Cavatassi et al., 2012;
Benin et al., 2004; Van Dusen and Taylor, 2005).
Proceeding according to the household model, we may consider an agricultural household that maximises utility over a set of consumption goods produced on the farm (Cf), a set of purchased non-farm commodities (Xnf), and leisure (l). The expected utility gained from various combinations and levels of consumption goods directly depends on the vector of pref- erences of the household, denoted by
, , , , ( , , )
( ) ( )
( )
( , , , )
( )
( )
( , , )
( , , , , ) ( , , , , , , )
log ln ln
max
max
D P P N
N P P N P
C C L X A U C C l
p Q C C Q Y
p C w L L Q f L X A
T L L
Y y L
h V C C l
h h A Y
D D A L Y
I X
y gr I X v
y gr I X
y if y
if y and
y if otherwise y if y and y
1 1
0 0
1 0
0
0 0
* * *
*
*
*
*
*
* *
i n N n
n N
n n
N
n n
f nf f nf hh
f f f f f
nf
nf nf f nf
f f f
f nf
nf nf nf
f nf hh
nf hh f m
nf hh f nf m
i i i i i
i i i i i i
i i i i i i
i 1
1
1
2
1 1
1
2
2 2 1
2
2 2
;
;
;
;
;
# a
a a
a cr b f
a d i b
a d i b f
U U
U
U
U
U U U U U U U
=- - =
= -
- - + =
= + +
=
= +
=
=
=
= + + +
= + + + +
= + + + +
=
=
=
=
;
6 6
:
: D
E D
@
@
( (
2
2 Z
Z
/ /
, shaped by house- hold socio-economic, cultural, and other exogenous factors.
This maximisation problem can be written as:
, , , , ( , , )
( ) ( )
( )
( , , , )
( )
( )
( , , )
( , , , , ) ( , , , , , , )
log ln ln
max
max
D P P N
N P P N P
C C L X A U C C l
p Q C C Q Y
p C w L L Q f L X A
T L L
Y y L
h V C C l
h h A Y
D D A L Y
I X
y gr I X v
y gr I X
y if y
if y and
y if otherwise y if y and y
1 1
0 0
1 0
0
0 0
* * *
*
*
*
*
*
* *
i n N n
n N
n n
N
n n
f nf f nf hh
f f f f f
nf
nf nf f nf
f f f
f nf
nf nf nf
f nf hh
nf hh f m
nf hh f nf m
i i i i i
i i i i i i
i i i i i i
i 1
1
1
2
1
1 1
2
2 2 1
2
2 2
;
;
;
;
;
# a
a a
a cr b f
a d i b
a d i b f
U U
U
U
U
U U U U U U U
=- - =
= -
- - + =
= + +
=
= +
=
=
=
= + + +
= + + + +
= + + + +
=
=
=
=
;
6 6
:
: D
E D
@
@
( (
2
2 Z
Z
/ /
, (2)
Subject to the constraints facing the household:
, , , , ( , , )
( ) ( )
( )
( , , , )
( )
( )
( , , )
( , , , , ) ( , , , , , , )
log ln ln
max
max
D P P N
N P P N P
C C L X A U C C l
p Q C C Q Y
p C w L L Q f L X A
T L L
Y y L
h V C C l
h h A Y
D D A L Y
I X
y gr I X v
y gr I X
y if y
if y and
y if otherwise y if y and y
1 1
0 0
1 0
0
0 0
* * *
*
*
*
*
*
* *
i n N n
n N
n n
N
n n
f nf f nf hh
f f f f f
nf
nf nf f nf
f f f
f nf
nf nf nf
f nf hh
nf hh f m
nf hh f nf m
i i i i i
i i i i i i
i i i i i i
i 1
1
1
2
1
1 1
2
2 2 1
2
2 2
;
;
;
;
;
# a
a a
a cr b f
a d i b
a d i b f
U U
U
U
U
U U U U U U U
=- - =
= -
- - + =
= + +
=
= +
=
=
=
= + + +
= + + + +
= + + + +
=
=
=
=
;
6 6
:
: D
E D
@
@
( (
2
2 Z
Z
/ /
, (3)
, , , , ( , , )
( ) ( )
( )
( , , , )
( )
( )
( , , )
( , , , , ) ( , , , , , , )
log ln ln
max
max
D P P N
N P P N P
C C L X A U C C l
p Q C C Q Y
p C w L L Q f L X A
T L L
Y y L
h V C C l
h h A Y
D D A L Y
I X
y gr I X v
y gr I X
y if y
if y and
y y if y if otherwise and y 1 1
0 0
1 0
0 0 0
* * *
*
*
*
*
*
* *
i n N n
n N
n n
N
n n
f nf f nf hh
f f f f f
nf
nf nf f nf
f f f
f nf
nf nf nf
f nf hh
nf hh f m
nf hh f nf m
i i i i i
i i i i i i
i i i i i i
i 1
1
1
2
1
1 1
2
2 2 1
2
2 2
;
;
;
;
;
# a
a a
a cr b f
a d i b
a d i b f
U U
U
U
U
U U U U U U U
=- - =
= -
- - + =
= + +
=
= +
=
=
=
= + + +
= + + + +
= + + + +
=
=
=
=
;
6 6
:
: D
E D
@
@
( (
2
2 Z
Z
/ /
, (4)
, , , , ( , , )
( ) ( )
( )
( , , , )
( )
( )
( , , )
( , , , , ) ( , , , , , , )
log ln ln
max
max
D P P N
N P P N P
C C L X A U C C l
p Q C C Q Y
p C w L L Q f L X A
T L L
Y y L
h V C C l
h h A Y
D D A L Y
I X
y gr I X v
y gr I X
y if y
if y and
y if otherwise y if y and y
1 1
0 0
1 0
0
0 0
* * *
*
*
*
*
*
* *
i n N n
n N
n n
N
n n
f nf f nf hh
f f f f f
nf
nf nf f nf
f f f
f nf
nf nf nf
f nf hh
nf hh f m
nf hh f nf m
i i i i i
i i i i i i
i i i i i i
i 1
1
1
2
1 1
1
2
2 2 1
2
2 2
;
;
;
;
;
# a
a a
a cr b f
a d i b
a d i b f
U U
U
U
U
U U U U U U U
=- - =
= -
- - + =
= + +
=
= +
=
=
=
= + + +
= + + + +
= + + + +
=
=
=
=
;
6 6
:
: D
E D
@
@
( (
2
2 Z
Z
/ /
, (5)
, , , , ( , , )
( ) ( )
( )
( , , , )
( )
( )
( , , )
( , , , , ) ( , , , , , , )
log ln ln
max
max
D P P N
N P P N P
C C L X A U C C l
p Q C C Q Y
p C w L L Q f L X A
T L L
Y y L
h V C C l
h h A Y
D D A L Y
I X
y gr I X v
y gr I X
y if y
if y and
y y if y if otherwise and y 1 1
0 0
1 0
0 0 0
* * *
*
*
*
*
*
* *
i n N n
n N
n n
N
n n
f nf f nf hh
f f f f f
nf
nf nf f nf
f f f
f nf
nf nf nf
f nf hh
nf hh f m
nf hh f nf m
i i i i i
i i i i i i
i i i i i i
i 1
1
1
2
1
1 1
2
2 2 1
2
2 2
;
;
;
;
;
# a
a a
a cr b f
a d i b
a d i b f
U U
U
U
U
U U U U U U U
=- - =
= -
- - + =
= + +
=
= +
=
=
=
= + + +
= + + + +
= + + + +
=
=
=
=
;
6 6
:
: D
E D
@
@
( (
2
2 Z
Z
/ /
, (6)
The utility is constrained by the general budget constraint (Equation 3) such that the maximum expenditures of time