Lisbon, Portugal, July 24-27, 2018
LOCAL BUCKLING RESISTANCE OF WELDED BOX SECTION COLUMNS
B. Kövesdi*, B. Somodi* and T. Hornyák*
* Budapest University of Technology and Economics, Department of Structural Engineering e-mails: kovesdi.balazs@epito.bme.hu, somodi.balazs@epito.bme.hu
Keywords: Welded box section, High strength steel, Stability, Local buckling.
Abstract. The accurate consideration of the local (plate) buckling resistance and the determination of the effective width is highly important in the design of civil engineering structures. The current effective width calculation method provided by the EN 1993-1-5 is mainly developed for I-sections loaded by bending moment. Several previous studies proved that the current design rules can overestimate the plate buckling resistance especially in case of square box sections loaded by compression. The purpose of the current study is (1) to investigate the local buckling resistance of welded square box section columns loaded by pure compression and pure bending moment and (2) to investigate the applicability of the Winter curve for these worst cases. Another aim of the current study is to investigate the differences between NSS (S235 – S355) and HSS (S500 – S960) on the local buckling resistance. A numerical and experimental research program is conducted to investigate the residual stresses, geometric imperfections and local buckling resistance of welded square box section stub-columns. The obtained results are valid for steel grades between S235 – S960.
1 INTRODUCTION
High strength steel (HSS – S420 and higher steel grades) structures are increasingly used in the field of structural engineering due to its favorable properties compared to the normal strength steel (NSS) structures such as economic design, material saving, possibility of creation of lighter and more aesthetic structures. Due to the higher yield strength slender sections can be used, therefore the stability behavior of HSS structures is highly important. The application range of the current EN 1993 is limited for steel grades up to S460. The EN 1993-1-12 [1] gives design rules for materials up to steel grades of S700, however, there are no differences in the calculation method of the local buckling resistance of NSS and HSS columns. Previous researches show that the necessary safety level of the Eurocode is not reached in some cases even for NSS structures by using the Winter-curve based formula of the EN 1993-1-5 [2] for the calculation of the local buckling resistance.
The aim of the current research is to obtain a local buckling curve that satisfies the safety requirements of the Eurocode. In the current research program buckling curves are derived for different loading cases (pure compression and pure bending), for several steel grades (S235 - S960) for welded square box sections, which is the most unfavorable case from the local buckling point of view. The applicable buckling curves are calculated based on GMNIA analysis using a verified numerical model by applying a deterministic analysis. The buckling curves are determined following two different concepts and the results are discussed. The first concept is to execute deterministic parametric calculations using equivalent geometric imperfection according to the Eurocode. The second concept is to execute deterministic parametric calculations taken into consideration the realistic residual stresses and geometric
grades and cross-section geometries. Deterministic numerical research program is carried out for welded HSS box section columns in order to determine the requested reduction factor and to evaluate the applicability of the Winter curve. The numerical model and the input variables are validated and determined based on laboratory tests and measurements. The objectives of the research program are achieved by the following research strategy:
1. literature review on the local buckling behaviour of welded box section columns, 2. laboratory measurements to determine the residual stress distribution and
imperfections of the analysed sections,
3. numerical model development and verification,
4. deterministic numerical parametric study using equivalent geometric imperfections,
5. deterministic numerical parametric study using measured/realistic residual stresses and imperfections,
6. comparison of the results to the buckling curve of the EN 1993-1-5.
2 LITERATURE REVIEW
2.1 Local buckling resistance according to EN 1993-1-5
The calculation of the local buckling resistance in the EN1993-1-5 [2] is based on the effective width method derived by Tódor Kármán et al. in 1932 [3]. George Winter semi- empirically improved this method and developed the Winter curve in 1947 [4] formulated by Eq. 1. The basis of the new formula was his own experiments supplemented by the experimental results of Sechler and Donnel [3].
b𝑒𝑓𝑓 𝑏 = 𝜆̅1
𝑝∙ (1 −0.30𝜆̅
𝑝) (1)
In 1968 Winter modified the 0.3 constant to 0.22 based on experiments made on cold-formed sections loaded by bending moment. There are two reasons of the modifications, (i) the cold- forming results in more advantages condition at the corners than the welding, and (ii) the bending results in better support conditions than the pure compression due to the supporting effect of the connecting plate. This modified formula (Eq. 2) is currently applied in the EN1993- 1-5 [2].
𝜌 =b𝑒𝑓𝑓𝑏 = 𝜆̅1
𝑝∙ (1 −0.22𝜆̅
𝑝) , 𝜆̅𝑝 ≥ 0.673 (2)
Later, researchers proposed formulas to the calculation of the effective width. Eq. 3 is proposed by Gerard in 1957 and Eq. 4 is proposed by Faulkner in 1965 [5].
𝜌 =b𝑒𝑓𝑓𝑏 = 1.05𝜆̅
𝑝 ∙ (1 −0.26𝜆̅
𝑝 ) , 𝜆̅𝑝 ≥ 0.55 (3)
𝜌 =b𝑒𝑓𝑓𝑏 = 𝜆̅0.82
𝑝0.85 (4)
In the EN1993-1-5 [2] the Eq. 2. is slightly modified (introducing the factor) in order to be applicable to different loading situations, however the formula in the Eurocode gives back Eq. 2 in case of pure compression. The appropriateness of the Winter curve was questioned by several researches in the past. In 1987 Scheer [6] compared the Winter curve to several experimental results and concluded that Winter curve provides approximately the mean of the
experimental resistances. Therefore, numerous experimental test results provided lower resistances than the resistance proposed by the Winter curve.
2.2 Local buckling resistance of welded box sections
In 1967 Nishino [7] et al. examined the connection between the local buckling resistance and the residual stress of welded box section. Their experiments were carried out on specimens made of ASTM A7 (fy=250 MPa) and ASTM A514 (fy=690 MPa) material grades. The experimental resistances proved to be lower than the resistance proposed by the Winter curve [5]. In 1992 Rasmussen and Hancock [8] experimentally studied the local buckling resistance of welded box, I, and cruciform sections and compared to the Australian, American, British and European standards. In 1998 Bridge and O’Shea [9] tested welded box sections with and without concrete infill. Their test resistances also proved to be lower than the resistance level of the Winter curve. The local imperfection and the residual stress of their test specimens were measured, these data were used by Pircher et al in. 2002 [10] to develop a numerical model and examine the local buckling behavior numerically. The numerical and experimental results showed good agreement with each other. In the last few years several researches investigated the local buckling resistance of welded box section. Shi et al. [11] examined the local buckling behavior of welded box and I-sections made of S460 steel grade in 2014. In 2016 Shi et al. [12]
extended the experimental results by numerical calculations to different (NSS and HSS) material grades. Based on their results a new formula was proposed. Schillo et al. [13] [14]
executed 34 experimental local buckling tests on high strength steel welded box sections. The imperfection shape of the specimens was also measured. Their results were compared by the Winter curve, which showed that several test specimens have lower resistance than the resistance level of the Winter curve.
2.3 Research strategy
The international literature shows that several experimental or numerical results provide local buckling resistances below the Winter curve. Therefore, it can be concluded that the Winter curve is not always on the safe side for NSS and also for HSS structures. Therefore, the actual procedure in the Eurocode to determine the local buckling resistance of inner plates of box section loaded by pure compression should be studied further and evaluated.
In the present study a numerical model is developed to examine the local buckling resistance of welded box sections under pure compression and pure bending. Several material grades from S235 to S960 are examined to provide results for NSS and HSS structures as well. Two different analysis type are taken into consideration to provide numerical resistances:
analysis based on the EN 1993-1-5 [2] using equivalent geometric imperfections.
analysis based on realistic numerical experiments included the realistic residual stress distribution and geometric imperfections coming from manufacturing.
The resistance level of the two different analysis type is compared. The evaluation is made separately for pure compression and for pure bending. Finally, the different resistance level of the two loading situations are also compared and evaluated.
3 NUMERICAL MODEL DEVELOPMENT AND VERIFICATION 3.1 Numerical model development
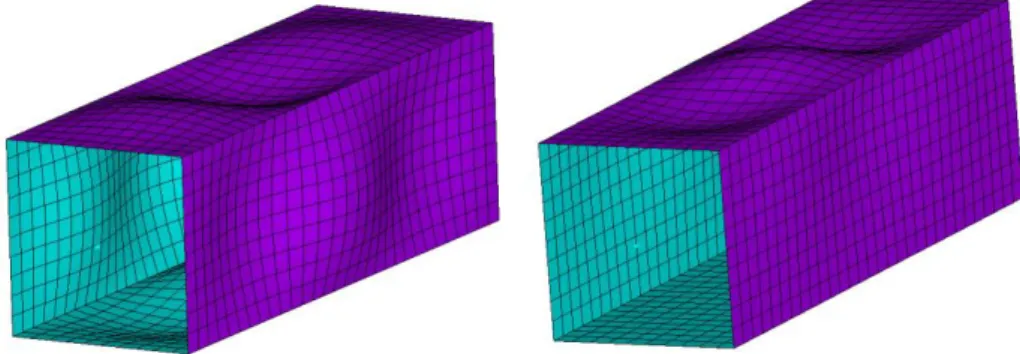
A numerical model is developed using ANSYS 16.2 [15] to examine the local buckling behavior of welded box columns and to determine their local buckling resistance. The numerical model is a full shell model, using four-node quadrilateral thin shell elements, see Figure 1. The buckling resistance is determined by geometrical and material nonlinear (GMNI) analysis, implementing the initial geometrical local imperfections and residual stresses coming from the welding process. The analysis is executed using the Newton-Raphson iteration process. Two different loading situations are applied in the study. In case of pure compression, the loading is applied through displacement-control at the center of one of the end cross-section. In case of pure bending, force-controlled loading is applied by concentrated bending moments at the end cross-sections. The applied mesh size is chosen to one-tenth of the cross-section width, that is validated by convergence study. Stiff diaphragm is generated at the end-cross sections. The length of the element is 50 mm plus three times the width of the cross-section, therefore, the length is small enough to avoid flexural buckling.
Figure 1: Applied numerical model and meshing.
The local imperfection shape is generated using linear buckling analysis (LBA). The first eigenshape is considered as the local imperfection shape, which contained always three sinus half-waves, as presented in Figure 2. The amplitude of the imperfection shape is specified in Section 4.1. The applied residual stress distribution is shown at Figure 3. The compressive and tensile residual stress values are calculated based on the residual stress model of Somodi and Kövesdi [16].
Figure 2: Scaled local imperfection shape for compression (left) and bending (right).
Figure 3: Applied residual stress pattern.
3.2 Model validation
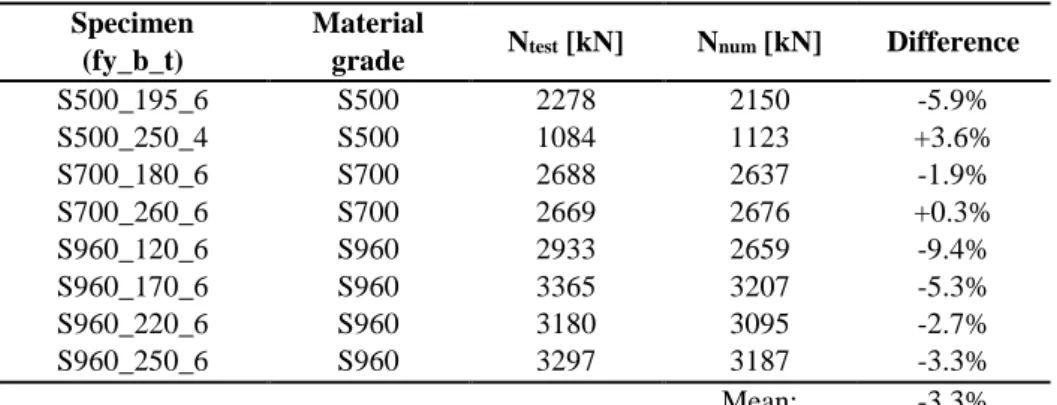
The model validation is executed based on the experimental results of Schillo and Feldmann [13]. A total of 34 HSS (S500MC, S700MC and S960MC) stub columns specimens were tested.
The length of the test specimens was the same as used in the numerical simulations (L = 3b + 50 mm). The model validation is executed for all three material grades using the real material behavior measured by coupon tests. The comparison of the experimental and numerical resistances presented in Table 1 which shows a good agreement with an average difference of 3.3%.
Figure 4 compares the force-displacement diagrams of the experiments and numerical simulations. It can be observed that the numerical model provided the same behavior that was experienced by the tests. The model validation proved that the developed model can follow the real structural behavior of local buckling of welded box sections and it can provide reliable resistance values.
Table 1: Comparison of experimental and numerical resistances.
Specimen (fy_b_t)
Material
grade Ntest [kN] Nnum [kN] Difference
S500_195_6 S500 2278 2150 -5.9%
S500_250_4 S500 1084 1123 +3.6%
S700_180_6 S700 2688 2637 -1.9%
S700_260_6 S700 2669 2676 +0.3%
S960_120_6 S960 2933 2659 -9.4%
S960_170_6 S960 3365 3207 -5.3%
S960_220_6 S960 3180 3095 -2.7%
S960_250_6 S960 3297 3187 -3.3%
Mean: -3.3%
Figure 4: Numerical and experimental load-displacement diagrams.
3.3 Measurement of the input parameters
For the numerical simulations residual stresses and local geometric imperfections are applied in the numerical model. For residual stresses of welded box sections Somodi and Kövesdi [16]
developed a residual stress model validated for NSS and HSS sections as well. This residual stress model is used in the present study as a realistic residual stress pattern. In order to specify the realistic local imperfection (e) of welded box sections that can be used in the numerical model, experimental measurements are carried out using a moving displacement transducer.
The experimental layout is shown in Figure 5.
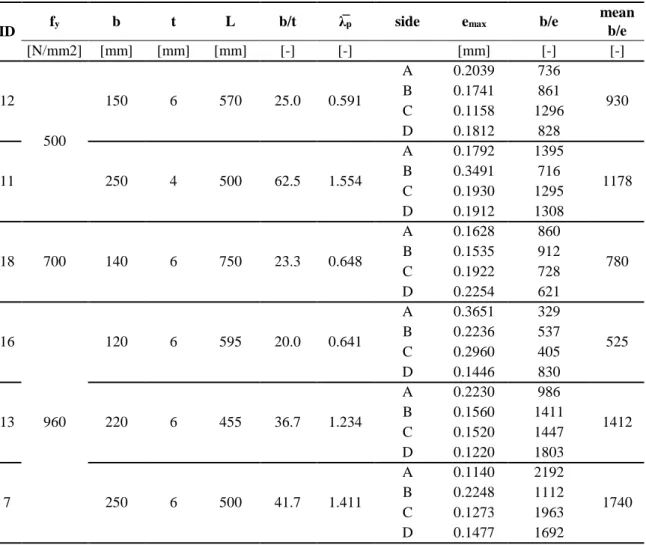
The imperfection shape is recorded on each sides in seven lines for the wider specimens and in five lines for the narrower specimens. This means 288 measuring lines on the measured 6 specimens. The exact shape of each measuring line is measured using 50 Hz recording frequency which resulted in more than 1000 data for every line. The global shape of the specimens is filtered out of the measured data using the following procedure. The average of the two measured data rows at the measuring lines next to the edges are considered as the global shape of the element. This shape is extracted from the other three (for narrow specimens) or five (for wide specimens) measured data rows on the same side. The maximum amplitude for each side based on these modified data are calculated. The average of the maximum amplitudes of each sides are considered as the final result for one specimen. The results of this evaluation process are presented in Table 2. The average local imperfection amplitude for the examined
six specimens is b/1094. This is considerably lower than b/250, which is the manufacturing tolerance in the EN 1090-2 § D.2.4 [17]. Figure 6 represents the final imperfection values for the six measured specimens. The results show that the local imperfection – cross section width ratio (e/b) depends on the b/t ratio if it is lower than 35. The measured values are approximated by a linear trend (Eq. 5) if b/t < 35 and by a constant value (Eq. 6) if b/t > 35. These equations are used to predict the realistic local imperfection amplitudes in the numerical simulations.
Figure 5: Experimental layout to measure the local imperfection.
If b/t ≤ 35: 𝑒
⁄ =𝑏 −0.0513 ∙
𝑏
𝑡 + 2.6131
1000 (5)
If b/t ≥ 35: 𝑒
⁄ = 𝑏 0.81761000 (6)
Figure 6: Measured local imperfection for the six examined specimens and fitted model.
Table 2: Local imperfection measurement results.
ID fy b t L b/t λ̅p side emax b/e mean
b/e
[N/mm2] [mm] [mm] [mm] [-] [-] [mm] [-] [-]
12
500
150 6 570 25.0 0.591
A 0.2039 736
B 0.1741 861 930
C 0.1158 1296
D 0.1812 828
11 250 4 500 62.5 1.554
A 0.1792 1395
1178
B 0.3491 716
C 0.1930 1295
D 0.1912 1308
18 700 140 6 750 23.3 0.648
A 0.1628 860
B 0.1535 912 780
C 0.1922 728
D 0.2254 621
16
960
120 6 595 20.0 0.641
A 0.3651 329
B 0.2236 537 525
C 0.2960 405
D 0.1446 830
13 220 6 455 36.7 1.234
A 0.2230 986
1412
B 0.1560 1411
C 0.1520 1447
D 0.1220 1803
7 250 6 500 41.7 1.411
A 0.1140 2192
1740
B 0.2248 1112
C 0.1273 1963
D 0.1477 1692
Mean: 1094
4 RESULTS OF THE DETERMINISTIC NUMERICAL ANALYSIS 4.1 Research strategy
The goal of the current deterministic numerical analysis is to obtain the local buckling resistance of the analysed welded box sections, and to compare the numerical resistances to the Winter-curve. Moreover, the clarification of different behaviour between NSS and HSS elements is an another task. The numerical results are generated for four different plate thicknesses (4, 8, 12 and 16 mm) and for five different steel grades (S235, S355, S500, S700, S960) in the local slenderness region between 0,4 < < 2,0. Two different analysis types are applied:
analysis type 1 – application of equivalent geometric imperfection according to EN 1993-1-5 [2] (b/200) and no residual stress.
analysis type 2 – application of realistic geometric imperfection based on imperfection measurements (see Section 3.3.) and realistic residual stresses based on residual stress model of Somodi and Kövesdi [16].
4.2 Results for compression
First, the case of pure compression is examined. In this case the reduction factor is calculated by Eq. (7) in function of the numerical compression resistances (NFEM), the nominal cross-sectional area (Anom) and the nominal yield strength (fy). It is considered that for the calculation of the buckling resistance, the reduction factor is applied only to the inner width of the cross-section, see Eq. (8). It should be mentioned that for the deterministic numerical analysis the values of Anom and fy are used as the nominal area and the yield strength. The evaluation of the reduction factor is done in the function of the p local slenderness ratio, which is calculated by Eq. (9) based on the EN1993-1-5 [2].
FEM 2 y
2 nom
4 4
N t
f
A t
(7)
Anom 4t2
4t2 fy Nr
(8)
p 28 4. b t
k
where k 4,
y
235MPa
f (9)
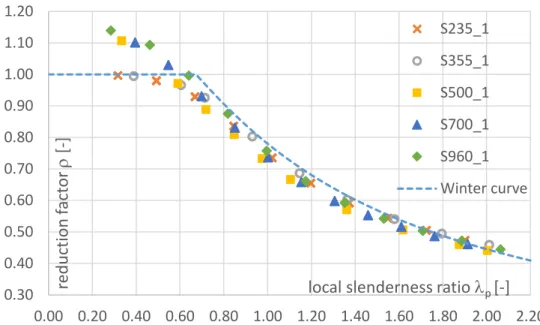
The numerical resistances of analysis type 1 are compared to the Winter curve in Figure 7.
In case of analysis type 1, all the cases with the same yield strength and local slenderness ratios (depending on the b/t ratio) but with different plate thicknesses provided identical reduction factors. The results show that the application of b/200 equivalent geometric imperfection results in resistances close to the Winter curve, independently from the yield strength. In the plastic zone a difference can be identified between the NSS (S235, S355) and HSS (S500, S700, S960) columns; the HSS columns provide higher resistances than the plastic resistance (Anom fy), this can be explained by the fact that HSS materials does not have clear yield plateau and the 0.2%
proof stress is used as yield stress. Figure 8 shows the results of analysis type 2. It can be observed that there are several different results which belongs to the same yield strength and local slenderness ratios. It means that keeping the local slenderness ratio constant, but changing the plate thickness could result in change in the resistance. This behavior can be explained by the applied residual stress model, where the magnitude of the compressive residual stress is thickness dependent. The residual stress model gives lower compressive residual stress for thick plates than for thin plates, considering the same b/t ratio.
Figure 7: Results of analysis type 1, compression.
Therefore, the box sections made of thicker plates have higher reduction factor than the box sections having the same slenderness, but made of thinner plates. However, this behavior is considerable only in the middle local slenderness range (approximately if 0.8 < < 1.3, see Figure 8). This is explained by the fact that the residual stress has the main impact on the resistance in this slenderness range, where elastic-plastic failure occurs. In case of lower slenderness, the failure mode is mainly plastic. In case of higher slenderness ratios, the failure mode is mainly elastic. In case of both the fully elastic and fully plastic cases the residual stress does not have considerable impact on the buckling resistance. The results also show that using the realistic imperfection and residual stress values (analysis type 2) results in lower resistances than using the equivalent geometric imperfection of EN 1993-1-5 [2] (analysis type 1).
Figure 8: Results of analysis type 2, compression.
0.30 0.40 0.50 0.60 0.70 0.80 0.90 1.00 1.10 1.20
0.00 0.20 0.40 0.60 0.80 1.00 1.20 1.40 1.60 1.80 2.00 2.20
reduction factor[-]
local slenderness ratio p [-]
S235_1 S355_1 S500_1 S700_1 S960_1 Winter curve
0.30 0.40 0.50 0.60 0.70 0.80 0.90 1.00 1.10 1.20
0.00 0.20 0.40 0.60 0.80 1.00 1.20 1.40 1.60 1.80 2.00 2.20
reduction factor[-]
local slenderness ratio p [-]
S235_2 S355_2 S500_2 S700_2 S960_2 Winter curve
Figure 9: Mean results of analysis type 2, compression.
In order to evaluate the results, the reduction factors related to the same yield strength and local slenderness are averaged, and these values are shown in Figure 9. The results show that box sections made of steel grades with higher yield strength provides slightly higher reduction factor than box sections having the same local slenderness but made of lower steel grades. This also can be explained by the residual stress model, since the value of the compressive residual stress does not depend on the yield strength. Therefore, the compressive residual stress is not increasing together with increasing of the yield strength. However, all of the calculated numerical buckling curves are below the Winter curve, even for the highest S960 steel grade.
Based on the deterministic numerical results it can be concluded that the Winter curve is not on the safe side to obtain the local buckling resistance of square welded box sections under pure compression. To ensure the required safety either the buckling curve or the value of the related partial safety factor could be changed. The appropriate partial safety factor that can be used together with the Winter curve based calculation method can be determined based on stochastic analysis. The authors are still currently working on this research field.
4.3 Results for bending
In this section the results of the pure bending case are discussed. It has to be mentioned that in case of pure bending the connection between the reduction factor and the buckling resistance is not so obvious as in case of pure compression (see Eq. (7)). In order to simplify the problem only those cases are evaluated where the web does not belong to cross-section class 4. Therefore, only the compressed flange can buckle. In this case the local buckling resistance can be calculated by Eq. (10).
eff
fr eff f y y
s f
M W f I f
x
(10)
where
Weff is the effective cross-section modulus,
0.30 0.40 0.50 0.60 0.70 0.80 0.90 1.00 1.10 1.20
0.00 0.20 0.40 0.60 0.80 1.00 1.20 1.40 1.60 1.80 2.00 2.20
reduction factor[-]
local slenderness ratio p [-]
S235-mean S355-mean S500-mean S700-mean S960-mean Winter curve
The value of f can be directly calculated knowing the effective-cross section modulus, the width of the cross-section and the plate thickness. Therefore, the numerical f values are derived from the results of the WFEM, calculated by Eq. (11) in function of the numerical resistances (MFEM) and the nominal yield strength (fy).
FEMFEM f
y
M
W f (11)
The local slenderness ratio p is calculated on two different ways. The value of p,EC is calculated following the concept of the EN 1993-1-5 using Eq. (9). The value of p,FEM is calculated based on the critical bending moment related to elastic buckling (Mcr) by Eq. (12).
el,r p,FEM
cr
M
M where Mel,r Wel fy (12)
where
Wel is the elastic cross-section modulus,
Mcr is obtained by elastic buckling analysis using the finite element model.
As it is mentioned, for bending only those geometries are examined, where the web does not belong to cross-section class 4. Table 3 summarizes the limits for cross-section class 4 of the web for the studied steel grades. It can be observed that the web buckles if p,FEM is higher than 1.46.
Table 3: The limit for cross-section class 4 related to the web.
Material grade b/t p,FEM p,EC
S235 101.4 1.456 1.750
S355 82.89 1.459 1.750
S500 70.16 1.462 1.750
S700 59.61 1.465 1.751
S960 51.20 1.469 1.751
Mean: 1.46 1.75
Figure 10: Results of analysis type 1, bending, based on p,EC.
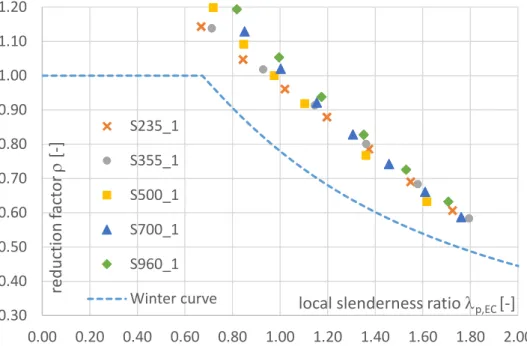
Figure 10 and Figure 11 compare the numerical results (f) to the Winter curve using the two different concepts for the local slenderness ratio. In case of analysis type 1, all the cases with the same yield strength and local slenderness ratios, but with different plate thickness provided the same f reduction factor. It can be observed that the obtained numerical results are significantly higher than in case of pure compression. This is especially true for the evaluation based on p,EC. The evaluation based on p,FEM represents the real behavior better, but engineers are using the values of p,EC to design steel structural elements. Therefore, for the statistical evaluation to provide the necessary partial factor p,EC should be considered. Figure 11 shows that if the p,FEM is equal by 1.5 then the numerical analysis provides the same result as the Winter curve and the same results that was experienced using pure compression. This observation has a good agreement with the average limit of p,FEM = 1.46 for the cross-section class 4 (see Table 3). The explanation for this is when the web becomes to be cross-section class 4, it starts to buckle and provides no more restraint to the flange, therefore the same situation is reached that exists for square closed sections under pure compression. It can be observed that higher yield strength results in slightly higher reduction factors as it was experienced in case of pure compression as well.
0.30 0.40 0.50 0.60 0.70 0.80 0.90 1.00 1.10 1.20
0.00 0.20 0.40 0.60 0.80 1.00 1.20 1.40 1.60 1.80 2.00
reduction factor [-]
local slenderness ratio p,EC [-]
S235_1 S355_1 S500_1 S700_1 S960_1 Winter curve
Figure 11: Results of analysis type 1, bending, based on p,FEM.
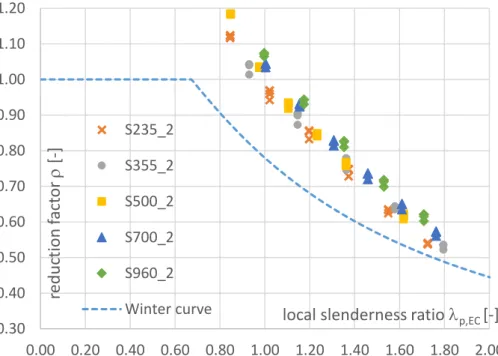
Figure 12 shows the numerical reduction factors based on analysis type 2 in function of the
p,EC local slenderness ratio. As it was experienced by compression, changing the plate thickness has an impact to the buckling resistance due to the characteristic of the applied residual stress model. This behaviour is considerable in the same middle slenderness region that is experienced by the compression load. The reduction factors representing the same yield strength and b/t ratio are averaged and presented in Figure 13.
Figure 12: Results of analysis type 2, bending, based on p,EC. 0.30
0.40 0.50 0.60 0.70 0.80 0.90 1.00 1.10 1.20
0.00 0.20 0.40 0.60 0.80 1.00 1.20 1.40 1.60 1.80 2.00
reduction factor[-]
local slenderness ratio p,FEM [-]
S235_1 S355_1 S500_1 S700_1 S960_1 Winter curve
0.30 0.40 0.50 0.60 0.70 0.80 0.90 1.00 1.10 1.20
0.00 0.20 0.40 0.60 0.80 1.00 1.20 1.40 1.60 1.80 2.00
reduction factor[-]
local slenderness ratio p,EC [-]
S235_2 S355_2 S500_2 S700_2 S960_2 Winter curve
Figure 13: Mean results of analysis type 2, bending, based on p,EC.
The resistance-increasing effect of the higher yield strength can be observed similarly to the previously experienced rate. However, all of the calculated numerical buckling curve is above the Winter curve. The difference between pure compression and pure bending is presented in Figure 14. It can be explained by the fact that in case of bending the webs provide considerable rotational restraint to the compressed flange at the corners, but in case of compression all of the sides of the cross-section buckle at the same time, so those cannot provide rotational restraint to each other.
0.30 0.40 0.50 0.60 0.70 0.80 0.90 1.00 1.10 1.20
0.00 0.20 0.40 0.60 0.80 1.00 1.20 1.40 1.60 1.80 2.00 2.20
reduction factor[-]
local slenderness ratio p,EC [-]
S235-mean S355-mean S500-mean S700-mean S960-mean Winter curve
0.30 0.40 0.50 0.60 0.70 0.80 0.90 1.00 1.10 1.20
0.00 0.20 0.40 0.60 0.80 1.00 1.20 1.40 1.60 1.80 2.00 2.20
reduction factor[-]
local slenderness ratio p,EC [-]
S355-compression S960-compression S355-bending S960-bending Winter curve
5 CONCLUSION
In the present paper a deterministic numerical analysis is carried out to determine the local buckling resistance for welded NSS and HSS square box section columns. The investigation covers columns loaded by compression and bending moment separately. Numerical research program is executed to determine the necessary reduction factor to determine the local buckling resistance for various cross section geometries and steel grades. The applied numerical model is verified based on laboratory test results taken from international literature. To the determination of the typical residual stress pattern and local geometric imperfections laboratory tests are executed. The obtained results based on the numerical simulations are compared to the plate buckling curve provided by the EN 1993-1-5 [1]. Based on the numerical results the following conclusions are drawn:
for square box section columns loaded by pure compression, the local buckling resistance can be overestimated by the application of the Winter curve,
the application of the proposed equivalent geometric imperfection (h/200) given by the EN 1993-1-5 can provide the same safety level as the Winter curve,
for square box section columns loaded by pure bending, the local buckling resistance is underestimated by the application of the Winter curve due to neglecting the supporting effect of the adjacent plates within the cross section,
the relative local buckling resistance (reduction factor) of columns made from HSS can be slightly larger than for columns made from NSS.
ACKNOWLEDGEMENT
The executed research program was supported by the ÚNKP-17-3-III and the ÚNKP- 17-4-III New National Excellence Program of the Ministry of Human Capacities; the financial support is gratefully acknowledged.
REFERENCES
[1] EN 1993-1-12: Eurocode 3: Design of steel structures - Part 1-12: Additional rules for the extension of EN 1993 up to steel grades S700, CEN, 2007.
[2] EN 1993-1-5: Eurocode 3: Design of steel structures - Part 1-5: Plated structures, CEN. 2006.
[3] Kármán T., Sechler E.E., and Donnell L.H. “The strength of thin plates in compression”, Transactions of the American Society of Mechanical Engineers, 54, 53–57, 1932.
[4] Winter G. “Strength of thin steel plates compression flanges”, Transactions of the American Society of Civil Engineers, 112(1), 527–554, 1947.
[5] Clarin M. “High Strength Steel: Local Buckling and Residual Stresses”, Licentiate, Lulea University of Technology, Lulea, 06.12.2004.
[6] Kuhlmann U. and Kövesdi B. “Partial safety factor for plate buckling”, ECCS/TC8 Meeting, Coimbra, 27 October 2017.
[7] Nishino F., Ueda Y. and Tall L. “Experimental Investigation of the buckling of plates with residual stresses”, Lehigh University, 1966.
[8] Rasmussen K.J.R. and Hancock G.J., “Plate slenderness limits for HSS sections”, Journal of Constructional Steel Research, 23(1–3), 73–96, 1992.
[9] Bridge R.Q. and O’Shea M.D. “Behaviour of thin-walled steel box sections with or without internal restraint”, Journal of Constructional Steel Research 47(1–2), 73-91, August 1998.
[10] Pircher M., O’Shea M.D. and Bridge R.Q. “The influence of the fabrication process on the buckling of thin-walled steel box sections”, Thin-Walled Structures 40(2), 109-123, February 2002.
[11] Shi G., Zhou W., Bai Y. and Lin C. “Local buckling of 460 MPa high strength steel welded section stub columns under axial compression”, Journal of Constructional Steel Research, 100, 60–70, September 2014.
[12] Shi G., Xu K., Ban H. and Lin C. “Local buckling behavior of welded stub columns with normal and high strength steels”, Journal of Constructional Steel Research, 119, 144–153, March 2016.
[13] Schillo N. and Feldmann M. “Local buckling behaviour of welded box sections made of high- strength steel - Comparing experiments with EC3 and general method”, Steel Construction – Design and Research Vol. 8. September 2015, No. 3.
[14] Schillo N., Taras A. and Feldmann M. “Assessment of safety factor for local buckling”, CEN/TC250/SC3/WG5 Meeting Stuttgart, 26 February 2016.
[15] ANSYS® v16.2, Canonsburg, Pennsylvania, USA.
[16] Somodi B, Kövesdi B. “Residual stress measurements on welded square box sections using steel grades S235–S960”, Thin-Walled Structures 123, 142-154, February 2018.
[17] EN 1090-2: Execution of steel structures and aluminium structures. Part 2: Technical requirements for steel structures, 2011.