DOI: 10.1556/606.2018.13.2.9 Vol. 13. No. 2. pp. 87–95 (2018) www.akademiai.com
APPLICATION OF POLYMER GRIDS FOR REINFORCEMENT OF ASPHALT PAVEMENT
ROADS: CASE STUDY OF CORRIDOR X IN MACEDONIA
1 Esat GASHI, 2 Ljupčo DIMITRIEVSKI, 3 Darko ILIEVSKI
1 Faculty of Civil Engineering, University of Prishtina, Sunny Hill nn. 10 000, Pristina Republic of Kosovo, e-mail: esat.gashi@uni-pr.edu
2,3 Geing Institute, Boris Trajkovski str no 111, 1050, Skopje, Republic of Macedonia e-mail: 2ljupcod@geing.com.mk, 3darkoi@geing.com.mk
Received 19 October 2017; accepted 13 March 2018
Abstract: Asphalt paved roads prematurely exhibit a cracking pattern similar to that in the old underlying pavement. The cracking in the new overlay surface is due to the inability of the overlay to withstand shear and tensile stresses created by movements concentrated around pre- existing cracks in the underlying pavement. This movement may be due to traffic loading causing differential deflections at cracks in the underlying pavement layers, expansion or contraction of subgrade soils, expansion or contraction of the pavement itself due to changes in temperature, or combinations of these phenomena. Due to heavy deformation of asphalt paved surface, using European funds, the Government of Macedonia initiated rehabilitation of Corridor X close to the Tetovo section. For the reconstruction of this important section of the motorway, an experimental programme was conducted to determine the effects of geogrid reinforcement on mitigating reflection cracking in asphalt overlays. The objective of this study is to assess the inclusion of geogrid in the pavement cross-section and the accumulation of permanent deformation. The geogrid position, type of existing pavement, temperature, and joint/crack opening were analyzed in three site trial tests. Crack propagation under repeated loading was monitored as well. The results indicate a significant reduction in the rate of crack propagation in reinforced samples compared to unreinforced samples of old asphalt pavement. The presented pavement design procedure could be tailored to the specific needs of the project and implemented in various road rehabilitation projects.
Keywords: Road surfacing, Pavement design, Sustainability, Geogrids
1. Introduction
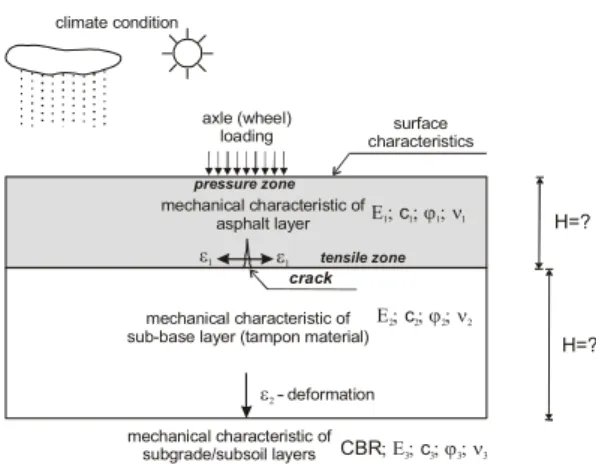
The design of pavement structure is a complex engineering problem because the influential parameters are numerous, different, and variable during the exploitation period. Pavement distress may occur due to either traffic or environmental loads. Traffic loads result from repeated wheel loads, which can cause either structural or functional failure. Environmental loads are induced by climatic conditions, like temperature variations or subgrade moisture. Pavement structures besides the task for bearing capacity and usability in different operational conditions, climatic influences and field conditions, must comply with flatness and friction-adhesion condition for safe and comfortable driving by all types of vehicles, which may circulate in traffic [1].
A complex of influential parameters for the design of pavement structures is presented in Fig 1.
climate condition
mechanical characteristic of asphalt layer
mechanical characteristic of sub-base layer (tampon material)
mechanical characteristic of subgrade/subsoil layers
surface characteristics
crack axle (wheel)
loading
Ε ; 1c1; ϕ1; ν1
Ε ; 2 c2; ϕ2; ν2
CBR; Ε ; 3 c3; ϕ3; ν3
ε2 - deformation ε1
ε1
pressure zone
tensile zone
H=?
H=?
Fig. 1. Parameters that influence the dimensioning of pavement structures
Variants are usually considered in the design of pavement structures in order to achieve the maximum effects with minimal investment in terms of maintenance and management of roads. The latest techniques investigated by researchers for reducing reflective cracking prefer the use of more compliant asphalts pavements produced by polymers, modification of the bituminous mixture, the use of ground scrap tire rubber, and installations of geo-synthetic materials that act as grids, fabrics, and composites in to these structures. The above techniques result in either an increase in the overlay’s tensile strength or an increase in its flexibility.
Usually flexible pavement structures are deformed from circulations of mobile loads from vehicles. As a result of the loads, the pressure in lower layer is localized in small area around the load axis. To allocate a larger area and reduce the pressures on this small area around the axle, it is necessary to increase the dimensions of the pavement structure or to apply modern high-quality materials like: special asphalts pavements with polymer-bitumen, Arbocel, Carbon fibers, Geosynthetics, etc. [2], [3].
In this paper, the upgrading of the pavement with polymer grids in the Tabanovce- Kumanovo section, which is a part of Corridor X in Macedonia, will be presented. For the upgrade of the motorway, several types of trial cases and different positions of traffic loads of vehicles and polymer grid installation in the paved structure were analyzed through simulations.
The Finite Element Method (FEM) is the major analysis technique used by researchers to identify causes of reflective cracking. The FEM makes the basic assumption that asphaltic concrete is modeled as an elastic continuum with a finite number of structural elements interconnected at their corners (or nodes) [4]. The displacement of these nodes is governed by simple approximation functions, as prescribed by the user. The use of the FEM to accurately compute stress fields at the crack tip is complex and requires the use of extensive software resources [5].
The software for the analysis of stress deformation of the pavement in this case study was performed by the FEM using the commercial software package PLAXIS 8 [6].
For this particular case, the trial section has been prepared in one motorway carriageway, length of the section was 300 m width 11 m, traffic loads and underground moisture were considered. The pavement structure is simulated with an axle load of 82 kN distributed in four tires (4 × 20.5 = 82 kN) considering the pneumatics and the inflation pressure [7], [8].
The in situ cross-section characteristics of all layers of materials were considered as well as the materials intended to be laid for the upgrade of the new pavement structure as it is shown in Table I.
Table I
Existing pavement characteristics Elastic
modulus E (kPa)
Poisson ration υ
Coefficient of pressure K
(kPa)
Internal rate of friction
φ (°)
AWC-11/16 9 500 000 0.46 250.00 35.00
AC-BNS 22 sA 6 000 000 0.45 200.00 36.00
Old asphalt pavement 4 000 000 0.42 180.00 32.00
Old sub-base 100 000 0.30 5.00 36.00
Old subgrade 50 000 0.20 3.00 29.00
Sub-base 130 000 0.32 5.00 38.00
Improved subgrade 80 000 0.30 10.00 30.00
Subgrade for fast lane 50 000 0.30 2.00 28.00
Subsoil 20 000 0.30 15.00 17.90
For the existing laid materials, nominal values were taken from the literature adequate surveys were performed for this project as well. For the unbounded materials, the apparent cohesion, which was obtained by laboratory testing, is suitable
f
or closed types of structures.In this paper five typical cases are analyzed presenting the behavior of upgrade pavement under real conditions during exploitation with absolute values.
2. Analyses of specific cases of pavement structures
General consideration: As a trial section, three sections with a length of 300 m each were prepared under the following conditions:
• Section one was left without reinforcement, Section two had one polymer grid, and section three had two polymer grids overlapping each other by 50-60 cm;
• The polymer grid was placed between the old asphalt pavement and the bituminous binder course as per general requirements for the polymer grid installation for the pavement reinforcement [9], as it is presented in Fig. 2.
>12 cm 5.0 cm AC 11/16
>7.0 cm BNS 22sA 15-25.0 cm old asphalt
35.0 cm sub-base crushed stone 35.0 cm Polymer grid
Fig. 2. Cross-section of the proposed pavement design
2.1. Case I: Traffic loaded on the fast lane
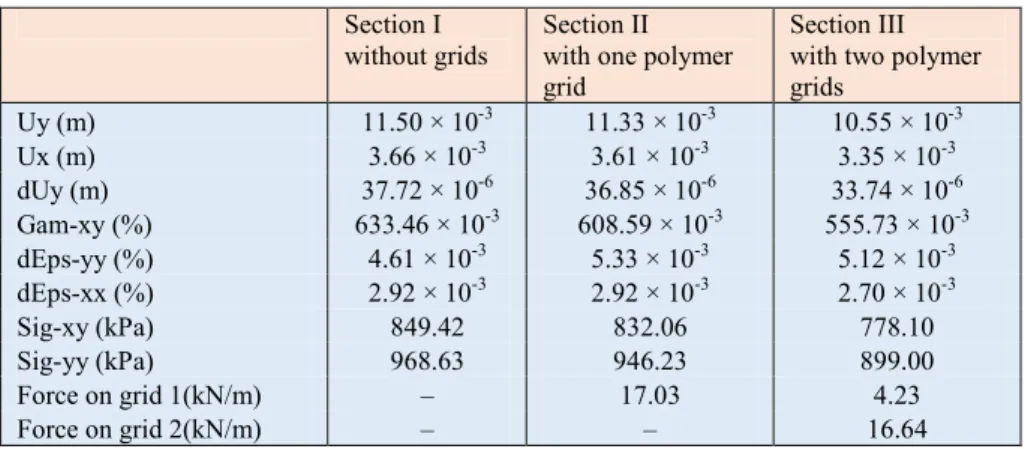
Case I presents the load impact on the stress deformation of polymer grids when the fast lane is loaded. A dynamic load (four-axle truck) was moving in the fast lane only in all three trial sections prepared in a row as follows: section I without polymer grid, section II with one layer of polymer grid, and section III with two layers of polymer grids. The obtained results of all three Sections are presented in Table II.
Table II
Stress deformation data when the fast lane is loaded Section I
without grids
Section II with one polymer grid
Section III with two polymer grids
Uy (m) 11.50 × 10⁻³ 11.33 × 10⁻³ 10.55 × 10⁻³
Ux (m) 3.66 × 10⁻³ 3.61 × 10⁻³ 3.35 × 10⁻³
dUy (m) 37.72 × 10⁻⁶ 36.85 × 10⁻⁶ 33.74 × 10⁻⁶
Gam-xy (%) 633.46 × 10⁻³ 608.59 × 10⁻³ 555.73 × 10⁻³
dEps-yy (%) 4.61 × 10⁻³ 5.33 × 10⁻³ 5.12 × 10⁻³
dEps-xx (%) 2.92 × 10⁻³ 2.92 × 10⁻³ 2.70 × 10⁻³
Sig-xy (kPa) 849.42 832.06 778.10
Sig-yy (kPa) 968.63 946.23 899.00
Force on grid 1(kN/m) – 17.03 4.23
Force on grid 2(kN/m) – – 16.64
Comments on the results: As shown, the results obtained reveal that the most favorable stress-deformable situation is achieved when two polymer grids are applied.
The next best situation is when one grid is applied. The case without reinforcement is the least favorable.
The presented results are obtained with the simulation of one passing vehicle. When considering the number of vehicles this motorway is under exploitation, it can be concluded that the application of the polymer grids is acceptable for a given analysis as a technical solution for this pavement [10].
2.2. Case II: Traffic loaded on the middle lane
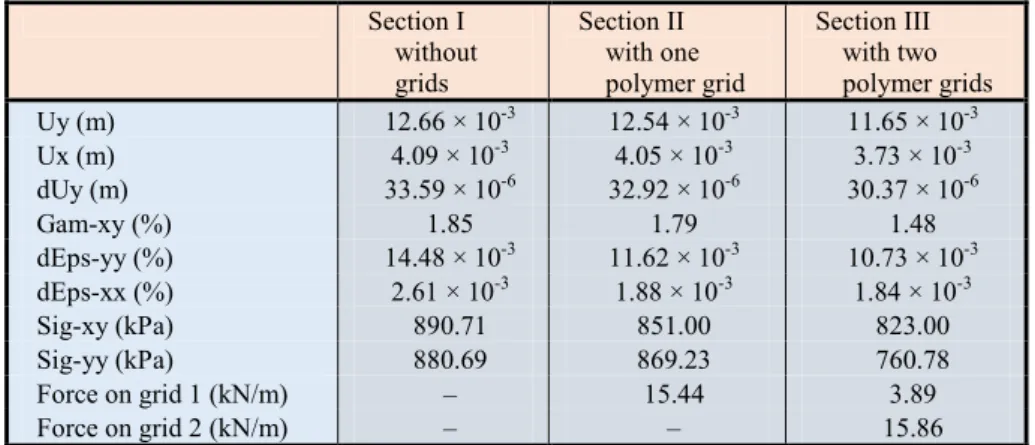
In case II the load impact on the stress deformation of polymer grids was considered when the middle lane is loaded. The test vehicle (four-axle truck) was moving in the middle lane in all three trial sections as described in first case. The obtained results of all three Sections are presented in Table III.
Table III
Stress deformation data when the middle lane is loaded Section I
without grids
Section II with one polymer grid
Section III with two polymer grids
Uy (m) 12.66 × 10⁻³ 12.54 × 10⁻³ 11.65 × 10⁻³
Ux (m) 4.09 × 10⁻³ 4.05 × 10⁻³ 3.73 × 10⁻³
dUy (m) 33.59 × 10⁻⁶ 32.92 × 10⁻⁶ 30.37 × 10⁻⁶
Gam-xy (%) 1.85 1.79 1.48
dEps-yy (%) 14.48 × 10⁻³ 11.62 × 10⁻³ 10.73 × 10⁻³
dEps-xx (%) 2.61 × 10⁻³ 1.88 × 10⁻³ 1.84 × 10⁻³
Sig-xy (kPa) 890.71 851.00 823.00
Sig-yy (kPa) 880.69 869.23 760.78
Force on grid 1 (kN/m) – 15.44 3.89
Force on grid 2 (kN/m) – – 15.86
Comments on the results: The results obtained shows that the most favorable case is when two layers of grids are used. The least favorable case is when no grid is used.
As it is stated in first case, the presented results are obtained with simulation of passing of one vehicle. When considering the number of vehicles this motorway is under exploitation, it can be concluded that the application of the polymer grids is acceptable for a given analysis as a technical solution for this pavement.
2.3. Case III: Traffic loaded on fast and middle lanes with changeable length of polymer grid
In case III the load impact on the stress deformation of polymer grids was analyzed when the testing vehicle circulates from slow line to the fast line. Analysis were performed in section three, reinforced with two polymer grids overlapping each other
60 cm up to 1.5–2.0 m from the edge of the reserve line. The obtained results of cross- section strength are presented in Table IV.
Table IV
Stress deformation data, when the fast and middle lanes are loaded Vehicle in fast lane Vehicle in middle lane
Uy (m) 10.93 × 10⁻³ 12.53 × 10⁻³
Ux (m) 3.48 × 10⁻³ 4.05 × 10⁻³
dUy (m) 35.15 × 10⁻⁶ 32.79 × 10⁻⁶
Gam-xy (%) 580.70 × 10⁻³ 1.55
dEps-yy (%) 5.16 × 10⁻³ 10.91 × 10⁻³
dEps-xx (%) 2.78 × 10⁻³ 1.84 × 10⁻³
Sig-xy (kPa) 823.20 836.60
Sig-yy (kPa) 924.12 769.42
Force on grid 1 (kN/m) 4.72 74.75 × 10⁻³
Force on grid 2 (kN/m) 16.82 15.09
Comments on the results: The results obtained give insights to the stress-deformable situation, normal tangential shear stress, displacement, and manifestation of the plastic points when vehicle circulate from slow to fast line [11]. The table presents the forces occurring in the polymer grids and incremental displacements, which are important in terms of satisfaction of the required parameters for the polymer grid and improvement of the deformable-stress condition. Compared with the previous cases, it can be noticed that the critical parts of the strength appear in zones where the second grid is placed.
If it is considered that the presented result are obtained with the simulation of one vehicle only than application of the polymer grid is acceptable for a given analysis as technical solution, considering a real traffic of this pavement during the exploitation.
2.4. Case IV: Traffic load at any point of the lane with adjustable length of polymer grid As in this paper the considered fourth case was the behavior of reinforcement asphalt pavement with polymer grids under traffic loads at any point of fast and middle lane. As presented in the previous case, the polymer grid covers full width of fast and middle lane up to 1.5–2.0 m from the edge of the reserve line.
The obtained results of cross-section strength are presented in Table V.
Comments on the results: The results obtained present the stress-deformable situation, normal tangential shear stress, displacement, and manifestation of the plastic points. The table presents the forces occurring in the polymer grids and incremental displacement, which are important in terms of satisfaction of the required parameters for the polymer grid and improvement of the deformable-stress condition. As it is presented in the table it can be concluded that critical position of pavement stress-deformation is at the zones where the vehicle load passes.
Considering that this is a simulation with one vehicle only the application of the polymer grid is acceptable for a given analysis as technical solution considering a real traffic of this pavement during the exploitation.
Table V
Stress deformation data, with loading by centered vehicle and vehicle in the middle lane With centered vehicle Vehicle in middle lane
Uy (m) 12.31 × 10⁻³ 12.53 × 10⁻³
Ux (m) 3.90 × 10⁻³ 3.97 × 10⁻³
dUy (m) 36.38 × 10⁻⁶ 39.10 × 10⁻⁶
Gam-xy (%) 1.33 859.89 × 10⁻³
dEps-yy (%) 6.70 × 10⁻³ 4.74 × 10⁻³
dEps-xx (%) 2.30 × 10⁻³ 2.58 × 10⁻³
Sig-xy (kPa) 854.27 856.40
Sig-yy (kPa) 817.99 844.77
Force on grid 1 (kN/m) 3.31 4.41
Force on grid 2 (kN/m) 17.97 17.43
2.5. Case V: Traffic loaded in two lanes with and without polymer grid
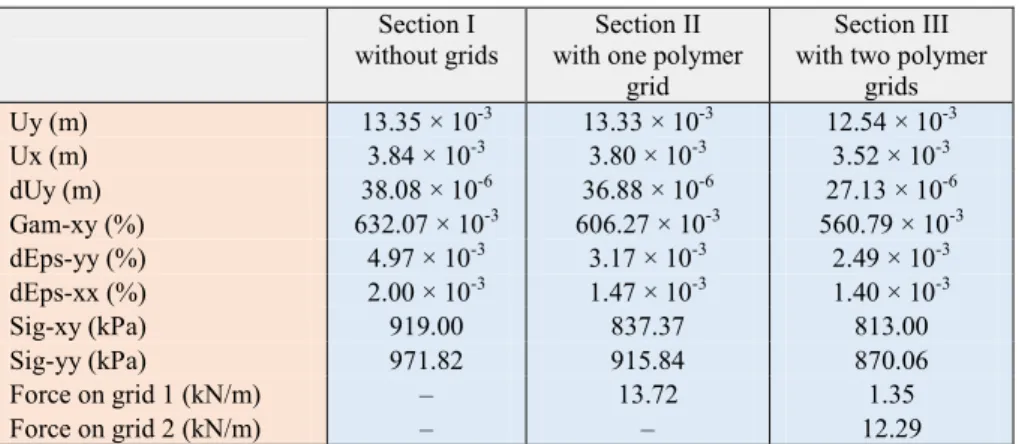
As the last case presented in this paper is the loading of fast and slow traffic lanes with traffic loads at the same time, which is the most real case during motorway exploitation. The obtained results are presented in Table VI.
Table VI
Stress deformation data, when the fast and slow traffic lanes are under traffic Section I
without grids
Section II with one polymer
grid
Section III with two polymer
grids
Uy (m) 13.35 × 10⁻³ 13.33 × 10⁻³ 12.54 × 10⁻³
Ux (m) 3.84 × 10⁻³ 3.80 × 10⁻³ 3.52 × 10⁻³
dUy (m) 38.08 × 10⁻⁶ 36.88 × 10⁻⁶ 27.13 × 10⁻⁶
Gam-xy (%) 632.07 × 10⁻³ 606.27 × 10⁻³ 560.79 × 10⁻³
dEps-yy (%) 4.97 × 10⁻³ 3.17 × 10⁻³ 2.49 × 10⁻³
dEps-xx (%) 2.00 × 10⁻³ 1.47 × 10⁻³ 1.40 × 10⁻³
Sig-xy (kPa) 919.00 837.37 813.00
Sig-yy (kPa) 971.82 915.84 870.06
Force on grid 1 (kN/m) – 13.72 1.35
Force on grid 2 (kN/m) – – 12.29
Comments on the results: The results obtained show insight into the stress- deformable situation, normal tangential shear stress, displacement, and manifestation of the plastic points. In the analyzed cases, the behavior of the pavement structure can be seen and insight into the characteristic size of the stress-deformable condition of the road structure with and without the polymer grid. The presents the forces occurring in the polymer grids and incremental displacement, which is important to satisfy the required parameters for the polymer grid in order to improve the deformable-stress condition of the pavement [12]. As it can be seen from the presented results in Table VI,
the most favorable stress deformable situation is achieved when two polymer grids are applied. The next best simulation is when one grid applied. The case without reinforcement is the least favorable.
Considering that this is a simulation with one vehicle only, the application of the polymer grid is acceptable for a given analysis as technical solution considering a real traffic of this pavement during the exploitation
3. Conclusions and recommendations
Based on laboratory testing and surveys conducted on the project site, it has been shown that the inclusion of polymer grids within a pavement overlay will reduce the rate of reflective crack propagation by a factor of 1.5 to 2. This leads to an extension of the pavement service life and reduced maintenance costs. In a typical motorway pavement, these benefits are likely to yield life cycle cost savings of between 20 and 30%. However, in order to achieve the maximum impact of the grid installment in the overlay design, the following measures need to be taken:
• Before doing any overlay design, it is essential to prepare a laboratory sample test that is as close to the site conditions as possible in order to minimize the differences between the laboratory results and site results;
• The position of the polymer grid in the pavement cross-section should be beneath the asphalt binder course if an asphalt wearing course is laid; if only one course is laid then the grid should be placed between the old and new layers;
• The asphalt pavement reinforcement with polymer grids provides an effective solution in terms of durability as well as the lifetime cost of the pavement;
• It is recommended that road owners consider strengthening motorway sectors, which are heavily exploited with polymer grids because they provide a better cost-benefit ratio than relying on or increasing the wearing course thickness;
• Strengthening of the pavement structure can be performed for urban roads, industrial roads, airport runways, taxiways, and aprons.
References
[1] Molenaar A. A. A. Design method for plain and geogrid reinforced overlays on cracked pavements, Road and Railway Research Laboratory, Delft University of Technology, Netherlands, M. Nods, Huesker Synthetic GmbH & Co. Gescher, Germany, 1996.
[2] Bonaparte R., Holtz R. D., Giroud J. P. Soil reinforcement design using geotextiles and geogrids, in Geotextile Testing and the Design Engineer, J. E. Fluet (Ed), ASTM, Special Technical Publication 952, 1987, pp. 69‒116.
[3] Elsing A., Sobolewski J. Asphalt-layer polymer reinforcement: Long-term experience, new design method, recent developments, Huesker Synthetic GmbH & Co, Gescher, Germany, 2009.
[4] Fi I., Szentpéteri I. A mechanistic-empirical approach for asphalt overlay design of asphalt pavement structures, Periodica Polytechnica, Civil Engineering, Vol. 58, No. 1, 2014, pp. 55−62.
[5] Sachs S., Vandenbossche J. M., Li Z., Barman, M. Accounting for temperature susceptibility of asphalt stiffness when designing bonded concrete overlays of asphalt pavements, Journal of Transportation Engineering, Vol. 142, No. 10, 2016, Paper No.
04016040.
[6] PLAXIS software - based on the finite element method, 2016.
[7] Adorjányi K., Füleki P. Performance parameters and stress sensitivity of bitumen at high temperature, Pollack Periodica, Vol. 7, No. 2, 2012, pp. 109−116.
[8] Soós Z. Consideration of temperature at the moduli of asphalt layers for a suggested mechanistic overlay design method, Pollack Periodica, Vol. 12, No. 1, 2017, pp. 93−106.
[9] AASHTO Standard specification for geotextile specification for highway applications M 288-06 (2011), American Association of State Highway and Transportation Officials, Washington DC, 2014,
[10] Siriwardane H., Gondle R., Kutuk B. Analysis of flexible pavements reinforced with geogrids, Geotechnical and Geological Engineering, Vol. 28, No. 3, 2010, pp. 287–297.
[11] Füleki P. Improving pavement performance by compact-asphalt technology, Pollack Periodica, Vol. 4, No. 3, 2009, pp. 111−120.
[12] Zhang J., Liu G., Hu Z., Zhu C., Pei J., Long J. Effects of temperature and loading frequency on asphalt and filler interaction ability, Construction and Building Materials Vol. 124, 2016, pp. 1028−1037.