the UKB envirome of depression:
from interactions to synergistic effects
Gabor Hullam1,2, Peter Antal 1, Peter petschner 2,3, Xenia Gonda 2,4,5, Gyorgy Bagdy2,3,4, Bill Deakin 6,7 & Gabriella Juhasz 3,6,8
Major depressive disorder is a result of the complex interplay between a large number of environmental and genetic factors but the comprehensive analysis of contributing environmental factors is still an open challenge. the primary aim of this work was to create a Bayesian dependency map of environmental factors of depression, including life stress, social and lifestyle factors, using the UK Biobank data to determine direct dependencies and to characterize mediating or interacting effects of other mental health, metabolic or pain conditions. As a complementary approach, we also investigated the non-linear, synergistic multi-factorial risk of the UKB envirome on depression using deep neural network architectures. our results showed that a surprisingly small number of core factors mediate the effects of the envirome on lifetime depression: neuroticism, current depressive symptoms, parental depression, body fat, while life stress and household income have weak direct effects. Current depressive symptom showed strong or moderate direct relationships with life stress, pain conditions, falls, age, insomnia, weight change, satisfaction, confiding in someone, exercise, sports and Townsend index. In conclusion, the majority of envirome exerts their effects in a dynamic network via transitive, interactive and synergistic relationships explaining why environmental effects may be obscured in studies which consider them individually.
Major depressive disorder (MDD) is a complex illness which is the leading cause of disability in the working pop- ulation that results in severe decrease in life quality and elevated risks concerning several diseases1–3. Its clinical definition is still evolving and MDD is frequently viewed as a clinical construct associated with a set of symptoms originating from potentially different biological processes4.
Despite of its complex etiology and uncertain clinical manifestations, MDD has a strong, heritable genetic background: additive genetic effects are attributed to explain approximately 40% of the variation of susceptibility to this disorder5. However, only a handful of genetic variants were found associated with MDD on a genome-wide significance level by earlier genome-wide association (GWA) studies6. Although a recent study significantly increased the number of hits, the identification of these variants required enormous data sets consisting of several hundred-thousands subjects4. This is in line with the common variant hypothesis postulating that a considera- ble proportion of genetic variants affecting the development of MDD have only weak effects, and thus, only the interaction of several factors could produce considerable increase in risk for MDD. This phenomenon was one of the possible causes of the lack of success of earlier GWA studies which were typically underpowered to detect factors with low effect size7.
1Department of Measurement and information Systems, Budapest University of technology and economics, Budapest, H-1117, Hungary. 2MTA-SE Neuropsychopharmacology and Neurochemistry Research Group, Hungarian Academy of Sciences, Semmelweis University, Budapest, H-1089, Hungary. 3Department of Pharmacodynamics, Faculty of Pharmacy, Semmelweis University, Budapest, H-1089, Hungary. 4NAP2-SE New Antidepressant Target Research Group Semmelweis University, Budapest, H-1089, Hungary. 5Department of Psychiatry and Psychotherapy, Semmelweis University, Budapest, Hungary. 6neuroscience and Psychiatry Unit, Division of neuroscience and experimental Psychology, University of Manchester and Manchester Academic Health Sciences Centre, Manchester, M13 9PL, UK. 7Greater Manchester Mental Health NHS Foundation Trust, Prestwich, Manchester, UK. 8SE-NAP2 Genetic Brain Imaging Migraine Research Group, Semmelweis University, Budapest, H- 1089, Hungary. Correspondence and requests for materials should be addressed to G.J. (email: juhasz.gabriella@
pharma.semmelweis-univ.hu) Received: 9 December 2018
Accepted: 19 June 2019 Published: xx xx xxxx
opeN
Accumulating results led to the realization that MDD is a result of the interplay of a large number of environ- mental and genetic factors: environmental and lifestyle descriptors such as years of education, body mass index, negative life events and childhood adversities were found to be significant factors in (G × E) interactions with respect to MDD indicating potential moderating effects of these factors on genetic vulnerability8–13. In addition, neuroticism or current depressive symptoms, which show considerable genetic overlap with MDD4, may mediate these environmental effects14,15. Non-replicability of GWA studies was also linked to the lacking or inadequate representation of environmental factors, resulting that such studies did not take gene-environment interactions (G × E) into consideration. Recent effort to investigate gene-environment wide interaction (GEWI) suggests that these interactions are of potential importance16.
Despite the fundamental role of environmental factors in common diseases, their comprehensive, omic-like analysis is lacking, mainly due to the heterogeneity of these factors. In MDD research, for example, the effect of environmental factors are typically well-explored individually in association with given genetic variants, but current approaches still disregard complex multivariate relationships between environmental factors, excluding potential higher-order environment-environment (E × E) interactions, which may prove to be vital for the further research of such complex disorders as major depression. Furthermore, association tests and simple regression analyses do not provide information on the directness of relationships with major depression, that is whether the effect of an environmental factor is mediated by other variables or not. Distinguishing between direct and non-direct relationships is especially relevant when selected factors serve as environmental context (in G × E) for assessing the relevance of genetic variants. Environmental factors that do not affect the target directly can be less interpretable and clinically less useful contexts. Therefore, a detailed map of the dependency relationships of environmental factors related to major depression would enhance further research.
Probabilistic graphical models proved to be an essential tool to represent the structural and the quantitative aspects of a system of dependencies17. They allow computationally efficient, scalable approaches to explore sparse models18 and causal effects19,20 in the frequentist framework and also the fine mapping of weak dependencies in the Bayesian approach21–23. We utilized Bayesian networks in the Bayesian approach referred to as Bayesian mul- tilevel analysis of relevance (BMLA) to support the systematic, consistent exploration of the complete hierarchy of higher-order interactions, even in the case of complex phenotypes24. The approach also characterizes the rele- vance of factors at global levels estimating posteriors for wide range of dependency and causal relations, which we previously applied to investigate multimorbidities of depression25.
In this paper we investigate the interdependencies of social, environmental, lifestyle, metabolic and mental health factors in lifetime depression using the UK Biobank resource (application No. 1602). Our goals are as follows: (1) construction of a Bayesian dependency map of the UKB envirome for lifetime depression, (2) charac- terization of the relationships in the envirome map based on their directness, interactions, and synergistic effects, and (3) investigation of the non-linear joint effect of the envirome on depression and also the predictive power of relevant sets of envirome variables. In order to achieve the former two goals we applied the BMLA method; while for the third goal we constructed and utilized deep neural networks.
Results
In the following sections, we present the results of multiple analyses performed using specific tools. First, we provide a detailed description of the envirome map based on the variable dependency structure estimated by the BMLA method. Results are shown both as an undirected graph and as edge probabilities (Fig. 1). Second, we introduce the strong relevance measure provided by the BMLA method and compare relevant factors with respect to lifetime depression (reported by the participants and elaborated by trained research nurses) and prob- able depression diagnosis (derived from the Mental Health Questionnaire with the method described by Smith et al.26). Third, we analyze structural interactions revealed by the BMLA method, and perform parametric analysis using multivariate odds ratios. Fourth, we investigate synergistic effects which differ from structural interactions as all involved variables have an individual effect. Finally, we present results of deep neural networks assessing predictive power. In addition to comparing strongly associated variables in terms of predictive capabilities, we also investigate the predictive power of variable groups.
the map of depression envirome. The primary aim of our study was to identify factors that may influ- ence susceptibility to lifetime depression or the severity of its symptoms. This requires multiple analyses that investigate possible relationships qualitatively and quantitatively. We applied the BMLA method for structural analysis, which provides posteriors for arbitrary dependency, relevance and causal patterns based on the multi- variate dependency structure learned from data21,22,24.
Figure 1 presents the network of variable relationships with respect to reported lifetime depression up to its second neighbors (sex and age and their connections are omitted for visibility purposes). An edge between varia- bles X and Y represents that based on Bayesian relevance analysis a dependency relationship exists between X and Y with a probability not less than 0.5. Note that this edge probability takes into account both possible directions of a directed edge assuming an underlying Bayesian network structure representing dependencies.
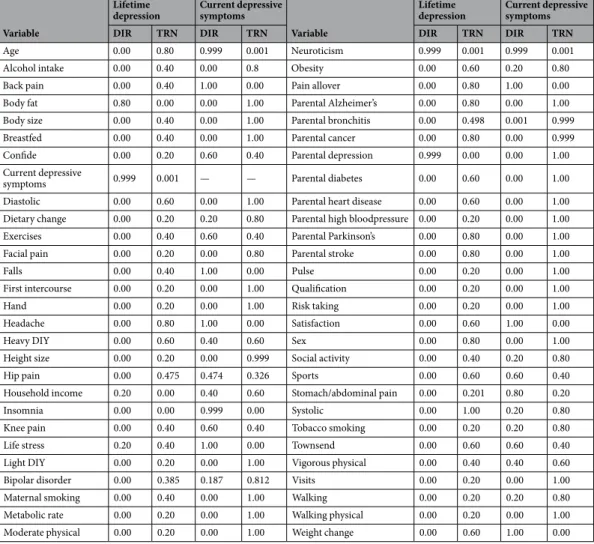
One of the remarkable features of this graph is that reported lifetime depression has only a few direct rela- tionships, namely current depressive symptoms, neuroticism, parental depression, and body fat percentage. All other factors shown on the graph are in a non-direct relationship with reported lifetime depression, most of them mediated by current depressive symptoms. Table 1 shows the probabilities of various relationship types such as direct and transitive relationships concerning lifetime depression and current depressive symptoms. A direct relationship between two variables X and Y means there are no intermediary variables between them, i.e., they are connected by a directed edge (X → Y or Y → X) in the graph representing dependency relationships. On the other hand, a transitive relationship between X and Y means that there are one or more intermediary variables (Z) in
between such that there is a path formed between X and Y by directed edges in the dependency graph (X → Z → Y or Y → Z → X).
Life stress and mental health factors. According to our results, the probability that recent negative life events of the past two years (denoted as Life stress) is in a direct relationship with lifetime depression is relatively low (pDir = 0.2), whereas the probability of a direct relationship with current depressive symptoms is high (pDir = 1.0).
Conversely, the probability of a transitive relationship is relatively higher in the former case (pTrans= 0.4), and low in the latter case (pTrans= 0.0).
The neuroticism personality trait (denoted as Neuroticism) is in a direct relationship with both lifetime depression and current depressive symptoms with high probability (pDir= 0.999). In addition, it is directly related to parental depression and bipolar disorder. The sleep quality descriptor (denoted as Insomnia) is not related directly to lifetime depression, but it is in a direct relationship with current depressive symptoms (pDir = 0.999) and neuroticism (pDir = 0.999) with a high probability.
Social factors. Mental health related social factors such as being able to confide in someone (denoted as Confide), and the sense of satisfaction (Satisfaction) are only transitively connected to lifetime depression (pTrans= 0.2 and 0.6 respectively) as no direct connection was detected. Regarding current depressive symptoms, the probability of a direct relationship with satisfaction is high (pDir= 1.0), and moderately high in case of Confide (pDir= 0.6).
Pain descriptors. Variables describing short or long-term presence of pain (i.e. Headache, Back pain, Stomach or abdominal pain, Neck or shoulder pain, Knee pain, and Pain allover) are not in a direct relationship with life- time depression (pDir = 0.0). Instead, results indicate transitive relationships with lifetime depression such that most pain related variables are mediated by current depressive symptoms. For example, the probability of a direct relationship between neck or shoulder pain and lifetime depression is negligible (pDir= 0.0), whereas a transitive relationship is more probable having a moderately high probability (pTrans = 0.629). In contrast to this, the prob- ability of a direct relationship with current depressive symptoms is remarkably high (pDir= 1.0). In addition, the transitive relationship of headache with lifetime depression (pTrans = 0.8) is not only mediated by current depres- sive symptoms (pDir= 1.0), but also mediated by neuroticism with which it has a direct relationship with high probability (pDir = 0.8).
Dietary change and metabolic descriptors. Variables related to dietary change and metabolism have multiple relations with lifetime depression and current depressive symptoms. Body fat percentage (Body fat), which is highly correlated with the obesity descriptor (Obesity), is in a direct relationship with lifetime depression with Figure 1. Bayesian map of the UKB envirome related to reported lifetime depression based on Bayesian relevance analysis. Nodes represent investigated variables, their coloring corresponds to the respective variable group as follows. (A) Mental health descriptors - yellow, (B) Social factors - dark green, (C) Childhood descriptors - lime, (D) Parental illnesses - brown, (E) Lifestyle and sports - light green, (F) Diet and metabolism - gold, (G) Blood pressure - orange, (H) Financial background and qualification - dark blue, (I) Pain - purple, (J) Life stress - light brown, (K) Falls - pink, and reported lifetime depression - red. An edge between two nodes represents a direct relationship, and its width is proportional to the Bayesian edge probability which takes into account both possible edge directions assuming an underlying Bayesian network. Edges with a probability lower than 0.5 are omitted.
high probability (pDir= 0.8). In contrast with body fat percentage, obesity is not in a direct relationship with life- time depression (pDir= 0.0), and the probability of direct connection with current depressive symptoms is also low (pDir= 0.2). On the other hand, a transitive relationship is more probable in both cases (pTrans= 0.6 and 0.8 respec- tively). Furthermore, weight change is directly connected only to current depressive symptoms (pDir= 1.0). In addition, the metabolism descriptor (denoted as Metabolic rate) is not in a direct relationship with either lifetime depression or current depressive symptoms (pDir= 0.0). Similarly to the obesity descriptor, the variable indicating a substantial change in diet (Dietary change) is not in a direct relationship with lifetime depression (pDir= 0.0), and the probability of a transitive relationship with current depressive symptoms is higher (pTrans= 0.8) than that of a direct (pDir= 0.2).
Sports and physical activity. Physical activity related variables such as strenuous sports, exercises, walking, vigorous physical activity, moderate physical activity are not in a direct relationship with lifetime depression, instead corresponding transitive relationships are of moderate probability (strenuous sports pTrans = 0.6, exercises pTrans= 0.4, vigorous physical activity pTrans= 0.4, walking pTrans = 0.2) mostly mediated by body fat. Concerning current depressive symptoms, the probability of direct relationships with physical activity descriptors is moderate (strenuous sports pDir= 0.6, exercises pDir = 0.6, vigorous physical activity pDir = 0.4, walking pDir = 0.2).
Financial background and qualification. Among the investigated socioeconomic status descriptors, the Townsend deprivation index (Townsend) is not connected directly to lifetime depression (pDir= 0.0), but there is a moderate probability of a transitive relationship (pTrans= 0.6) mediated by current depressive symptoms. The probability of a direct relationship between household income and lifetime depression is relatively low (pDir= 0.2), although it plays a remarkable role in some of the interactions detailed later. Regarding current depressive symp- toms, a transitive relationship with household income is more probable (pTrans= 0.6) than a direct one (pDir= 0.4).
Qualification (that is whether the subject has a college or university degree) is not connected directly to either
Variable
Lifetime
depression Current depressive symptoms
Variable
Lifetime
depression Current depressive symptoms
DIR TRN DIR TRN DIR TRN DIR TRN
Age 0.00 0.80 0.999 0.001 Neuroticism 0.999 0.001 0.999 0.001
Alcohol intake 0.00 0.40 0.00 0.8 Obesity 0.00 0.60 0.20 0.80
Back pain 0.00 0.40 1.00 0.00 Pain allover 0.00 0.80 1.00 0.00
Body fat 0.80 0.00 0.00 1.00 Parental Alzheimer’s 0.00 0.80 0.00 1.00
Body size 0.00 0.40 0.00 1.00 Parental bronchitis 0.00 0.498 0.001 0.999
Breastfed 0.00 0.40 0.00 1.00 Parental cancer 0.00 0.80 0.00 0.999
Confide 0.00 0.20 0.60 0.40 Parental depression 0.999 0.00 0.00 1.00
Current depressive
symptoms 0.999 0.001 — — Parental diabetes 0.00 0.60 0.00 1.00
Diastolic 0.00 0.60 0.00 1.00 Parental heart disease 0.00 0.60 0.00 1.00
Dietary change 0.00 0.20 0.20 0.80 Parental high bloodpressure 0.00 0.20 0.00 1.00
Exercises 0.00 0.40 0.60 0.40 Parental Parkinson’s 0.00 0.80 0.00 1.00
Facial pain 0.00 0.20 0.00 0.80 Parental stroke 0.00 0.80 0.00 1.00
Falls 0.00 0.40 1.00 0.00 Pulse 0.00 0.20 0.00 1.00
First intercourse 0.00 0.20 0.00 1.00 Qualification 0.00 0.20 0.00 1.00
Hand 0.00 0.20 0.00 1.00 Risk taking 0.00 0.20 0.00 1.00
Headache 0.00 0.80 1.00 0.00 Satisfaction 0.00 0.60 1.00 0.00
Heavy DIY 0.00 0.60 0.40 0.60 Sex 0.00 0.80 0.00 1.00
Height size 0.00 0.20 0.00 0.999 Social activity 0.00 0.40 0.20 0.80
Hip pain 0.00 0.475 0.474 0.326 Sports 0.00 0.60 0.60 0.40
Household income 0.20 0.00 0.40 0.60 Stomach/abdominal pain 0.00 0.201 0.80 0.20
Insomnia 0.00 0.00 0.999 0.00 Systolic 0.00 1.00 0.20 0.80
Knee pain 0.00 0.40 0.60 0.40 Tobacco smoking 0.00 0.20 0.20 0.80
Life stress 0.20 0.40 1.00 0.00 Townsend 0.00 0.60 0.60 0.40
Light DIY 0.00 0.20 0.00 1.00 Vigorous physical 0.00 0.40 0.40 0.60
Bipolar disorder 0.00 0.385 0.187 0.812 Visits 0.00 0.20 0.00 1.00
Maternal smoking 0.00 0.40 0.00 1.00 Walking 0.00 0.20 0.20 0.80
Metabolic rate 0.00 0.20 0.00 1.00 Walking physical 0.00 0.20 0.00 1.00
Moderate physical 0.00 0.20 0.00 1.00 Weight change 0.00 0.60 1.00 0.00
Table 1. The posterior probability of variable relationships with respect to reported lifetime depression and current depressive symptoms. Displayed relationship types include direct relationship denoted as DIR, and transitive relationship denoted as TRN. Transitive relationship means that there are one or more other variables mediating the effect of a selected variable on the target variable.
lifetime depression (pDir = 0.001) or to current depressive symptoms (pDir = 0.0). However, the probability that there is a transitive relationship between current depressive symptoms and qualification is high (pDir= 1.0).
Parental illnesses. Parental depression is the only parental illness descriptor that is directly related to lifetime depression with high probability (pDir = 0.999), all other descriptors are only transitively related with various degrees of probability. Results also indicate a transitive relationship with current depressive symptoms with high probability for all such descriptors (pTrans > 0.999).
Other factors. According to our results, alcohol intake and tobacco consumption are not in a direct relation- ship with lifetime depression (pDir= 0.0), the probability of a transitive relationship is also low in both cases (pTrans= 0.4 and 0.2 respectively). However, both variables are in a transitive relationship with current depressive symptoms with high probability (pTrans= 0.8).
Age and sex are both not directly connected to lifetime depression, although there is a high probability of a transitive relationship. Regarding current depressive symptoms, the probability of a direct relationship with age is high (pDir= 0.999), while sex is transitively related with high probability (pTrans= 1). Among the investigated childhood descriptors none of the variables are in a direct relationship with lifetime depression, however it should be noted that childhood trauma items were not available for this analysis.
Relevance of environmental factors. Identifying direct relationships is a major step towards discovering relevant factors, however relevance can be interpreted in multiple ways. Here we utilize the strong relevance con- cept according to which strongly relevant variables of a selected target variable consist of (1) direct relationships and (2) interaction terms that have a joint effect on the target involving another variable. This requires the analysis of relevant sets of variables with respect to the target variable. In a Bayesian structural approach, strong relevance (or relevance for short) of a variable is quantified by the posterior probability of the occurrence of the variable in possible models as a direct relationship or as an interaction term with respect to the target (see Strong relevance section of methods for details).
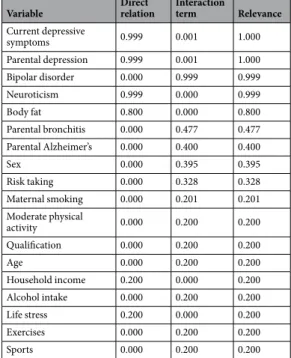
Table 2 shows posterior probabilities of strong relevance (pRel) for relevant variables with respect to lifetime depression using a cutoff value of 0.2 including both direct and interaction type relations. These results indicate that in addition to the previously investigated direct relationships, i.e. current depressive symptoms (pRel= 1.0), neuroticism trait (pRel= 0.999), parental depression (pRel= 1.0), and body fat percentage (pRel= 0.8), there are sev- eral other variables that are relevant with respect to lifetime depression to some extent due to multivariate inter- actions. In other words, there are interaction terms forming multivariate interaction patterns involving lifetime depression. For example, sex, risk taking, parental Alzheimer’s disease and parental bronchitis are such factors that have a moderate probability of being interaction terms, and thus they can be considered as strongly relevant variables to a certain degree (pRel> 0.3). On the other hand, household income and life stress are in a direct rela- tionship with lifetime depression with a low but non-negligible probability (pRel> 0.2) and consequently can be considered worthy of further investigation.
Variable Direct
relation Interaction
term Relevance
Current depressive
symptoms 0.999 0.001 1.000
Parental depression 0.999 0.001 1.000
Bipolar disorder 0.000 0.999 0.999
Neuroticism 0.999 0.000 0.999
Body fat 0.800 0.000 0.800
Parental bronchitis 0.000 0.477 0.477 Parental Alzheimer’s 0.000 0.400 0.400
Sex 0.000 0.395 0.395
Risk taking 0.000 0.328 0.328
Maternal smoking 0.000 0.201 0.201
Moderate physical
activity 0.000 0.200 0.200
Qualification 0.000 0.200 0.200
Age 0.000 0.200 0.200
Household income 0.200 0.000 0.200
Alcohol intake 0.000 0.200 0.200
Life stress 0.200 0.000 0.200
Exercises 0.000 0.200 0.200
Sports 0.000 0.200 0.200
Table 2. Probability of strong relevance and dependency types with respect to lifetime depression. Displayed relationship types include direct relations and interaction terms. Associated posterior probabilities reflect the likeliness that a variable is in a given type of relationship with lifetime depression. The probability of strong relevance is the sum of these probabilities.
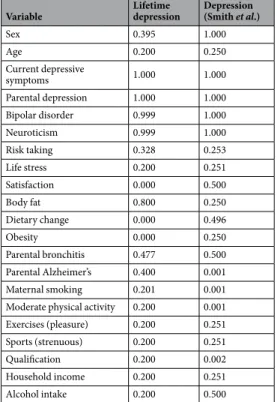
In addition, we investigated relevant relationships with respect to probable depression diagnosis variables (single depressive episode, moderate depression, severe depression) created by Smith et al.26 and compared it to lifetime depression as a validation (see the Validation section of methods for details). Results indicate that the envirome map of lifetime depression is similar to that of probable depression diagnosis, such that it consists of similar patterns regarding current depressive symptoms, neuroticism, parental depression, and several moder- ately relevant factors. A notable difference between the two relationship maps is that while lifetime depression is directly connected only to body fat percentage among diet and metabolism related variables, in case of probable depression diagnosis this relationship is partially replaced by connections with obesity and dietary change.
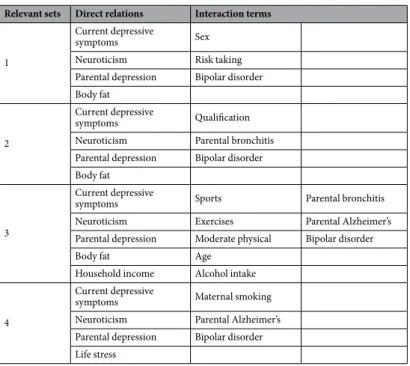
environment-environment interactions. Structural interactions. In order to analyze interactions first we investigated strongly relevant sets (with respect to lifetime depression) provided by the applied BMLA method (see the methods section for details). These sets can also be called as structurally relevant sets of variables as they are based on the dependency structure of variables. Table 3 presents the top 4 most probable structurally relevant variable sets detailing the components of possible structural interaction patterns.
Generally, structural interaction patterns have at least one term that has an individual main effect (direct relationship) with respect to the target variable, while the other terms typically have minor or negligible effects individually. The key feature of interactions is the multivariate context, in which a particular set of variables have a considerable effect on the target variable. This context is provided either by the variable with the individual main effect or by additional variables.
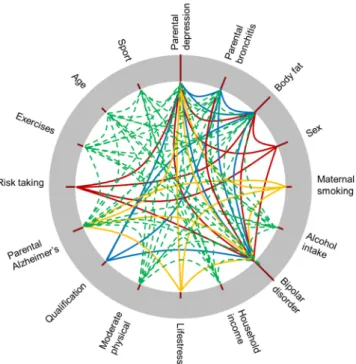
Figure 2 shows possible structural interactions among elements of each relevant variable set using differently colored markers. Variables representing the neuroticism trait, current depressive symptoms, and parental depres- sion are present in all sets as direct relationships with individual main effects. In addition, parental depression plays a central role in several structural interactions by providing context for interaction terms (this assessment requires the analysis of possible dependency structures of variables not discussed here in details). Similarly, body fat percentage (pDir= 0.800), life stress (pDir= 0.200) and household income (pDir= 0.200) are in a direct relation- ship with lifetime depression and also play roles in interaction patterns. Bipolar disorder on the other hand is present in almost all relevant sets, but only as an interaction term (pInt= 0.999).
According to Table 3 the most probable relevant set consists of risk taking, sex, parental depression, body fat percentage, bipolar disorder, current depressive symptoms and neuroticism. Based on Table 2, variables such as risk taking (pInt= 0.328), sex (pInt= 0.395) and bipolar disorder (pInt= 0.999) are potential interaction terms, whereas parental depression, body fat percentage, neuroticism and current depressive symptoms are potential main effects of these structural interactions. The second sets includes qualification (pInt= 0.200), parental bron- chitis (pInt= 0.477), and bipolar disorder as potential interaction terms. The third set contains several interac- tion terms out of which exercises (pInt= 0.200), sports (pInt= 0.200), moderate physical activity (pInt= 0.200), age (pInt= 0.200), alcohol intake (pInt= 0.200) are more likely to form an interaction pattern with household income and body fat as a main effect (according to additional analysis of possible dependency structures). Finally, the fourth set consists of maternal smoking (pInt= 0.201), parental Alzheimer’s (pInt= 0.400), and bipolar disorder as interaction terms and life stress as a main effect instead of body fat percentage.
These results (and structural interactions in general) indicate that based on the dependency structure these variables have a multivariate effect on the target. In most cases the individual relevance of these variables is
Relevant sets Direct relations Interaction terms
1
Current depressive
symptoms Sex
Neuroticism Risk taking Parental depression Bipolar disorder Body fat
2
Current depressive
symptoms Qualification
Neuroticism Parental bronchitis Parental depression Bipolar disorder Body fat
3
Current depressive
symptoms Sports Parental bronchitis
Neuroticism Exercises Parental Alzheimer’s
Parental depression Moderate physical Bipolar disorder
Body fat Age
Household income Alcohol intake
4
Current depressive
symptoms Maternal smoking
Neuroticism Parental Alzheimer’s Parental depression Bipolar disorder Life stress
Table 3. Relationship types of variables within strongly relevant sets.
moderate or low with respect to the target, but they have a higher relevance as a pattern. Although structural interactions do not provide information on the parametric nature of these effects, they can be utilized to direct effect size analysis efforts.
Parametric interactions. In most cases when interactions are considered, the parametric aspect of relevance is investigated by applying various effect size measures such as the odds ratio for a binary target. The challenge is that the individual effect of interaction terms tends to be moderate or small, whereas their joint effect is con- siderably larger. The latter requires a multivariate effect size measure that is capable of computing an odds ratio for value configurations of multiple variables. Since selecting the base configuration of values - against which all other configurations are compared - is non-trivial, we utilized a value configuration relative odds ratio, i.e. a given value configuration is compared against all other possible configurations (see the Multivariate effect size measure section of methods for details).
Structural interaction results indicate higher-order interactions among members of relevant variable sets, however subsets of these variables can also be of interest. Furthermore, note that these interactions are interpreted on the level of variables and provide no further insight neither on the value level nor on the parametric level, i.e. variable value configurations. In order to investigate interactions on a parametric level additional analysis is required which involves the arbitrary selection of a subset of variables from a relevant set. For example, we can investigate parametric aspects of the interaction between body fat and sporting activities with respect to lifetime depression based on a relevant set of variables. Note that this selection is arbitrary as any subset of this relevant set could be technically investigated. Table 4 shows the parametric aspect of this interaction involving strenuous sports and exercises. In general, both physical activity types provide a protective effect with respect to lifetime depression, whereas higher body fat percentage presents a risk (OR(high versus normal) = 1.56). Regarding the joint effects of body fat and physical activity descriptors, the protective effect of doing sports or exercises is larger in case of subjects with high body fat percentage (e.g. CR-OR(Sports: No, Body fat: High) = 1.62, CR-OR(Sports:
Figure 2. Environment-environment interactions. Variables connected with the same marker represent strongly relevant sets of variables that form higher-order interactions affecting lifetime depression. The height of the red column for a given variable corresponds to the probability of relevance of that variable.
Body fat (I.) I. + Sports (II.A) I. + Exercises (II.B)
Normal
CR-OR CR-OR CI95%
CR-OR CI95%
Low High Low High
0.64 No 0.74 0.70 0.78 No 0.90 0.84 0.96
Yes 0.49 0.43 0.55 Yes 0.59 0.55 0.63
High 1.56 No 1.62 1.53 1.71 No 1.65 1.56 1.74
Yes 0.72 0.62 0.84 Yes 0.98 0.92 1.04
Table 4. Parametric interactions of Body fat, Exercises and Sports with respect to lifetime depression. CR-OR and CI95% denotes the configuration relative odds ratio and its 95% confidence interval respectively.
Yes, Body fat: High) = 0.72) than in case of subjects with normal body fat percentage (e.g. CR-OR(Sports: No, Body fat: Normal) = 0.74, CR-OR(Sports: Yes, Body fat: Normal) = 0.49). Compared to strenuous sports, the protective effect of exercises is smaller in both the normal (CR-OR(Exercises: No, Body fat: Normal) = 0.9, CR-OR(Exercises: Yes, Body fat: Normal) = 0.59) and high (CR-OR(Exercises: No, Body fat: High) = 1.56, CR-OR(Exercises: Yes, Body fat: High) = 0.92) body fat subgroups (shown in Fig. 3).
Additionally, a detailed analysis of several interaction patterns is provided as additional information.
Synergistic effects. Interactions and synergistic effects can be distinguished based on the constraints they impose on the dependency structure. Whereas interactions can be related to specific dependency structures, syn- ergistic effects are more general in the sense that there is no such hierarchy implied concerning the dependency structure of variables. Although it is reasonable to assume that variables with distinct individual main effects are among the first to be investigated for additional synergistic effects.
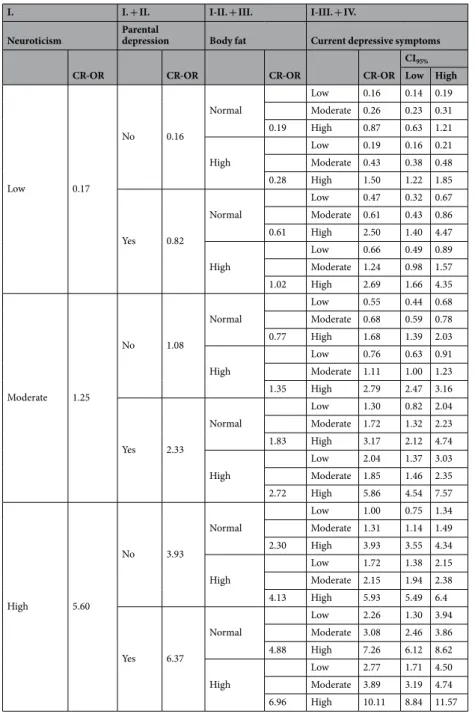
In our case Neuroticism, Parental depression, Current depressive symptoms, and Body fat variables can be considered as a set of relevant variables with synergistic effects. The BMLA method identified each of these varia- bles as strongly relevant and directly connected to lifetime depression. As a set of relevant variables, they are part of the majority of possible strongly relevant variable sets. To quantify synergistic effects from a parametric aspect, a multivariate effect size analysis can be performed similarly to that which was applied in case of parametric inter- actions. Table 5 shows configuration relative odds ratios for various Neuroticism - Parental depression - Body fat - Current depressive symptoms subgroups. Both the neuroticism score and current depressive symptoms affect Figure 3. Parametric interactions of Body fat and sporting activity descriptors: Exercises and Sports.
lifetime depression according to severity, a higher value conveys a larger risk of lifetime depression than a lower one (specifically OR(Neuroticism: Moderate vs. Low) = 3.44, OR(Neuroticism: High vs. Low) = 9.26, OR(Current depressive symptoms: Moderate vs. Low) = 2.41, OR(Current depressive symptoms: High vs. Low) = 10.66).
Comparatively, the individual effect of parental depression (OR(Yes vs. No) = 2.84) and body fat (OR(High vs.
Normal) = 1.56) is lower. Results in Fig. 4 are displayed separately based on neuroticism categories.
In general, the presence of parental depression entails higher risk for lifetime depression, as does high body fat percentage. These effects are more pronounced in subgroups with high neuroticism scores. In addition, the current depressive symptoms variable influences the effect size of a particular configuration to the largest extent.
The before-mentioned effects of risk factors are observable especially in case of high current depressive symptom scores. The two extreme points of variable configurations in terms of effect size are: (1) subjects with high neu- roticism score, high current depressive symptoms score, high body fat percentage, and with parental depression (CR-OR: 10.11), and (2) subjects with low neuroticism score, low current depressive symptoms score, normal body fat percentage, and no parental depression (CR-OR: 0.16). In terms of ordinary odds ratio, this means that subjects with the former traits are 52.61 times more likely to suffer from depression than subjects with the latter traits.
I. I. + II. I-II. + III. I-III. + IV.
Neuroticism Parental
depression Body fat Current depressive symptoms
CR-OR CR-OR CR-OR CR-OR
CI95%
Low High
Low 0.17
No 0.16
Normal
Low 0.16 0.14 0.19
Moderate 0.26 0.23 0.31
0.19 High 0.87 0.63 1.21
High
Low 0.19 0.16 0.21
Moderate 0.43 0.38 0.48
0.28 High 1.50 1.22 1.85
Yes 0.82
Normal
Low 0.47 0.32 0.67
Moderate 0.61 0.43 0.86
0.61 High 2.50 1.40 4.47
High
Low 0.66 0.49 0.89
Moderate 1.24 0.98 1.57
1.02 High 2.69 1.66 4.35
Moderate 1.25
No 1.08
Normal
Low 0.55 0.44 0.68
Moderate 0.68 0.59 0.78
0.77 High 1.68 1.39 2.03
High
Low 0.76 0.63 0.91
Moderate 1.11 1.00 1.23
1.35 High 2.79 2.47 3.16
Yes 2.33
Normal
Low 1.30 0.82 2.04
Moderate 1.72 1.32 2.23
1.83 High 3.17 2.12 4.74
High
Low 2.04 1.37 3.03
Moderate 1.85 1.46 2.35
2.72 High 5.86 4.54 7.57
High 5.60
No 3.93
Normal
Low 1.00 0.75 1.34
Moderate 1.31 1.14 1.49
2.30 High 3.93 3.55 4.34
High
Low 1.72 1.38 2.15
Moderate 2.15 1.94 2.38
4.13 High 5.93 5.49 6.4
Yes 6.37
Normal
Low 2.26 1.30 3.94
Moderate 3.08 2.46 3.86
4.88 High 7.26 6.12 8.62
High
Low 2.77 1.71 4.50
Moderate 3.89 3.19 4.74 6.96 High 10.11 8.84 11.57
Table 5. Synergistic effects of Neuroticism, Parental depression, Body fat, and Current depressive symptoms with respect to reported lifetime depression.
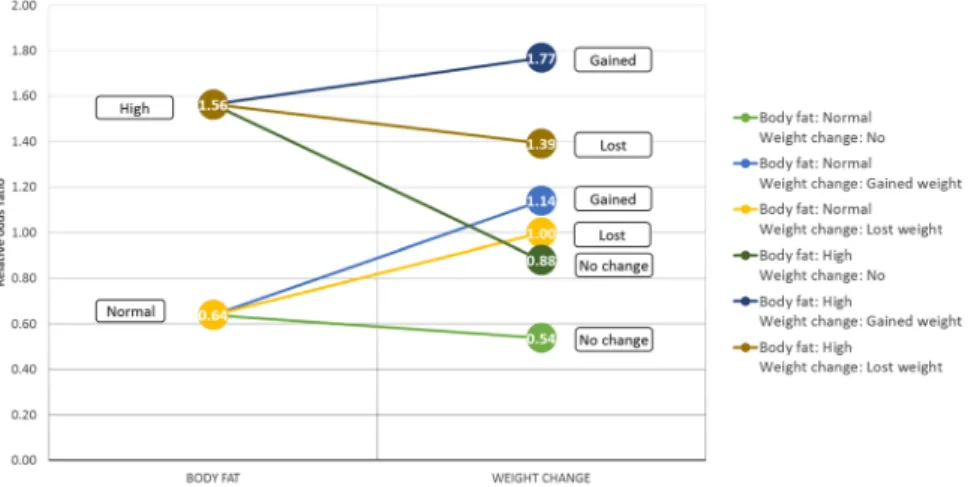
Furthermore, we investigated another synergistic effect related to body fat percentage which involves weight change and dietary change. Weight change was found transitively relevant with respect to lifetime depression and has a considerable effect size related to depression (CR-OR(Weight change: No change) = 0.57, CR-OR(Weight change: Weight gain) = 1.68, CR-OR(Weight change: Weight loss) = 1.24). Table 6 displays joint effect sizes regarding body fat percentage and weight change. Results indicate that subjects with high body fat percentage have higher risk of lifetime depression compared to similar configurations with normal body fat percentage (see Fig. 5). Concerning weight change, gaining weight conveys a larger risk with respect to lifetime depression Figure 4. Synergistic effects of Neuroticism, Parental depression, Body fat, and Current depressive symptoms.
than losing weight in both body fat subgroups (e.g. CR-OR(Weight change: Gain, Body fat: High) = 1.77, CR-OR(Weight change: Lost, Body fat: High) = 1.39).
Moreover, the potential effect of dietary change was also investigated in conjunction with the effects of body fat and weight change. Supplementary Table S20 shows multivariate effect sizes for various Body fat, Dietary change and Weight change variable configurations. The previously observed effect that weight gain serves as the largest risk factor remains valid in all body fat - dietary change subpopulations.
predictive power. In addition to relevance, the predictive power of variables can also be of interest when building a predictive model. In most cases variables that are directly relevant to a target are among those that have the highest predictive power with respect to the target. However, it should be also taken into account that (1) some strongly relevant variables are highly predictive only in a multivariate context, i.e. as part of a set of predic- tor variables, and (2) there are variables that are only transitively relevant but are highly predictive.
In order to investigate the predictive nature of specific variable sets and also individual variables we utilized a deep neural network based classifier having lifetime depression as the target (class) variable. For the purposes of evaluation we used an information theoretic measure (cross-entropy), residual variance, and a predictive perfor- mance measure. The reduction of residual variance due to a feature was also computed by comparing the meas- ured residual variance to that of a random classifier. Furthermore, the predictive performance of a feature was also compared to the performance of a saturated model containing all variables (for further details see the Deep neural network based modeling section in methods).
Table 7 displays measures related to some of the most significant variables in terms of association with life- time depression. Results indicate that the neuroticism trait and current depressive symptoms are the most rel- evant variables as they have the best scores both in terms of reduction of residual variance (19.02% and 16.67%
respectively) and of predictive performance (97.17% and 88.05% relative to the saturated model). Other variables achieve remarkably lower reduction in residual variance. Parental depression is also among the highly predictive variables (predictive rank: 3). Interestingly, the variable describing satisfaction (association rank: 3) has one of the lowest scores among these variables in terms of residual relevance reduction (1.21%, rank: 10) and also in terms of predictive performance (75.4%, rank: 11). Life stress and household income have smaller predictive power (79.41%, rank: 4 and 78.02%, rank: 7 respectively) compared to parental depression. Similarly, the BMLA method detected both variables having a direct relationship with lifetime depression but with a considerably lower probability than parental depression. To the contrary, Headache was not detected as a relevant variable even though it achieved better results in residual variance reduction (5.46%, rank: 3) than life stress (2.93%, rank: 7) and slightly better predictive power (78.53%, predictive rank: 6) than household income (78.02%, predictive rank:
Body fat (I.) I. + Weight change (II.)
CR-OR CR-OR
CI95%
Low High
Normal 0.64
No 0.54 0.50 0.57
Gained weight 1.14 1.04 1.26 Lost weight 1.00 0.90 1.11
High 1.56
No 0.88 0.83 0.94
Gained weight 1.77 1.67 1.88 Lost weight 1.39 1.28 1.51
Table 6. Synergistic effects of Body fat and Weight change with respect to lifetime depression. CR-OR and CI95%
denotes the configuration relative odds ratio and its 95% confidence interval respectively.
Figure 5. Synergistic effects of Body fat and Weight change.
7). According to the envirome map, this lack of a direct effect of headache on lifetime depression is probably due to the mediatory role of neuroticism and current depressive symptoms. In other words, despite the fact that the presence of headache has a highly significant association with lifetime depression (association rank: 5) and has considerable predictive power, these properties do not entail strong relevance.
Furthermore, the body fat descriptor is among the less predictive variables (individually) on this list (predic- tive rank: 9). In a multivariate context however, body fat along with neuroticism, current depressive symptoms and parental depression forms one of the most highly predictive variable sets with respect to lifetime depression.
Supplementary Table S19 shows the predictive performance of this set and that of the most relevant sets of vari- ables identified by the BMLA.
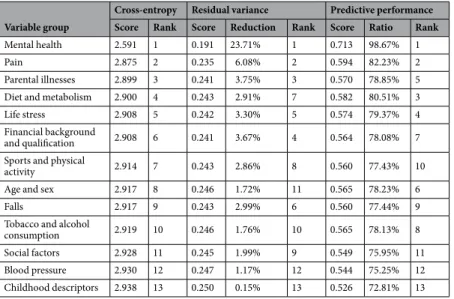
In addition, the predictive power of variable groups (e.g. social factors, financial background, etc.) was also investigated using a deep neural network classifier. In these cases only the variables related to a selected group formed the input layer of the network. Table 8 displays cross-entropy, residual variance and predictive perfor- mance measures and corresponding ranks for each variable group. Cross-entropy measured the remaining uncertainty between predicted and actual outputs of the classifier. According to results, mental health descriptors have the highest predictive power with respect to lifetime depression, followed by pain descriptors, diet and metabolism factors, life stress and parental illnesses. Note that childhood descriptors only consisted of general factors such as body size, height, and maternal smoking. Childhood trauma and maltreatment indicators (with the exception of first sexual intercourse) were not included in this analysis.
Variable
Association Residual variance Predictive performance
−Log (p) Rank Variance Reduction Rank Score Ratio Rank
Neuroticism 800 1 0.203 19.02% 1 0.702 97.17% 1
Current depressive
symptoms 800 2 0.208 16.67% 2 0.636 88.05% 2
Satisfaction 703.3 3 0.247 1.21% 10 0.545 75.40% 11
Parental depression 528.1 4 0.238 4.93% 4 0.626 86.61% 3
Headache 388.8 5 0.236 5.46% 3 0.568 78.53% 6
Life stress 377.3 6 0.243 2.93% 7 0.574 79.41% 4
Falls 344.3 7 0.243 2.99% 6 0.560 77.44% 8
Household 291.2 8 0.246 1.47% 9 0.564 78.02% 7
Insomnia 283.7 9 0.242 3.04% 5 0.550 76.15% 10
Weight change 237.4 10 0.249 0.30% 11 0.570 78.85% 5
Body fat 129.9 11 0.246 1.52% 8 0.556 76.89% 9
Table 7. Predictive measures of variables having a highly significant association with lifetime depression. −Log (p) denotes the negative logarithm of the p-value related to the association test. Reduction denotes the residual variance reduction compared to the random classifier. Ratio stands for the ratio of the predictive performance score and to that of a saturated model.
Variable group
Cross-entropy Residual variance Predictive performance Score Rank Score Reduction Rank Score Ratio Rank
Mental health 2.591 1 0.191 23.71% 1 0.713 98.67% 1
Pain 2.875 2 0.235 6.08% 2 0.594 82.23% 2
Parental illnesses 2.899 3 0.241 3.75% 3 0.570 78.85% 5
Diet and metabolism 2.900 4 0.243 2.91% 7 0.582 80.51% 3
Life stress 2.908 5 0.242 3.30% 5 0.574 79.37% 4
Financial background
and qualification 2.908 6 0.241 3.67% 4 0.564 78.08% 7
Sports and physical
activity 2.914 7 0.243 2.86% 8 0.560 77.43% 10
Age and sex 2.917 8 0.246 1.72% 11 0.565 78.23% 6
Falls 2.917 9 0.243 2.99% 6 0.560 77.44% 9
Tobacco and alcohol
consumption 2.919 10 0.246 1.76% 10 0.565 78.13% 8
Social factors 2.928 11 0.245 1.99% 9 0.549 75.95% 11
Blood pressure 2.930 12 0.247 1.17% 12 0.544 75.25% 12
Childhood descriptors 2.938 13 0.250 0.15% 13 0.526 72.81% 13
Table 8. The predictive power of variable groups with respect to lifetime depression. Reduction denotes the residual variance reduction compared to the random classifier. Ratio stands for the ratio of the predictive performance score and to that of a saturated model.
The superior predictive performance of the mental health group (0.713) was expected as it contained two of the most relevant variables (neuroticism and current depressive symptoms) which also had the highest predictive power. In addition, the sleep quality descriptor (Insomnia) also contributed to the predictive power.
Pain descriptors appear to be the second most predictive group (0.594) containing all pain related varia- bles such as headache. This result indicates that various types of pain descriptors can be correlated with lifetime depression, however in the multivariate context of the environmental factors, these relationships are mediated by other factors.
The third most predictive group is diet and metabolism factors (0.582) which consists of body fat which was found directly relevant with respect to lifetime depression, and several transitively relevant factors such as weight change and the obesity descriptor. In the context of the envirome, this variable group is relevant as some of its effects directly influence lifetime depression.
Following life stress, the parental illnesses variable group is the fifth in the predictive ranking (0.570). Previous analyses revealed that parental depression is the only directly relevant variable within this group, and parental Alzheimer’s disease and bronchitis may play roles in interactions of moderate relevance. As this group represents the hereditary aspect of lifetime depression, these results (i.e. several groups of environmental factors are better predictors) also confirm that investigating environmental factors is essential in predicting depression.
Discussion
Our study investigating the effects of environmental, social, lifestyle, metabolic and mental health factors on life- time depression have shown that a surprisingly small number of core factors mediates the effects of the envirome.
That is the majority of the envirome variables do not have an independent direct and relevant effect and they are only indirectly related to lifetime depression, exerting their effects in a dynamic network via transitive, interac- tive and synergistic relationships. This may also explain why existing environmental effects may be obscured in most studies which consider them individually in an isolated way. This result also implies that a narrowly focused set of factors can shield the effects of the whole envirome, suggesting therapeutic, clinical and pharmacological consequences. This drastic reduction of the set of relevant variables related to MDD by filtering the mediated, non-direct factors was also observed in an earlier study, which investigated the ratio of direct multi-morbidities of MDD among all the statistically associated co-morbidities25.
In our present study the only directly related and also highly relevant factors with respect to lifetime depres- sion were neuroticism, current depressive symptoms, parental depression, and body fat percentage, which factors also mediated the majority of other effects in various ways. First, current depressive symptoms play a central role mediating the effects of a wide range of variables on lifetime depression including financial factors, sporting activity (partially), social factors (partially), insomnia (partially) and most pain descriptors. Second, neuroticism mediates the effects of social factors (partially), insomnia (partially), and some of the pain descriptors (headache).
Third, body fat mediates the effects of most sporting activity and metabolism-related variables. In addition, body fat and parental depression play significant roles in structural interactions involving variables such as life stress, risk taking, maternal smoking, qualification, sport, alcohol consumption and household income. Furthermore, neural network-based analysis of predictive power also indicated that neuroticism, current depressive symptoms and parental depression have the highest predictive capabilities individually, while body fat had a lower predictive power. However, considered jointly as a set these four variables have the highest predictive power and form a core component of the majority of possible strongly relevant sets of variables.
Parametric analysis, besides confirming the relevance of these four variables also revealed synergistic effects between them. While high neuroticism and high current depressive symptoms had the largest individual quan- titative effect on lifetime depression (OR: 9.26 and OR: 10.66 respectively), their synergistic effect coupled with presence of parental depression and high body fat had the largest multivariate odds ratio (CR-OR: 10.11) which indicates a 52.61-fold increased risk for lifetime depression compared to those with low neuroticism, low current depressive symptoms, low body fat and no parental depression (CR-OR: 0.16).
The complex pattern of relationships between the identified core factors and their role in communicating the relationship of several other factors on lifetime depression is novel compared to previous studies14,15. These core variables, however, have been previously implicated in association with lifetime depression in individual studies. Nonetheless, a closer look may also reveal their role in influencing the effect of other environmental variables as well. The strong relevance of parental depression with respect to lifetime depression as well as its high predictive capacity found in our study may in part reflect the significant heritability and familial aggregation of major depression27. However, while heritability of major depression is estimated from approximately 37% in gen- eral population samples27 up to 75% in severely depressed recurrent depressive samples28, the effects of parental depression on mood disorders in off-springs go beyond genetic transmission29. This may determine early envi- ronmental influences including rearing and financial conditions, as well as possible early neglect and abuse on the one hand, and transmission of coping strategies and shaping character traits and behaviors by model learning on the other30–32. These factors may impact eliciting and responding to depression-relevant environmental events and stressors lasting into adulthood33, and may also influence future social, lifestyle and metabolic status34,35, although it must be noted that we had not included information on the timing of occurrence of parental depres- sion within the lifetime of our subjects and whether it was paternal or maternal, and our data does not permit drawing conclusions concerning the direction of effects.
Similarly, neuroticism, besides its impact as a vulnerability factor for risk of depression36–43, with possible overlapping genetic susceptibility4,44–46 is one of the fundamental traits of personality associated with emotional instability, negativity, increased vigilance and reactibility for negative environmental cues and a tendency for mal- adaptive reactiveness upon stressors36. Our present results confirm not only the fundamental role of Neuroticism in lifetime depression but also its central role in mediating effects of other relevant factors within the envirome.