Brain Structure and Function (2019) 224:2061–2078 https://doi.org/10.1007/s00429-019-01886-w
ORIGINAL ARTICLE
Secretagogin expression in the vertebrate brainstem with focus
on the noradrenergic system and implications for Alzheimer’s disease
Péter Zahola1,2 · János Hanics1,2 · Anna Pintér2 · Zoltán Máté3 · Anna Gáspárdy2 · Zsófia Hevesi1,4 · Diego Echevarria5 · Csaba Adori6 · Swapnali Barde6 · Beáta Törőcsik7 · Ferenc Erdélyi3 · Gábor Szabó3 · Ludwig Wagner8 · Gabor G. Kovacs9 · Tomas Hökfelt6 · Tibor Harkany4,6 · Alán Alpár1,2
Received: 20 November 2018 / Accepted: 3 May 2019 / Published online: 29 May 2019
© The Author(s) 2019
Abstract
Calcium-binding proteins are widely used to distinguish neuronal subsets in the brain. This study focuses on secretagogin, an EF-hand calcium sensor, to identify distinct neuronal populations in the brainstem of several vertebrate species. By using neural tube whole mounts of mouse embryos, we show that secretagogin is already expressed during the early ontogeny of brainstem noradrenaline cells. In adults, secretagogin-expressing neurons typically populate relay centres of special senses and vegetative regulatory centres of the medulla oblongata, pons and midbrain. Notably, secretagogin expression overlapped with the brainstem column of noradrenergic cell bodies, including the locus coeruleus (A6) and the A1, A5 and A7 fields.
Secretagogin expression in avian, mouse, rat and human samples showed quasi-equivalent patterns, suggesting conservation throughout vertebrate phylogeny. We found reduced secretagogin expression in locus coeruleus from subjects with Alzhei- mer’s disease, and this reduction paralleled the loss of tyrosine hydroxylase, the enzyme rate limiting noradrenaline synthesis.
Residual secretagogin immunoreactivity was confined to small submembrane domains associated with initial aberrant tau phosphorylation. In conclusion, we provide evidence that secretagogin is a useful marker to distinguish neuronal subsets in the brainstem, conserved throughout several species, and its altered expression may reflect cellular dysfunction of locus coeruleus neurons in Alzheimer’s disease.
Keywords Alzheimer’s disease · Calcium-binding proteins · Locus coeruleus · Norepinephrine · Phylogenetic conservation
Introduction
Our brainstem harbours a wealth of distinctly or ambigu- ously demarcated cell groups with various functions serving basic physiological needs. Pathways of special senses have relay centres in the cranial brainstem: the superior colliculus
Electronic supplementary material The online version of this article (https ://doi.org/10.1007/s0042 9-019-01886 -w) contains supplementary material, which is available to authorized users.
* Alán Alpár
Alpar.Alan@med.semmelweis-univ.hu
1 SE NAP B Research Group of Experimental Neuroanatomy and Developmental Biology, Semmelweis University, Budapest, Hungary
2 Department of Anatomy, Semmelweis University, Budapest, Hungary
3 Institute of Experimental Medicine, Hungarian Academy of Sciences, Budapest, Hungary
4 Department of Molecular Neurosciences, Center for Brain Research, Medical University of Vienna, 1090 Vienna,
5 Institute of Neuroscience, University of Miguel Hernandez de Elche, Alicante, Spain
6 Department of Neuroscience, Karolinska Institutet, Biomedicum 7D, SE-17165 Stockholm, Sweden
7 Department of Medical Biochemistry, Semmelweis University, Budapest, Hungary
8 Department of Internal Medicine III, Medical University of Vienna, Vienna, Austria
9 Institute of Neurology, Medical University of Vienna, Vienna, Austria
and the lateral geniculate nucleus of the visual system, and the inferior colliculus and the medial geniculate nucleus of the acoustic system are situated in the mesencephalon.
Cranial nerve nuclei of different modalities are arranged in logical mediolateral and craniocaudal orders, reaching from the caudal medulla oblongata to the cranial midbrain.
These include stations of specific sensory pathways, like the cochlear and vestibular nuclei in the caudal pons, or com- plex vegetative centres, like the solitary tract nucleus in the medulla oblongata. Other autonomic integrative centres, like the periaqueductal grey involved in behavioural responses to threatening stimuli (Faull et al. 2019) and opioid modula- tion of pain (Martins and Tavares 2017), or the parabrachial nuclear complex controlling fluid and food homoeostasis, cardiovascular functions (Davern 2014) and body tempera- ture (Morrison and Nakamura 2011) appear as independent nuclei in the brainstem. Activating systems using biogenic amines as neurotransmitters have their origin in the brain- stem: noradrenaline- (A1–A6 fields), adrenaline- (C1–C3 fields) or serotonin-containing (B1–B8 fields) neurons from nuclei, and their projections richly innervate many forebrain regions, the cerebellum and the spinal cord. The nuclei and centres of these different systems (Fig. 1) are intertwined and may in the brainstem even overlap, which has made their identification and separation an ongoing challenge.
The classical neuroanatomical toolbox including, e.g., ubiquitous neuronal staining or metal-based impregnations, was the first pioneering step to identify major brainstem centres. The advent of tract tracing and immunohistochem- istry opened a new dimension in understanding the layout of brainstem circuits. Researchers not only identified hitherto unknown nuclei, but were able to demarcate subregions, fur- ther unravelling cellular heterogeneity within cell groups previously thought to be homogenous (Dahlstroem and Fuxe 1964; Ljungdahl et al. 1978; Markia et al. 2008; Palkovits 1999; Zaborszky et al. 1984). Although chemogenetic and optogenetic tools brought a quantum leap in the functional classification of neurons, neurochemical markers remain of foremost importance to identify neuronal populations in the brain (Rees et al. 2017), with calcium-binding proteins (CaBPs) being common-choice candidates to distinguish cell types or nuclei (Andressen et al. 1993; Freund and Buzsáki 1996; Riedel et al. 2002).
Activation of signalling pathways is a typical calcium (Ca2+)-dependent mechanism with Ca2+-sensor proteins specifying downstream protein–protein interactions (Skelton et al. 1994). Secretagogin, a Ca2+-sensor protein (Wagner et al. 2000), undergoes conformational changes upon Ca2+
binding (Rogstam et al. 2007) to primarily affect protein turnover and exocytosis (Gartner et al. 2007). In agreement with its involvement in the exocytotic machinery, secre- tagogin, found in the mammalian rodent and non-primate
(Hanics et al. 2017; Mulder et al. 2009, 2010) and human (Attems et al. 2012a) brain and spinal cord (Zhang et al.
2016), has been associated with presynaptic neurotrans- mitter release (Romanov et al. 2015; Zhang et al. 2016).
Nevertheless, while forebrain distribution of secretagogin- expressing(+) neurons is well characterized (Alpar et al.
2012; Attems et al. 2008; Garas et al. 2016; Gyengesi et al.
2013; Kosaka and Kosaka 2013; Kosaka et al. 2017; Mulder et al. 2009; Romanov et al. 2015), the localization and phe- notype of secretagogin+ neurons in the brainstem remain elusive.
Here, we use secretagogin as a valuable neuroanatomical marker to identify brainstem nuclei in vertebrates, including avian, rodent and human brains. In addition to relay cen- tres of special senses and vegetative regulatory centres, we classify the brainstem noradrenaline stress axis as a focus of secretagogin expression in the murine and human brain.
Noradrenergic neurons, assembled in a column of nuclei throughout the medullary and pontine brainstem (Dahl- stroem and Fuxe 1964), are extensively connected to corti- cal and subcortical forebrain regions to orchestrate central responses to, e.g. stress (Aston-Jones et al. 1996; Itoi and Sugimoto 2010; Samuels and Szabadi 2008a, b). Imbalance in noradrenaline function may result in affective, panic and anxiety disorders (Bremner et al. 1996a, b; Charney 2003;
Kvetnansky et al. 2009; Samuels and Szabadi 2008a, b), representing serious and costly morbidities and a burden on public health worldwide (Alloul et al. 1998; Takizawa et al. 2015). Of note, locus coeruleus is critically vulnerable already in the initial phase of neurodegenerative diseases, most notably Alzheimer’s disease (Braak and Del Tredici 2012; Tomlinson et al. 1981). We suggest that altered secre- tagogin expression in locus coeruleus neurons is a clinico- pathological sign of Alzheimer’s disease paralleling or even preceding tyrosine hydroxylase (TH) loss.
Results
Secretagogin is expressed in the locus coeruleus of the early rhombencephalic neural tube
We have isolated and prepared neural tube whole mounts from early mouse embryos to determine the onset of secreta- gogin expression in the foetal brainstem (Fig. 2). At embry- onic day 8.5 (E8.5), no secretagogin immunoreactivity could be detected in any rhombencephalic domain (Fig. 2a).
Brainstem neurons began to express secretagogin by E11.5, with a “hot spot” in the caudal midbrain (Fig. 2b) and in cell contingents along the basal plate and limiting sulcus of the medulla oblongata and the cervical flexure. At E11.5, TH expression was detected in a cell population dispersed
2063 Brain Structure and Function (2019) 224:2061–2078
throughout the medulla oblongata and pons. Those TH+ cells that had concentrated in the locus coeruleus (Fig. 2b, b1) were secretagogin immunoreactive (Fig. 2b1’, b1’’) with TH+/secretagogin− cells being the exception rather than the
rule. We conclude that secretagogin and TH are expressed coincidentally in the major noradrenergic brainstem centre during mouse ontogeny.
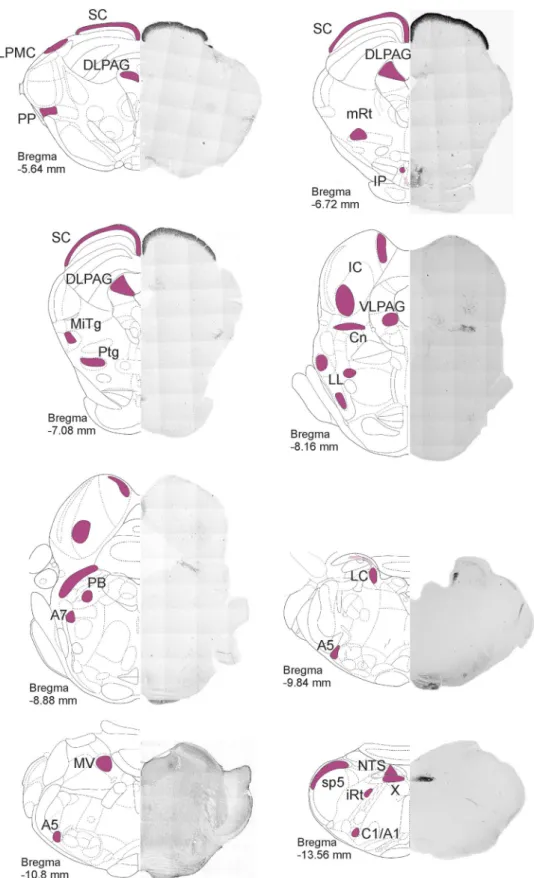
Fig. 1 Distribution of secre- tagogin in the rat brainstem I. Secretagogin+ somata were identified in coronal sections throughout the rat brainstem.
Low-power micrographs are paired with schemata of coronal brain sections to indicate cranio- caudal levels. Secretagogin+ neurons-containing regions are indicated in purple. Superior colliculus, the microcel- lular tegmental nucleus, the dorsal nucleus of vagus and the noradrenergic cell groups including A1, A5, A6 and A7 typically expressed secretago- gin. For high-power images, please see Fig. 4. A1, A5, A7 noradrenergic cell groups, C1 adrenergic cell group, Cn cuneiform nucleus, DLPAG dor- solateral periaqueductal grey, IC inferior colliculus, IP interpe- duncular nucleus, iRT interme- diate reticular nucleus, LC locus coeruleus, LL lateral lemniscus, LPMC lateral posterior thalamic nucleus mediocaudal part, MiTg microcellular tegmental nucleus, mRT mesencephalic reticular formation, MV medial vestibular nucleus, NTS solitary tract nucleus, PB parabrachial nucleus, PP peripeduncular nucleus, Ptg pedunculopontine tegmental nucleus, sB subbra- chial nucleus, SC superior col- liculus, sp5 spinal tract nucleus of V, VLPAG ventrolateral periaqueductal grey, X dorsal nucleus of X
Distribution of secretagogin+ neurons in the rodent brainstem
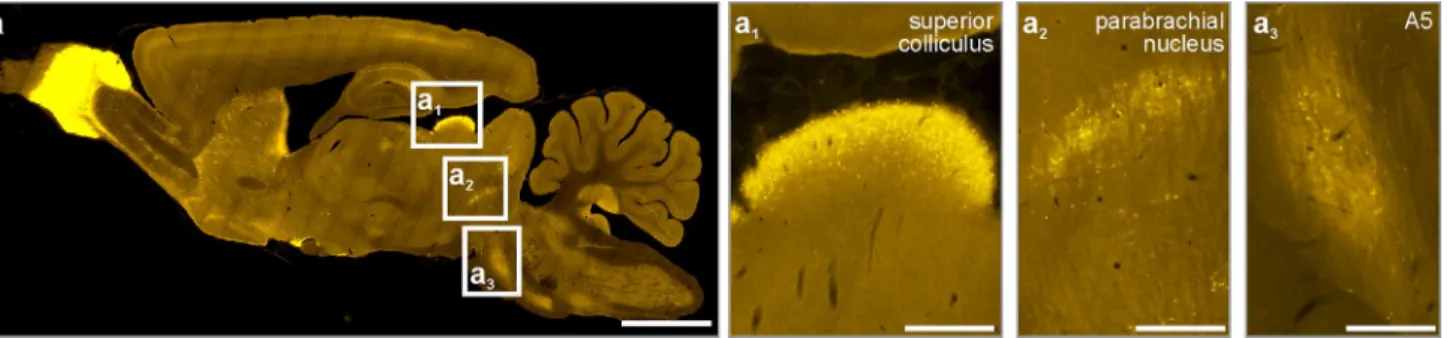
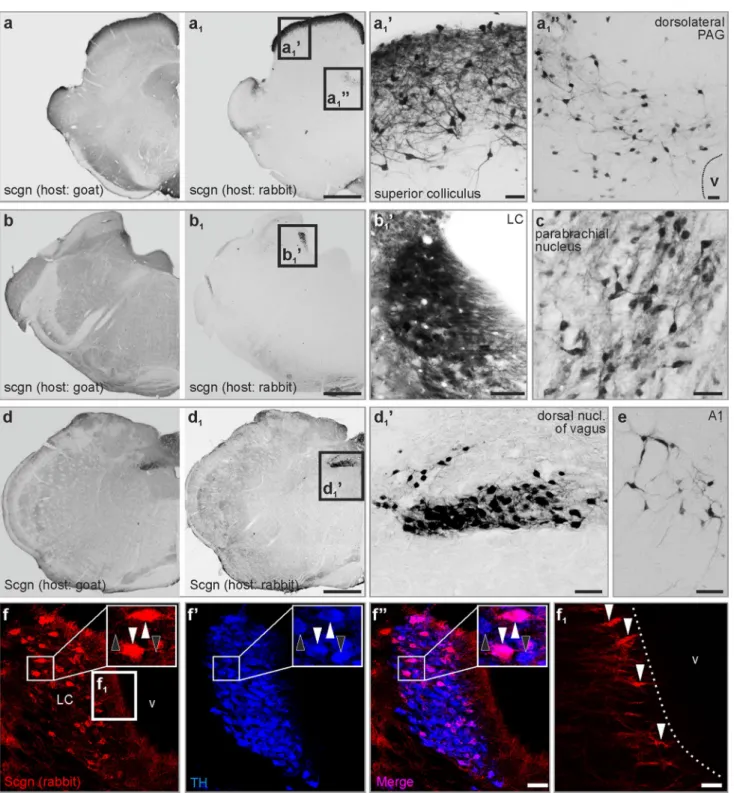
Our systematic survey through the rat brainstem revealed several medullary, pontine and midbrain domains which har- boured secretagogin+ neurons (Fig. 1). In sagittal sections, i.a. the superior colliculus, the parabrachial nucleus and the A5 field emerged as secretagogin ‘hot spots’ (Fig. 3). Using serial coronal sections of the brainstem (Fig. 1), we identi- fied secretagogin immunoreactivity in the superior colliculus and in the dorsolateral part of the periaqueductal grey in the midbrain (Fig. 4a–a1’’), the locus coeruleus, parabrachial nucleus in the pons (Fig. 4b, c), and the dorsal nucleus of vagus in the medulla oblongata (Fig. 4d1, d1’). We identified identical distributions of immunoreactive cells when using our primary antibodies produced either in rabbit or goat, although the goat antiserum was associated with higher tis- sue background (Fig. 4a, a1, b, b1, d, d1). In addition, several smaller groups of secretagogin+ neurons appeared in the medulla oblongata and pons, which were identified as the A1 (Fig. 4e), A5 and A7 fields. Secretagogin/TH double immunolabelling in the locus coeruleus (Fig. 4f–f’’) showed that 75.5 ± 6.9% (average ± SEM) of all labelled cells co- expressed these markers, leaving 23.3 ± 2.2% and 1.1 ± 0.9%
of cells single labelled for TH and secretagogin, respectively.
The processes of secretagogin+ locus coeruleus neurons were typically directed towards the ventricular space, likely representing dendrites (Fig. 4f1). At the same time, TH+ neurons in the ventral tegmentum of the midbrain did not co-express secretagogin (Fig. S1a–a’’). Likewise, serotonin+ median raphe neurons were also immunonegative for secre- tagogin (Fig. S1b–b’’). Furthermore, in the ventral part of the periaqueductal grey, where serotonin+ and secretagogin+ neurons coincidentally occurred, we could not identify their co-expression either (Fig. S1c–c’’).
Fig. 2 Secretagogin expression in the early neural tube. a Neural tube whole mount from E8.5 mouse embryos lacks secretagogin immuno- reactivity. b Secretagogin expression appears at E11.5 in the caudal midbrain. b1–b1’’ TH+ neurons share secretagogin immunoreactivity in the locus coeruleus. caud caudal, rostr rostral, Scgn secretagogin, TH tyrosine hydroxylase. Scale bars 300 μm (a, b), 60 μm (b1)
Fig. 3 Distribution of secretagogin in the rat brainstem II. Sagittal sections of the rat brain revealed superior colliculus (a1), the parabrachial nucleus (a2) and the A5 field (a3) as typical loci which harbour secretagogin+ neurons. Scale bars 1 mm (a), 300 µm (a1, a2, a3)
2065 Brain Structure and Function (2019) 224:2061–2078
Fig. 4 Distribution of secretagogin in the rat brainstem III. (a–a1’’) In the midbrain, secretagogin+ neurons condensed in the superior col- liculus and the dorsolateral periaqueductal grey. b–c Pontine distribu- tion of secretagogin expression. Locus coeruleus, and lateral to it the parabrachial nucleus (c) contained many secretagogin+ cells. (d–d1’) In the medulla oblongata, the dorsal nucleus of vagus was clearly outlined by its content of secretagogin+ neurons. e Secretagogin+ cells in the A1 field. f–f’’ Secretagogin was typically expressed
in TH+ neurons in the locus coeruleus (white arrowheads indicate TH+/secretagogin+ neurons, black arrowheads point to TH+/secreta- gogin− neurons). f1 The processes of secretagogin+ locus coeruleus neurons reached the ventricular surface (white arrowheads). LC locus coeruleus, scgn secretagogin, PAG periaqueductal grey. Scale bars 1 mm (a1, b1, d1), 100 µm (a1’), 40 µm (a1, b1’), 30 µm (c, d1’, e, f’’), 10 µm (a1’’), 3 µm (f1)
Relation of secretagogin to other CaBPs
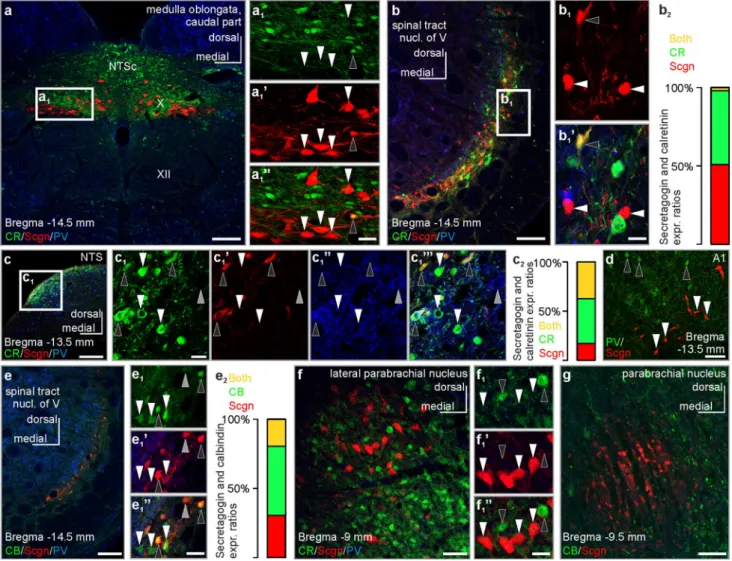
CaBPs are routinely used to typify neurons in the brain (Skelton et al. 1994). They exhibit largely non-overlap- ping expression patterns (Andressen et al. 1993; Freund and Buzsáki 1996) with occasional co-localization in the olfactory circuit, ventral pallidum and renewing cells of the dentate gyrus (del Rio and DeFelipe 1997; Wouterlood et al. 2001). In the brainstem, secretagogin+ neurons form largely non-overlapping populations with only occasional, domain-specific overlap/co-expression of CaBPs in select nuclei (Fig. 5): in the dorsal nucleus of vagus and com- missural part of the solitary tract nucleus, a complemen- tary expression pattern of calretinin and secretagogin was shown (Fig. 5a–a1’’), with many calretinin+/secretagogin+ double-labelled neurons in the dorsolateral part of the soli- tary tract nucleus at the same level (Fig. 5c–c1’’’). By using simultaneous labelling for secretagogin/calretinin/parvalbu- min, 68.5 ± 5.4% of all secretagogin+ neurons co-expressed calretinin. Secretagogin/parvalbumin co-expression was exceptionally rare: we only identified a single secretagogin+ neuron which also harboured parvalbumin (Fig. 5c1’, c1’’).
We found a diverse co-expression pattern in the spinal tract nucleus of the trigeminus: using secretagogin/calretinin/
parvalbumin or secretagogin/calbindin D28k/parvalbu- min immunohistochemistry, secretagogin often co-local- ized with calbindin D28k (Fig. 5e–e2, 40.3 ± 15.9% of all secretagogin+ neurons co-expressed calbindin D28k), only sporadically with calretinin (Fig. 5b–b2, 2.8 ± 3.2% of all secretagogin+ neurons co-expressed calretinin), but not with parvalbumin (Fig. 5b–b1’’, e–e2). Similarly, secretagogin+ neurons were immunonegative for parvalbumin in the ven- trolateral medulla (Fig. 5d), as well as in the parabrachial nucleus (Fig. 5f). Secretagogin+ neurons in the parabrachial nucleus did not share calretinin (Fig. 5f–f1’’) or calbindin immunoreactivity (Fig. 5g), either. We acknowledge that the above proportions were calculated using an investiga- tive method and not by stereology; thus, it provides approx- imate instead of accurate results regarding cell numbers/
proportions.
Secretagogin in the mouse and avian brainstem We next asked if secretagogin expression exhibited quasi- equivalent distribution in different vertebrates. To this end, serial sections of the mouse, chick and human brainstem were analysed for secretagogin+ neurons to see if an evo- lutionary continuum may exist among vertebrates. First, we generated a mouse line which expressed regulatory ele- ments of the secretagogin promoter fused with EGFP on an artificial bacterial chromosome (ScgnBAC/egfp) to control for and validate our immunoreagents. We found exten- sive overlap between EGFP expression and secretagogin
immunoreactivity (Fig. 6a–a1’’, Fig. S2) in brainstem nuclei (Table S1). The lack of secretagogin immunoreactivity in EGFP+ cells was attributed to low protein abundance in EGFP+ neurons, i.e. below immunocytochemical detectabil- ity (in our hands), because there was no hindbrain area in which the complete segregation of EGFP, suggesting ectopic expression, was seen. The distribution pattern of immuno- reactive cells was largely similar to what we found in rats:
secretagogin+ neurons typically occurred in the microcel- lular tegmental nucleus (Fig. 6a–a1’’, d, d1), nucleus of the solitary tract (6b, b1), the dorsal nucleus of vagus (Fig. 6c, c1), the noradrenergic fields, especially locus coeruleus (Fig. 6e), and the superior colliculus (Fig. 6f, f1). Yet, we detected differences between the two species: in the dorso- lateral part of the periaqueductal grey, where immunoreac- tive somata were found in rat but only immunoreactive fibres and terminals in the mouse brain (Fig. S3a, a’). In rats, the interpeduncular nucleus contained secretagogin+ cell bodies in its dorsal versus secretagogin+ cell bodies and fibres in its lateral division: no such immunoreactivity was detected in the corresponding region of mice (Fig. S3b, b’). Similarly, no immunoreactivity was detected in the inferior colliculus (Fig. S3c, c’) and medial vestibular nucleus (Fig. S3d, d’) of mice.
Secretagogin in the domestic chicken
CaBPs are molecules whose structures show significant evo- lutionary conservation (Andressen et al. 1993). Neuronal subtypes of select brain areas typically retain their CaBP expression profiles across vertebrate species (Andressen et al. 1993; Gati et al. 2014). The brainstem harbours veg- etative centres and nuclei, which share similarity, or even identity, in both lower and higher order vertebrates. We selected the domestic chick (Gallus domesticus) as a pre- cocial avian species with immediate maturity after hatching to verify our hypothesis that secretagogin has an evolution- ary preserved neuron-specific distribution in the vertebrate brainstem. Thus, the vagal nucleus (Fig. 7a, a1), the ventro- lateral medulla (Fig. 7b, b1), the vestibular nuclei and the locus coeruleus (Fig. 7c), midbrain nuclei like the ventral tegmental area and periaqueductal grey (Fig. 7d–d2) were typical secretagogin-expressing foci. Of note, we found secretagogin+ neurons in areas which cannot be directly cor- related to mammalian brain structures. Thus, the supraspi- nal nucleus—innervating the upper neck muscles, but being separate from the nucleus where the accessory nerve arises (Wild 1981)—also contained immunoreactive cells (not shown) and smaller islets of secretagogin+ neurons were identified in different subdivisions of the reticular forma- tion, especially in the midbrain (Fig. 7e). In conclusion, secretagogin is an evolutionarily conserved protein in many vertebrate brainstem nuclei.
2067 Brain Structure and Function (2019) 224:2061–2078
Fig. 5 Co-expression of secretagogin with classical Ca2+-binding proteins in select brainstem nuclei of the rat. a–a1’’ Complementary distribution of calretinin and secretagogin in the commissural part of the solitary nucleus and the dorsal nucleus of vagus (white arrow- heads indicate secretagogin+/calretinin− neurons, black arrowhead points to a secretagogin+/calretinin+ neuron). b–b1’ Secretagogin+ neurons typically remained calretinin immunonegative (white arrow- heads) in the spinal tract nucleus of the trigeminus, with exceptional co-expression only (black arrowhead). b2 Single- and co-expression ratios of secretagogin and calretinin in the spinal tract nucleus of the trigeminus. 100% percentage refers to all labelled cells detected for secretagogin and/or calretinin immunoreactivity. Secretagogin+/ calretinin+ neurons: 2.8 ± 3.2%, secretagogin+/calretinin− neurons 51.2 ± 6.1%, secretagogin−/calretinin+ neurons 47.5 ± 5.4% (as of average ± s.e.m.). c–c1’’’ Calretinin+ neurons in the dorsolateral part of the solitary tract nucleus can either remain immunonegative for secretagogin (white arrowheads) or co-express it (black arrowheads) Grey arrowhead points to a CR−/Scgn−/PV+ neuron. c2 Single- and co-expression ratios of secretagogin and calretinin in the dorsolat- eral part of the solitary tract nucleus. 100% percentage refers to all labelled cells detected for secretagogin and/or calretinin immunoreac- tivity. Secretagogin+/calretinin+ neurons: 36.1 ± 2.3%, secretagogin+/ calretinin− neurons 16.9 ± 3.5%, secretagogin−/calretinin+ neurons
43.7 ± 2.1% (as of average ± s.e.m.). d Secretagogin+ neurons (white arrowheads) in the A1 field did not co-express parvalbumin (black arrowheads point to secretagogin−/parvalbumin+ somata). e–e1’’
Secretagogin+ neurons typically co-expressed calbindin in the spinal tract nucleus of the trigeminus (black arrowheads). White arrow- heads point to calbindin+/secretagogin− somata, grey arrowhead to a secretagogin+/calbindin− soma. e2 Single- and co-expression ratios of secretagogin and calbindin in the spinal tract nucleus of the trigeminus. 100% percentage refers to all labelled cells detected for secretagogin and/or calbindin immunoreactivity. Secretagogin+/ calbindin+ neurons: 19.1 ± 8.0%, secretagogin+/calbindin− neurons 30.7 ± 11.3%, secretagogin−/calbindin+ neurons 50.2 ± 7.2% (as of average ± s.e.m.). f–f1’’ Secretagogin+ neurons showed a comple- mentary distribution to calretinin+ neurons in the lateral parabrachial nucleus (white arrowheads point to secretagogin+/calretinin− somata, black arrowheads point to secretagogin−/calretinin+ somata). g Secretagogin+ neurons remain immunonegative for calbindin in the parabrachial nucleus. CB calbindin, CR calretinin, NTS solitary tract nucleus, NTSc commissural part of the solitary tract nucleus, Scgn secretagogin, PV parvalbumin, X dorsal nucleus of vagus, XII hypo- glossal nucleus. Scale bars 150 µm (a, b, c, e), 70 µm (g), 40 µm (d, f), 10 µm (a1’’, b1’, c1, e1’’, f1’’)
Secretagogin expression is reduced
in noradrenergic brainstem nuclei in Alzheimer’s disease
Immersion fixation of blocked tissue, the routine process- ing procedure, and post-mortem delay adversely impact epitope detection by immunohistochemistry in human brain tissue. We overcame this problem by applying vas- cular perfusion via the internal carotid and vertebral arter- ies to preserve tissue integrity. Similarly to laboratory rodents, we found secretagogin+ neurons in the noradr- energic axis of the human brainstem (Fig. 8a–c), includ- ing the locus coeruleus (Fig. 8b, b1), and A1 (Fig. 8a2) and A7 (Fig. 8c) nuclei. TH+ locus coeruleus neurons
co-expressed secretagogin, with subcellular foci (patches) restricted to peripheral intrasomatic domains and neu- ronal processes, frequently apposing the cell membrane (Fig. 8d–d1’’). In addition, we identified secretagogin+ neurons in the dorsal nucleus of vagus of the human brain (Fig. 8a, a1), similarly to what we found in rat (Fig. 4d1’) and mouse (Fig. 6c1).
We hypothesized that neurodegenerative stimuli may be harmful for secretagogin expression in LC neurons.
Alternatively, secretagogin could spare these cells from neurodegeneration. Secretagogin+ hippocampal or olfac- tory neurons are preserved in neurodegenerative dis- orders, like Alzheimer’s disease (Attems et al. 2008, 2012a), supporting the latter hypothesis. However, it has
Fig. 6 Secretagogin expression in the mouse brain stem. a–a1’’
EGFP-expressing neurons in secretagogin–EGFP mice showed secre- tagogin immunoreactivity as exemplified in the microcellular teg- mental nucleus (white arrowheads in a–a1’’). Occasionally, EGFP- expressing neurons remained secretagogin immunonegative (black
arrowhead in a–a1’’). b–f1 Secretagogin+ neurons in the solitary tract nucleus (b, b1), dorsal nucleus of vagus (c, c1), microcellular tegmen- tal nucleus (d, d1), locus coeruleus (e) and the superior colliculus (f, f1). LC locus coeruleus, MiTg microcellular tegmental nucleus. Scale bars 1 mm (b–f), 100 µm (a’’, d1, f1), 70 µm (b1), 40 µm (c1)
2069 Brain Structure and Function (2019) 224:2061–2078
been proposed that TH+ locus coeruleus neurons are most sensitive and compromised already in the early phase in Alzheimer’s disease (Tomlinson et al. 1981): tau pathol- ogy appears earliest in locus coeruleus noradrenaline neurons (Attems et al. 2012b). Monitoring secretagogin expression at the transcription (RNA) level, we found that it robustly decreased already in Braak III–IV stage sub- jects and further diminished in severe Alzheimer’s disease (Fig. 8h). In severe Alzheimer’s disease subjects (Braak V–VI), we identified a parallel decrease in TH (relative fluorescence intensity values: 103.59 ± 5.82 in Braak I–II vs. 52.66 ± 1.55 in Braak V–VI) and secretagogin (rela- tive fluorescence intensity values: 47.13 ± 0.03 in Braak I–II vs. 27.42 ± 1.06 in Braak V–VI) immunoreactivity (Fig. 8e–g’’). In individuals with advanced stage of Alz- heimer’s disease-related pathology (Braak V–VI), neurons with abundant cytoplasmic secretagogin immunoreactivity were very rare and often lacked AT8-immunoreactivity (hyperphosphorylated tau) (Fig. 8i, i’). Typically, secre- tagogin expression within TH+ neurons, if detectable, was restricted to very small intracellular compartments. These foci often overlapped with the AT8+ microdomains where
tau hyperphosphorylation started to develop within the neuron (Fig. 8f1–f1’’, but see also Fig. 8f2–f2’’). Secreta- gogin expression was more evident in neuronal processes which occasionally showed multiple islets of AT8+ pro- files (Fig. 8j–j’’). In conclusion, secretagogin expression decreased with the progression of Alzheimer’s disease, with residual immunoreactivity in degenerating intracel- lular microdomains.
Discussion
The present study underlines the usefulness of secretago- gin as a novel neurochemical marker to distinguish subsets of neurons in the vertebrate brain. Detected already during early ontogeny, secretagogin in adults was then expressed in important relay centres in the lower brain stem, notably in several of the noradrenaline groups, with the A6 locus coeruleus being of particular interest. Moreover, secreta- gogin expression in the locus coeruleus from Alzheimer’s disease subjects paralleled TH loss and was associated with initial, aberrant tau phosphorylation.
Fig. 7 Secretagogin expression in the chicken brain stem. a–e The distribution of secretagogin+ neurons in the avian brain was similar to what we found in the mammalian brain. a–b1 In the medulla oblon- gata, immunoreactive neurons populated the dorsal nucleus of vagus (black arrowhead in a, open arrowheads indicate nerve fibres emanat- ing from the nucleus) and the ventrolateral medulla (b, b1). c In the
pons, immunoreactivity was typically confined to the vestibular area and the locus coeruleus. d–e In the midbrain, neurons of the periaq- ueductal grey matter, of the ventral tegmental area and scattered cells in the reticular formation showed secretagogin immunoreactivity. LC locus coeruleus, PAG periaqueductal grey, VTA ventral tegmental area. Scale bars 1 mm (a–e), 50 µm (a1, b1, d1, d2)
2071 Brain Structure and Function (2019) 224:2061–2078
Secretagogin is expressed early during ontogenesis and persists throughout adulthood in locus
coeruleus neurons
CaBPs appear at different time points and last for different intervals during brainstem development. Calretinin, cal- bindin and parvalbumin are sequentially expressed in the rat auditory brainstem during development, correlating with definite developmental stages (Lohmann and Friauf 1996).
The postnatal development of rat vestibular nuclei and their cerebellar projections could be mapped by the specific spa- tiotemporal appearance of the same CaBPs (Puyal et al.
2002). Notably, the early onset of the expression of these CaBPs is no guarantee for their ongoing presence through adulthood. For example, even if most neurons, which express calbindin D28k during development preserve their phenotype (Enderlin et al. 1987), this is not the case in the superior olivary complex, where calbindin D28k expression is transient and may reflect critical periods in the control of calcium homoeostasis (Friauf 1993). Calretinin’s transient expression during ontogenesis is even more pronounced, in mammals (Lohmann and Friauf 1996), fish (Porteros et al.
1998) and avian species (Bastianelli and Pochet 1993). Par- valbumin, in turn, may appear late (in fact postnatal) dur- ing forebrain development (Lohmann and Friauf 1996) and is induced by specific afferent stimuli (Barker and Dreher 1998; Manns and Gunturkun 2003; McHaffie et al. 2001).
We here show that secretagogin appears early in mouse brainstem development and shows ongoing expression in mouse brainstem noradrenergic cells, notably of the locus coeruleus neurons. Speculatively, secretagogin may regulate calcium-dependent mechanisms or TH synthesis in noradr- energic neurons, which are critical not only in adulthood but already in embryonic life.
Secretagogin expression in relay, vegetative and stress centres of the vertebrate brainstem Secretagogin was expressed in nuclei with different func- tions. We highlight that secretagogin+ neurons (i) populate the brainstem nuclei which serve as major vegetative com- mand centres, such as the parabrachial or the solitary tract nucleus, (ii) occur in critical relay stations in the pathway of special senses (vestibular and visual), (iii) outline the brain- stem noradrenaline axis and (iv) that this expression pattern has been preserved in phylogenesis, from avian species to humans. At the same time, secretagogin was expressed nei- ther in serotonin+ raphe neurons nor in TH+ neurons in the ventral tegmentum, i.e. dopamine neurons, and we could reconfirm (data not shown) that cholinergic neurons at the midbrain–hindbrain border, including the pedunculopontine nucleus (Ch5), the laterodorsal tegmental nucleus (Ch6) and the parabigeminal nucleus (Ch8), remained immunonegative for secretagogin (Kosaka and Kosaka 2018).
CaBPs are widely used as neurochemical markers to distinguish neuronal pools (Andressen et al. 1993; Celio 1990; Jacobowitz and Winsky 1991), with their exact intra- cellular function, however, remaining contradictory (Fre- und et al. 1990) or largely unrevealed. In general terms, Ca2+-sensor proteins, including secretagogin (Wagner et al.
2000), undergo a conformational change upon cell activa- tion (Rogstam et al. 2007) to trigger intracellular signalling events (Gartner et al. 2007; Hanics et al. 2017; Malenczyk et al. 2017). Thus, secretagogin can be critical to regulate vegetative functions and sensory processing at the brainstem level based on their specific expression in the above nuclei.
To unravel secretagogin’s physiological role in brainstem nuclei, future experiments could investigate the vegetative, vestibular and visual systems. We would definitely consider loss-of-function and activity-dependence experiments which impact the vegetative control at the major supraspinal level (solitary tract nucleus), control of balance and relevant motor skills as well as visual functions controlled at the mid- brain level (e.g. smooth pursuit). Finally, whilst we recently explored secretagogin’s role in a mechanism converting
Fig. 8 Secretagogin expression in the human brainstem is compro- mised in Alzheimer’s disease. a–a2 Secretagogin+ neurons of the medulla oblongate populated the dorsal nucleus of vagus (a1), cap- tured from the immediate consecutive section after the section shown in a and the A1 field (a2). b, b1 In the pons, secretagogin+ neurons typically occurred in the locus coeruleus. c Secretagogin+ neurons in the A7 field. d–d1’’ TH+ neurons of the human locus coeruleus expressed secretagogin. Secretagogin immunoreactivity concentrated along the cell membrane and most typically where dendrites ema- nated from the soma (arrowheads in d–d1’’). e–e’’ Secretagogin was abundantly expressed in TH+ locus coeruleus neurons in individuals without histopathological signs of Alzheimer’s disease (Braak I–II) (arrowheads in e–e’’ point to secretagogin-immunoreactive loci in TH+ soma. f1–f2’’ In subjects with severe Alzheimer’s disease (Braak V–VI), secretagogin+ subcellular domains in TH+ somata were sig- nificantly reduced and often overlapped with the accumulation foci of AT8+ hyperphosphorylated tau (arrowheads in f1–f2’’, black arrow- head in f1–f1’’ points to a secretagogin+/AT8− domain). g, g’ TH and secretagogin immunofluorescence showed a paralleled reduction in individual locus coeruleus neurons in Braak V–VI vs. Braak I–II subjects. g’’ In average, TH-immunoreactivity decreased in locus coeruleus somata in severe Alzheimer’s disease which was paralleled with a loss in secretagogin immunoreactivity. h Secretagogin mRNA expression decreased significantly with the progress of Alzheimer’s disease in locus coeruleus micropunches. i–i Complementary distri- bution of AT8 and secretagogin immunoreactivity of locus coeruleus neurons in severe Alzheimer’s disease. j–j’’ Initial, discontinuous accumulation of AT8+ tau protein (arrowheads) in secretagogin+ neu- ronal process in the locus coeruleus of a late-stage Alzheimer’s dis- ease subject. e1, f1, h p < 0.05, Student’s t test. Scgn secretagogin, TH tyrosine hydroxylase. Scale bars 500 µm (a, b), 100 µm (a1, b1, c), 25 µm (a2), 15 µm (d), 5 µm (d1’’, e–e’’, i–i’, f1–f2’’), 500 µm (a, b), 3 µm (j’’). Images a, b, c and d–d1’’ were reproduced with permis- sion from EMBO: Alpár et al., Hypothalamic CNTF volume trans- mission shapes cortical noradrenergic excitability upon acute stress.
EMBO J. 2018 Nov 2;37(21). pii: e100087
◂
hypothalamic activation into long-lasting cortical excitabil- ity following acute stress (Alpar et al. 2018), secretagogin’s function in shaping the ascending and descending reticulo- activating system is a promising field for future works.
Is secretagogin involved in somato‑dendritic release of neuropeptides?
It has been shown that secretagogin interacts with proteins implicated in i.a. docking of release vesicles (Bauer et al.
2011; Romanov et al. 2015). In fact, there is evidence that secretagogin is localized in corticotropin-releasing hor- mone (CRH) axon terminals at the median eminence and modulates release of this neuropeptide at this site (Romanov et al. 2015). The present results show that secretagogin in human locus coeruleus neuron cell bodies and dendrites has a patchy distribution not rarely close to the cell membrane.
We have proposed that the neuropeptide galanin is released from soma and dendrites of rat (Vila-Porcile et al. 2009) and human (Barde et al. 2016) locus coeruleus neurons under stressful conditions. This type of release has been shown for oxytocin and vasopressin to occur in the hypothalamic magnocellular neurons (Ludwig and Leng 2006). It may be relevant to analyse if secretagogin in the locus coeruleus neurons is involved in the regulation of galanin release, since this peptide system is involved in mood disorders (Hokfelt et al. 2018; Holmes and Picciotto 2006; Kuteeva et al. 2010;
Lu et al. 2007).
Secretagogin expression decreases in Alzheimer’s disease
Ca2+-sensor proteins work in an activity-dependent manner to control downstream signalling. Cell activity and excit- ability are reduced in neurodegenerative diseases, including Alzheimer’s disease (de Haan et al. 2017). We found that secretagogin expression significantly decreased with disease progression, paralleling TH loss typical already in the early phase of Alzheimer’s disease (Braak and Del Tredici 2012;
Chan-Palay and Asan 1989; German et al. 1992; Kelly et al.
2017), which may reflect impaired cell function and activity.
Previous studies suggested that secretagogin is neuro- protective in hippocampal pyramidal cells in Alzheimer’s disease (Attems et al. 2008) and secretagogin expression has recently been shown to parallel disease progression:
P301L tau transgenic mice showed reduced secretagogin expression in hippocampal neurons (Attems et al. 2011).
Whilst we found that structural malformations can be independent of secretagogin loss (neurons with robustly reduced or not detectable secretagogin expression did not necessarily contain AT8+ hyperphosphorylated tau), small intracellular domains with residual secretagogin expres- sion were identified as foci with initial tau aberrancies and
islet-like multiple accumulation of AT8+ tau repeatedly occurred in the secretagogin+ processes. This may impli- cate that secretagogin-expressing domains can resist struc- tural degradation which refers to its previously suggested role in neuroprotection (Attems et al. 2008). Accumulating evidence suggest that a deregulation of calcium signalling may play a major role in Alzheimer’s disease progression;
CaBPS such as parvalbumin, calbindin and calretinin are upregulated in the hippocampus of 3-month-old APPswe/
PS1dE9 transgenic mice, possibly to control cellular homoe- ostasis and synaptic plasticity, but losing cellular capacity to pathophysiological processes by the age of 12 months (Verdaguer et al. 2015). Activity-dependent translocation of synaptonuclear factors from synapses to the nucleus is regulated by calmodulin-dependent mechanisms; altered synapse-to-nucleus signalling may lead to neurodegenera- tive and neuropsychiatric diseases (Parra-Damas and Saura 2019). Ca2+/calmodulin-dependent protein kinase kinase 2 controls important neuronal processes and its loss leads to aberrant transferrin phosphorylation and trafficking which makes it a potential biomarker for Alzheimer’s disease (Sab- bir 2018). CaBPs-mediated mechanisms are also important in glial cells to resist neurological disorders. Calcium dys- regulation triggers astrocyte activation which leads to neu- roinflammation, release of synaptotoxic factors and loss of glutamate regulation which can finally culminate in neuro- degeneration (Sompol and Norris 2018). Dysregulation of calcineurin signalling pathways in activated astrocytes and its interaction with the nuclear factor of activated T cells (NFATs) couple vascular pathology to neurodegeneration and cognitive loss (Kraner and Norris 2018). Calcium sensor proteins have been previously implicated in neuroprotection:
dopamine neurons in the substantia nigra use calretinin to confer oestrogen’s effect to prevent cell loss (Yi et al. 2016) and calretinin cooperates with the NCX1 exchanger to resist neurodegeneration (Boscia et al. 2016).
We suggest that secretagogin’s involvement in Alzhei- mer’s disease is (i) due to its calcium sensor rather than to its calcium buffer property. Secretagogin has been shown to regulate diverse cellular mechanisms and functions, includ- ing migration or hormonal release, in distinct brain neuronal populations (Alpar et al. 2018; Hanics et al. 2017; Romanov et al. 2015). All these functions seemed to be linked to secre- tagogin’s calcium sensor property. Second (ii), secretago- gin’s involvement in Alzheimer’s disease is likely exerted by affecting noradrenergic cell function, hence modulating noradrenergic cortical input. In conclusion, secretagogin as a calcium sensor may act neuroprotectively by regulating downstream machineries in noradrenergic cells.
2073 Brain Structure and Function (2019) 224:2061–2078
Materials and methods
Animals, surgery and ethical approval of experimental studies
Eleven 6-week-old male rats (Wistar), three 12-week-old male wild-type mice (C57BL/6), a total of six embryos from three pregnant C57BL/6 mice, three 12-week-old male EGFP–secretagogin transgenic mice and three 14-day-old chicks (Gallus domesticus) were used. Food and water were available ad libitum and animals were kept under stand- ard housing condition and using a 12/12 light/dark cycle.
Experimental procedures, including stereotaxic injections and transcardial perfusion, were approved by the Ethical Review Board of the Semmelweis University and conformed to the European Convention for the Protection of Vertebrate Animals used for experimental and other scientific purposes (Protocols: ETS No. 170, ETS No.123, Tierversuchgesetz 2012, BGBI, Nr. 114/2012). Animals during surgeries and transcardial perfusions were anesthetized intramuscularly (i.m.) or intraperitoneally (i.p.) with a mixture of ketamine (50 mg/kg b wt) and xylazine (4 mg/kg b wt). After surgery, brains were perfusion fixed transcardially with 4% paraform- aldehyde (PFA) in 0.1 M phosphate buffer (0.1 M PB).
Production of the SB‑BAC‑SCGN‑EGFP transgenic mouse line
To generate transgenic mice expressing the EGFP (enhanced green fluorescent protein) under the control of the SCGN promoter, we used a BAC (Bacterial Artificial Chromosome) engineering technology (Lee et al. 2001). The B6Ng01- 268C03 (RIKEN BioResource Research Center) BAC clone was chosen, which contained the whole SCGN gene and downstream of it another harbouring gene (Hist1h2ba) which was removed later. In the BAC modification casette, the EGFP cDNA was inserted between the recombination arms and its ATG site was fused into the SCGN’s gene ATG
site. Following the EGFP cDNA, a WPRE (woodchuck hepatitis virus (WHP) posttranscriptional regulatory ele- ment), an hGH-PA (human growth hormone polyadenyla- tion signal) and a neomycin selection marker flanked by flippase recognition sites were inserted into the construct.
Recombination was carried out as described by Lee et al.
(2001). After the insertion of the EGFP and other compo- nents into the BAC, the neomycin marker was removed in the host cells by a flippase enzyme. This was followed by a second recombineering-based BAC modification step in which ~ 40 kb downstream region from the SCGN gene was removed, which contained the neighbour gene. In the same step, we inserted both ITR (inverted terminal repeat) sequences recognized by the Sleeping Beauty transposase to combine the BAC transgenesis with a transposon-based system for increased integration efficiency (Rostovskaya et al. 2012). Transgenic mice were derived by pronuclear microinjection of the SB-BAC-SCGN-EGFP BAC (circular, 1 ng/μl), Sleeping Beauty transposase mRNA (5 ng/μl) into C57BL/6Ntac fertilized eggs.
Immunohistochemistry and imaging
Chromogenic or multiple immunofluorescence histochemis- try with select combinations of primary antibodies (Table 1) was performed according to published protocols (Alpar et al.
2010; Lendvai et al. 2013). Free-floating sections (30 μm) were rinsed in phosphate buffer (PB, pH 7.4) and pre-treated with 0.3% Triton X-100 (in PB) for 1 h at 22–24 °C to enhance the penetration of antibodies. Non-specific immu- noreactivity was suppressed by incubating our specimens in a cocktail of 5% normal donkey serum (NDS; Jackson), 2%
bovine serum albumin (BSA; Sigma) and 0.3% Triton X-100 (Sigma) in PB for 1 h at 22–24 °C. Sections were exposed (16–72 h at 4 °C) to select combinations of primary antibod- ies (Table 1, (Alpar et al. 2004; Hanics et al. 2017; Lend- vai et al. 2013; Mulder et al. 2010; Romanov et al. 2015)) diluted in PB to which 0.1% NDS and 0.3% Triton X-100 had been added. After extensive rinsing in PB, the sections
Table 1 List of markers used for immunolabelling
1 Monoclonal antibody
Marker Source Host IH dilution References
Calbindin Synaptic systems guinea pig, pc2 1:1000 Hanics et al. (2017) Calretinin Synaptic systems guinea pig, pc2 1:1000 Hanics et al. (2017) Parvalbumin Millipore Mouse, mc1 (AT8) 1:1000 Lendvai et al. (2013)
PHF tau Pierce Mouse, mc1 (AT8) 1:1000 Lendvai et al. (2013)
Secretagogin L. Wagner Rabbit, pc2 1:12,000 Romanov et al. (2015) Secretagogin Cell signaling Rabbit, pc2 1:1000 This study
Secretagogin R&D systems Goat, pc2 1:100 Mulder et al. (2010) Tyrosine hydroxylase MERCK/Millipore Rabbit, pc2 1:1000 Alpar et al. (2004)
were processed using chromogenic or immunofluorescence detection. In single-labelling experiments, the sections were exposed to biotinylated anti-rabbit IgG raised in donkey (1:1,000 [Jackson], 2 h at 22–24 °C) followed by pre-formed avidin–biotin complexes also incorporating horseradish per- oxidase for 1 h at 22–24 °C. Immunosignals were visualized by 3,3′-diaminobenzidine (Sigma, 0.025%) as chromogen intensified with Ni-ammonium sulphate (0.05%, Merck) in the presence of 0.001% H2O2 as substrate (dissolved in 0.05 M Tris buffer, pH 8.0). In multiple immunofluorescence labelling experiments, immunoreactivities were revealed by carbocyanine (Cy) 2, 3 or 5-tagged secondary antibodies raised in donkey (1:200 [Jackson], 2 h at 22–24 °C). Glass- mounted sections were coverslipped with glycerol/gelatin (GG-1; Sigma).
The results of chromogenic stainings were captured on an Olympus BX-51 microscope at 10×, 20× and 40× primary magnification. Sections processed for multiple immunofluo- rescence histochemistry were inspected and images acquired on a 780LSM confocal laser-scanning microscope (Zeiss) with optical zoom ranging from 1× to 3× at 63× primary magnifica- tion (Plan-Apochromat 63×/1.40), and pinhole settings limiting signal detection to 0.5–0.7 μm “optical thickness”. Emission spectra for each dye were limited as follows: Cy2 (505–530 nm), Cy3 (560–610 nm), and Cy5 (650–720 nm). Multi-panel figures were assembled in CorelDraw X5 (Corel Corp.).
We used the histogram toolbox of the ZEN software (ZEISS) to measure immunofluorescence in the locus coer- uleus neurons of Braak I–II (n = 3) and Braak V–VI (n = 3) subjects. Images from all sections (n = 3 per subject) were captured using identical settings. Somata (n = 11 per section) were demarcated and their immunofluorescence, reflecting their TH and secretagogin immunoreactivity, were automati- cally measured and their quotient calculated.
To measure the overlap of secretagogin–EGFP expression and secretagogin immunoreactivity, we developed secretago- gin immunoreactivity using the anti-secretagogin antibody raised in rabbits on sections made from secretagogin–EGFP mice brainstem. Analyses were carried out on images captured at 20× primary magnification. EGFP-expressing and immuno- reactive somata were labelled with different markers in differ- ent layers (channels) using Photoshop which allowed co-local- ization of the two markers. In all three animals and for every nucleus, EGFP expression/immunoreactivity of somata were identified and marked in a minimum of three corresponding sections which were consecutive serial 30 μm-thick-sections of a four series-section pool. Labelled cells were counted in the whole nucleus on the section. The occurrence of secreta- gogin–EGFP expression or secretagogin immunoreactivity in double-labelled somata was calculated and expressed as aver- age ± SEM. Co-localization coefficients between secretagogin, parvalbumin, calbindin and calretinin were measured and cal- culated along the same principle, including animal number and
the quantitative attributes of image analysis. We emphasize that this approach was an investigative method and did not aim to provide accurate results regarding cell numbers/proportions.
Human tissue preparation and immunohistochemistry
We applied direct perfusion via the internal carotid and vertebral arteries, which facilitated the preservation of tissue integrity relative to alternative fixation methods.
Human brains (n = 2, gender and age: female/83 years and male/79 years, with a clinical history lacking neurodegenera- tive disease, ethical approval: TUKEB 84/2014, Hungary) were first perfused with physiological saline, followed by a fixative containing 2% PFA and 0.1% glutaraldehyde in 0.1 M Tris-buffered saline (TBS, pH 7.4) 7 h or 11 h after death. The removal and subsequent preparation of human tissues were in accordance with the relevant ethical guide- lines of Semmelweis University (1998, Budapest, Hungary).
Blocks from the medulla oblongata and pons were dissected out and post-fixed in 2% PFA in TBS for 72, followed by immersion in cryoprotective 30% sucrose in 0.1 M PB (pH 7.4) overnight. Coronal sections (50 μm) were cut on a cry- ostat microtome and processed for immunohistochemistry.
Free-floating sections were rinsed in PB (pH 7.4) and pre- treated with 0.3% Triton X-100 (in PB) for 1 h at 22–24 °C to enhance the penetration of antibodies. Non-specific immunoreactivity was suppressed by incubating our speci- mens in a cocktail of 5% NDS (Jackson), 10% BSA (Sigma) and 0.3% Triton X-100 (Sigma) in PB for 1 h at 22–24 °C.
Sections were exposed for up to 72 h (at 4 °C) to the cocktail of primary antibodies (Table 1) diluted in PB to which 0.1%
NDS and 0.3% Triton X-100 had been added. After exten- sive rinsing in PB, the immunoreactivities were revealed by chromogenic staining (as above) or by Cy2, 3 or 5-tagged secondary antibodies raised in donkey (1:200 [Jackson], 2 h at 22–24 °C). Lipofuscin autofluorescence was quenched by applying Sudan Black-B [1%, dissolved in 70% ethanol (Schnell et al. 1999)]. Glass-mounted sections were cov- erslipped with Aquamount embedding medium (Dako).
Sections were inspected and images acquired on a 710LSM confocal laser-scanning microscope (Zeiss) at 10× or 40×
primary magnification and pinhole settings limiting signal detection to 0.5–0.7 μm. Emission spectra for each dye were limited as follows: Cy2/505–530 nm, Cy3/560–610 nm, and Cy5/650–720 nm. Multi-panel figures were assembled in CorelDraw X7 (Corel Corp.).
Samples from patients with Alzheimer’s disease and age- matched controls (without clinical signs of neuropsychiatric disease) were acquired at the Brain Bank of the Institute of Neurology, Medical University of Vienna, Austria, and from the Human Brain Bank of Semmelweis University, Budapest, Hungary (a total of 34 samples were used, for