Introduction
Turkey is one of the countries that has suffered from food price inflation in recent years. Figure 1 indicates a negative divergence of the levels of Food Consumer Price Index (CPI) in Turkey from the world. The difference has become more evident lately. For instance, annual food inflation in Turkey reached 29.3 percent in October 2018, whereas annual food inflation in the world was only 2.7 percent. Many studies show that agricultural input costs lie behind these high food prices. For instance, Çıplak and Yücel (2004) indicate that increases in agricultural prices have a significant role in food price inflation and total CPI inflation in Turkey using a vec- tor autoregressive (VAR) model. Balkan et al. (2015) find
that fuel prices increase wholesale fresh fruit and vegetable prices through transportation costs using a difference-in- differences model. Eren et al. (2017) show that producer prices and the quantity of production are the main drivers of consumer food prices with a panel VAR model. Therefore, a decrease in agricultural input costs can play a significant role in reducing food inflation.
The paper aims to investigate the impact of tax cuts on agricultural input prices in Turkey with a natural experiment.
The effect of taxation on market price has always been one of the issues under discussion in the literature. It has been investigated whether a reduction or increase in taxation has been passed on to consumers. According to the theoretical literature, the tax is passed through to prices depending on
Short communication
Sefa IŞIK* and Fatih Cemil ÖZBUĞDAY*
The role of tax cuts on agricultural input prices in Turkey
Agricultural input costs have a major impact on food prices in Turkey. In this context, a decrease in agricultural input costs can play a significant role in reducing food inflation. On January 1, 2016, the 18% Value Added Tax (VAT) rate in fertiliser was reduced to 1 percent with the Council of Ministers’ decision numbered 2015/8353. Then, on February 10, 2016, fertiliser was included in the scope of the exception. As these tax reduction decisions exogenously affect fertiliser prices, there is an opportunity to conduct a natural experiment. Using the difference-in-differences (DID) method, this paper examines whether the decisions reduce fertiliser prices. The analysis results provide some hints that consumers received benefits from the tax reduction decisions.
Keywords: Difference-in-differences, agricultural input costs, taxation JEL classifications: Q11, Q18
* Department of Economics, Faculty of Political Sciences, Ankara Yıldırım Beyazıt University, Ankara, Turkey. Corresponding author: sefa_isik@yahoo.com Received: 25 August 2020, Revised: 5 October 2020, Accepted: 10 October 2020.
-50 0 50 100 150 200 250 300 350 400 450 500
Index levels percent
Turkey Food-CPI
2003 2004 2005 2006 2007 2008 2009 2010 2011 2012 2013 2014 2015 2016 2017 2018 World Food-CPI
-5 0 5 10 15 20 25 30 35 40 45 45
Year-over-year change, Turkey Year-over-year change, World Figure 1: Food-CPI in the world and Turkey (2003=100).
Source: own composition based on FAO (2020) data
Note: Left vertical axis represents food-CPI levels; the right vertical axis shows the year-over-year percentage changes in the indices.
the relative elasticities of demand and supply (Berardi et al., 2016). If the supply curve is perfectly elastic or the demand curve is perfectly inelastic, the tax is fully passed through to prices (Fullerton and Metcalf, 2002). Studies investigating the impact of taxation on prices have found a wide range of results from under-shifting to over-shifting.
Besley and Rosen (1998) conduct a study examining the relationship between sales taxes and prices using quarterly data for 12 commodities (such as eggs, milk, soda, bananas, and shampoo) and 155 cities during 1982–1990. They esti- mate that taxes were entirely or under-shifted for some com- modities, while commodity taxes were over-shifted for oth- ers. Kenkel (2005) assesses the impact of an alcohol tax hike on Alaska prices using primary data. The paper provides evidence that taxes were more than fully passed through to alcohol beverage prices. Doyle and Samphantharak (2008) investigate the impact of a gas tax on retail gasoline prices in Illinois and Indiana using daily prices at the gas-station level and a difference-in-differences approach. They estimate that 80–100 percent of the tax reinstatement was passed through to consumers, while 70 percent of the sales tax reduction was passed through to consumers. Hanson and Sullivan (2009) evaluate the effect of a tobacco tax on retail prices using an increase in Wisconsin’s tobacco tax. They find that a $1 tobacco tax increase was over-shifted to Wisconsin consum- ers via a difference-in-differences approach. The consumers paid a premium of between 8-17 cents per pack of cigarettes as well as the full tax. Alm et al. (2009) investigate the inci- dence of state gasoline excise taxes using monthly data for all 50 U.S. states for the period 1984–1999. They find that gasoline taxes were entirely shifted to the final consumer.
Chiou and Muehlegger (2010) examine the impact of ciga- rette excise taxes in the Chicago area. The paper finds that the tax was under-shifted to prices. They estimate price elas- ticities of approximately -0.4. Berardi et al. (2016) inves- tigate the impact of the ‘soda tax’ introduced in January
2012 on consumer prices in France. Using a difference-in- differences approach, the study concludes that the tax gradu- ally affected the prices of taxed beverages and entirely shifted to the prices after six months. They also state that the impact was heterogeneous across retail groups and brands.
The empirical literature on the impact of taxation on prices indicates that the impact varies depending on data sets from different tax applications. A reduction or increase in taxation is entirely or under-shifted to prices in some cases, while it is over-shifted in other cases. In this study, we con- tribute to the existing literature using a natural experiment in Turkey. The 18% VAT rate in fertiliser was reduced to 1 per- cent on January 1, 2016. Then, fertiliser was included in the scope of the exemption on February 10, 2016. In this con- text, this study investigates whether the decisions reduced fertiliser prices using the difference-in-differences approach.
The analysis estimates that 83.7 percent of the tax reduction was passed through to prices in the first three months from the date of the tax cut decision on January 1, 2016.
The paper is structured as follows. In section 2, the empirical strategy and data are presented. Section 3 provides the main results and robustness checks. Finally, the conclu- sions are presented in Section 4.
Methodology
The impact of tax cuts on fertiliser prices could be assessed in different ways. A standard econometric model consisting of a dummy variable for the taxation decision and other explanatory variables could be one way. The second way could be to obtain the impact of the tax reduction by subtracting the actual after-tax prices from the predicted after-tax prices. The predicted after-tax prices show what the prices would have been without the tax reduction decision.
The third way could be a difference-in-differences (DID)
Price levels
2015 2016 2017 2018 2019 2020
50 60 70 80 90 100 110 120 130 140 150 160 170
Fertilisers Acaricide
Herbicides Insecticides
Fungicides
Tax Cut
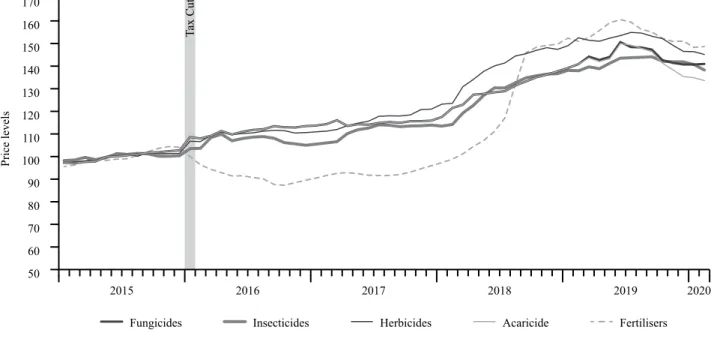
Figure 2: The movement of selected product prices in Turkey (2015=100).
Source: own composition based on TURKSTAT (2020) data
approach which is frequently used to examine the effects of taxation decisions on economic variables such as prices, and consumption (Berardi et al., 2016; Hanson and Sullivan, 2009; Doyle and Samphantharak, 2008).
In this paper, we employ the DID approach for two rea- sons. The first reason is that the fertiliser’s tax reduction implementation is exogenous. Regulatory processes can be related to complex interactions between groups that lose or gain from regulations (Ozbugday and Nillesen, 2013). In other words, the main variable of interest (TAXCUT) might be corre- lated with the error term. Nevertheless, the tax cut decision in January 2016 is the realisation of one of the new government’s promises for the November 2015 elections. In the process of the election campaigns, the main opposition party promised to decrease diesel prices for farmers if she were elected. In contrast, the ruling party announced that it would make the VAT reduction on fertiliser. After the election, the ruling party, namely the AK Party, was re-elected and reduced the VAT on fertilisers on January 1, 2016. So, the change in fertiliser’s tax was not affected by interest groups.
The second reason we prefer to use the DID method is the existence of a control group unaffected by the decision.
For a DID estimation, a satisfactory control group that has a similar trend with the treated group as much as possible is required. As candidates for a control group, we consider four pesticide prices (fungicides, insecticides, herbicides, and acaricide). Figure 2 plots the nationally-representative trends in the price indices for both fertilisers and pesticides in Tur- key between January 2015 and February 2020. As shown in the figure, the treated group (fertilisers) and the candidate control groups (pesticides) exhibit a similar trend before the decision of the taxation in January 2016. Therefore, these four pesticides are chosen as control groups.
The DID estimates for the real differential impact of the tax cut decisions on fertiliser prices are shown in Table 1.
An alternative regression-based estimator yields the same result. More specifically, it can be shown that the esti- mate for δ in the regression equation below is equivalent to
∙
:
∙ (1)
where i indexes items and t indexes the period of observation.
The dependent variable lnPRICE is the natural logarithm of the price indices for items. The variable TAXCUT is a dummy variable indicating the post-tax cut period. The variable TREATMENT captures possible differences between fertilis- ers and four pesticides. The variable TAXCUT ∙ TREATMENT is an interaction term between these two binary variables. In this case, the main parameter of interest is δ.
For the data horizon in our main DID estimations, we focus on a two-month window, four-month window, and six- month window centred around the date of the tax cut, Janu- ary 1, 2016. For instance, if the window size is two months, then the period of the analysis is December – January. We do not focus on larger window sizes due to the possibility of other exogenous factors that can affect fertiliser prices as the data window gets longer.
In order to test the robustness of the results, we perform the same DID approach as above, but with three different periods: (1) January 1, 2018, (2) January 1, 2019, and (3) January 1, 2020. In other words, we re-construct our baseline regressions as if the tax reduction decision took place on the same day at different years. This assumption is known as the parallel-trends assumption. If these alternative regressions concluded that estimated effects are statistically insignificant and very small, we could say that our main results are robust.
This means that in the absence of the tax reduction decision, fertiliser prices (treatment group) and pesticides prices (con- trol group) have a similar trend over time.
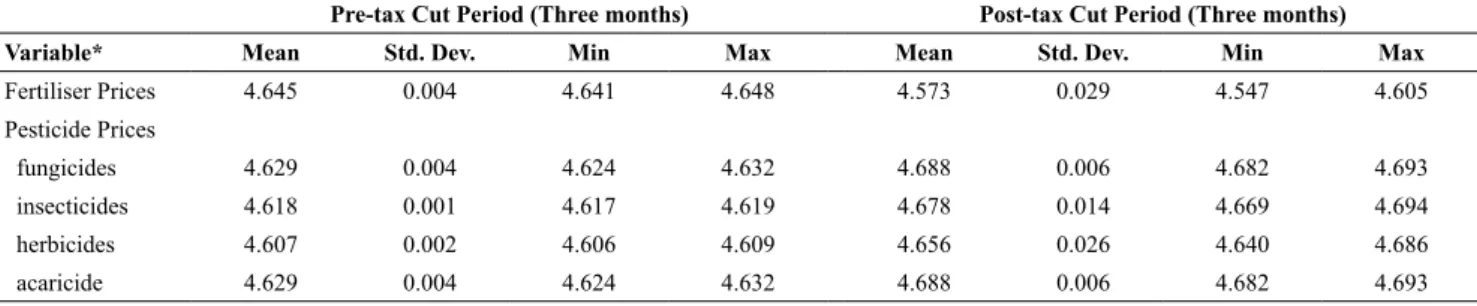
In the paper, fertiliser price was used as a treatment vari- able, and four pesticide prices (fungicides, insecticides, her- bicides, and acaricide) were used as control variables. We employed sub-indices of the Agricultural Input Price Index collected and published for the first time in March 2020 at the national level by TurkStat. Moreover, all prices are monthly average prices and used in logarithmic forms. The summary statistics on these variables are presented in Table 2.
Table 1: The illustration of Difference-in-Differences Estimation.
Prices Fertilisers (F) Pesticides (P) Difference
T0 = pre-tax cut period P0, F P0, P P0, F – P0, P
T1 = post-tax cut period P1, F P1, P P1, F – P1, P
Change P1, F – P0, F P1, P – P0, P
∙ Source: own composition
Table 2: Descriptive statistics of the variables analysed.
Pre-tax Cut Period (Three months) Post-tax Cut Period (Three months)
Variable* Mean Std. Dev. Min Max Mean Std. Dev. Min Max
Fertiliser Prices 4.645 0.004 4.641 4.648 4.573 0.029 4.547 4.605
Pesticide Prices
fungicides 4.629 0.004 4.624 4.632 4.688 0.006 4.682 4.693
insecticides 4.618 0.001 4.617 4.619 4.678 0.014 4.669 4.694
herbicides 4.607 0.002 4.606 4.609 4.656 0.026 4.640 4.686
acaricide 4.629 0.004 4.624 4.632 4.688 0.006 4.682 4.693
* All data are in logarithmic form.
Source: own composition
Conclusions
The study investigates the impact of a tax cut on agri- cultural input prices. On January 1, 2016, the Turkish government reduced the VAT of fertiliser from 18 percent to 1 percent. In addition, by adding fertiliser to the list of VAT-exempt products on February 10, 2016, the tax on fertilisers was removed entirely. In order to investigate the impact of the tax cut decisions on fertiliser prices, we use the difference-in-differences (DID) approach. Our findings indicate that the reduction in the tax was passed on to fer- tiliser prices. In the first month after the tax reduction, the fertiliser prices decreased by 8.9 percent. In the second and third months, the price decline reached 10.9 percent and 12.8 percent, respectively. If the fertiliser prices had dropped by 15.3 percent after the tax was removed entirely, a full pass-through would have been obtained. Consequently, the pass-through rate is calculated as 83.7 percent for the end of March. Although a full pass-through was not obtained, the simple DID estimations provide some hints that consumers benefited significantly from the tax reduction decisions.
The study indicates that the tax cut decision has decreased fertiliser prices in the short term in Turkey. It does not focus on a larger period due to the possibility of other exogenous factors that can affect fertiliser prices as the data period gets longer. Lately, the Turkish economy has faced a number of critical events such as elections, a failed coup attempt on July 15, 2016, and tensions between Turkey and the United States. Most of these events have caused the deterioration of many macroeconomic variables in Turkey, especially the depreciation of the Lira. Since agricultural inputs, including fertilisers and pesticides, are mostly imported from abroad, they are very sensitive to exchange rate shocks. For instance,
Empirical results
The results seen in Table 3 display that the coefficient on TAXCUT X TREATMENT, which the parameter of interest, is negative and statistically significant at a 1 per- cent significance level in three different window sizes.
For a 2-month window (the analysis period of December and January), fertiliser prices decrease by 8.9 percent at a 1 percent significance level. Moreover, it is observable that the fall in fertiliser prices accelerates for 4- and 6-month windows. We can say that fertiliser prices’ inclusion in the VAT exemption announced on February 10 also has an effect on these decreases. Thus, the magnitude of the coefficient is between -8.9 percent and -12.8 percent for three different window sizes.
These results provide evidence that tax reduction deci- sions have a statistically significant effect on fertiliser prices.
Also, the pass-through continues for three months from the date of the tax cut decision on January 1, 2016. However, a full pass-through rate was not observed as of the end of March 2016. A full pass-through of the tax reduction deci- sions would amount to a price decrease of 15.3 percent after the complete removal of the tax on fertiliser on February 10, 2016. Thus, the pass-through rate can be calculated as 83.7 percent for March 2016.
We focused on finding the short-term consequences of the tax cut decision because of the possibility of other exogenous factors that can affect our variables. For instance, if the analysis period were longer to cover the year 2018, the exchange rate shock resulting from the deterioration of Turkey-US relations would have been included in the analy- sis. In such a case, it would not be possible to see the effect of the tax reduction on fertiliser prices since the prices were also affected by the exchange rate shock. The impact of the exchange rate shock can be seen in Figure 2. As a result of the 41% deprecation of the Turkish Lira against the U.S.
dollar, the price of fertilisers increased dramatically in the second half of 2018.
The actual tax cut date for the policy reform is January 1, 2016. As a robustness check, we re-constructed our DID estimates based on three different dates: (1) January 1, 2018, (2) January 1, 2019, and (3) January 1, 2020. Table 4 pre- sents the results of our robustness-check exercise. Results suggest that the estimated effects are very small and statisti- cally insignificant. Therefore, we conclude that our original results are robust to using treatment dates.
Table 3: The Results for the Difference-in-Differences Estimations.
Dependent Variable: LnPRICE
2-month window 4-month window 6-month window
Variable Coefficient St. Error Coefficient St. Error Coefficient St. Error
Tax_cut 0.048*** 0.006 0.048*** 0.005 0.057*** 0.005
TreatmentXtaxcut -0.089*** 0.013 -0.109*** 0.010 -0.128*** 0.012
Constant 4.628*** 0.004 4.627*** 0.003 4.626*** 0.003
Fixed Effect Yes Yes Yes
R-squared 0.765 0.735 0.798
Observations 10 20 30
*** Refers to a 1% significance level. Standard errors are reported in parentheses. The window size describes the length of the period for the analysis. The starting day of policy implementation (January 1) is at the centre of the window. For example, if the window size is 2 months, then the period of the analysis is December – January.
Source: own composition
Table 4: Falsification tests for robustness checks.
Dependent Variable: Log Price
4-month window Coefficient St. Error
2017-2018 0.008 0.014
2018-2019 -0.004 0.008
2019-2020 -0.004 0.009
Fixed Effects Yes
Observations 20
***, **, and * refer to 1%, 5%, and 10% significance levels, respectively. Standard errors are reported in parentheses. The 4-month window represents that the period of the analysis is November – February of the corresponding year.
Source: own composition
the detention of an American pastor in Turkey led to one of the gravest crises in the history of Turkey-US relations in 2018. The Turkish Lira depreciated by 41 percent in the first eight months of 2018 and the prices of fertilisers and pesti- cides increased significantly in 2018. Therefore, this paper has focused on the short term in order to avoid the contami- nating effects of these events on prices.
REFERENCES
Alm, J., Sennoga, E., and Skidmore, M. (2009): Perfect Compe- tition, Urbanization, and Tax Incidence in the Retail Gaso- line Market. Economic Inquiry, 47 (1), 118–134. https://doi.
org/10.1111/j.1465-7295.2008.00164.x
Balkan, B., Kal, S. H. and Tümen, S. (2015): Akaryakıt Fiyatlarının Nakliye Maliyetleri Kanalı ile Taze Meyve-Sebze Fiyatları Üzerindeki Etkisinin İncelenmesi. Ankara: CBRT. https://doi.
org/10.13140/RG.2.2.18632.52487
Berardi, N., Sevestre, P., Tépaut, M. and Vigneron, A. (2016):
The impact of a ‘soda tax’ on prices: evidence from French micro data. Applied Economics, 48 (41), 3976–3994.
doi: https://doi.org/10.1080/00036846.2016.1150946
Besley, T. J., and Rosen, H. S. (1998): Sales Taxes and Prices: An Empirical Analysis. Cambridge: NBER Working Paper 6667.
Chiou, L. and Muehlegger, E. (2010): Consumer Response to Cigarette Excise Tax Changes. HKS Faculty Research Working
Paper Series, RWP10-020, John F. Kennedy School of Govern- ment, Harvard University.
Çıplak, U. and Yücel, M. E. (2004): İthalatta Koruma Önlemleri ile Tarım ve Gıda Fiyatları. Ankara: TCMB Çalışma Tebliği, 4 (1), 1–28.
Doyle., J. J. and Samphantharak, K. (2008): $2.00 Gas! Studying the effects of a gas tax moratorium. Journal of Public Econom- ics, 92 (3–4), 869–884. https://doi.org/10.3386/w12266 Eren, O., Kal, S.H. and Özmen, M.U. (2017): Türkiye’de Gıda
Enflasyonunun Belirleyicileri. Ankara: CBRT.
FAOSTAT (2020): Consumer Price Indices. Retrieved from: http://
www.fao.org/faostat/en/#data/CP (Accessed in July 2020) Fullerton, D. and Metcalf, G.E. (2002): Tax Incidence. Handbook
of Public Economics, 4, 1787–1872.
Hanson, A. and Sullivan, R. (2009): The Incidence of Tobacco Tax- ation: Evidence from Geographic Micro-Level Data. National Tax Journal, 62 (4), 677–698.
Kenkel, D.S. (2005): Are Alcohol Tax Hikes Fully Passed Through to Prices? Evidence from Alaska. American Economic Review, 95 (2), 273–277. https://doi.org/10.1257/000282805774670284 Ozbugday, F.C. and Nillesen, P.H. (2013): Efficiency and Prices
of Regulation-Exempt Consumer-Owned Natural Monopolies:
A First Look at Electricity Distributors in New Zealand. An- nals of Public and Cooperative Economics, 84 (4), 361–381.
https://doi.org/10.1111/apce.12019
TURKSTAT (2020): Agricultural Input Price Index. Retrieved from: http://www.turkstat.gov.tr/PreTablo.do?alt_id=1113 (Ac- cessed in March 2020)