Supporting Information
Mechanochemical synthesis of the NiSn, CuSn bimetallic and NiCuSn trimetallic nanocomposite using various type of additives
Katalin Musza
a,b, Márton Szabados
a,b, Adél Anna Ádám
a,b, Péter Bélteky
c, Zoltán Kónya
c,d, Ákos Kukovecz
c, Pál Sipos
b,eand István Pálinkó
a,b*aDepartment of Organic Chemistry, University of Szeged, Dóm tér 8, Szeged, H-6720 Hungary
bMaterial and Solution Structure Research Groupand Interdisciplinary Excellence Centre, Institute of Chemistry, University of Szeged, Aradi vértanúk tere 1, Szeged, H-6720 Hungary
cDepartment of Applied and Environmental Chemistry, University of Szeged, Rerrich B. tér 1, Szeged, H- 6720 Hungary
dMTA-SZTE Reaction Kinetics and Surface Chemistry Research Group, Rerrich B. tér 1, Szeged, H-6720 Hungary
eDepartment of Inorganic and Analytical Chemistry, University of Szeged, Dóm tér 7, Szeged, H-6720 Hungary
*Corresponding author.
E-mail address: palinko@chem.u-szeged.hu (I. Pálinkó)
10 20 30 40 50 60 70 80 without additive
Intensi ty (a .u.)
2 ()
• (024)
- -
- -
- -
• (422) •
Cu
6Sn
5(354) • (351) •
(442) • • (530) • (241) • (132) •
• (402)
75 mm3 100 mm3 125 mm3 250 mm3
50 mm3 500 mm3 • (221) -
(623)
• (221)
n-Heptane
10 20 30 40 50 60 70 80
5 wt%
3 wt%
2 wt%
1.5 wt%
1 wt%
0.5 wt.%
Intensi ty (a .u.)
NaCl
2 ()
•
Cu
6Sn
5- -
- -
- -
• (422)
(354) • (351) •
(442) • (530) • • (241) • (132) •
• (402) • (221) -
(623)
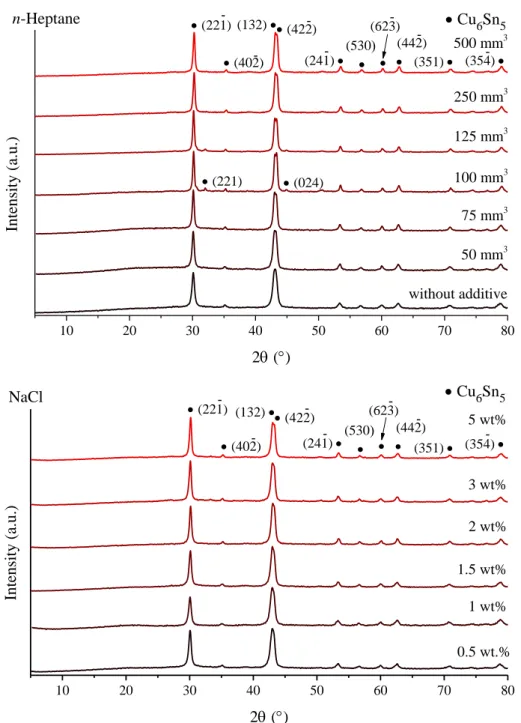
Fig. S1 X-ray diffraction patterns of the milled Cu-Sn starting reagents without and using
n-heptane and NaCl as milling additives.
10 20 30 40 50 60 70 80
❖
Cu
⧫Sn Oleylamine
Intensi ty (a .u.)
500 mm3
250 mm3
125 mm3 100 mm3 75 mm3 50 mm3
2 ()
(312)
⧫
(220)❖
❖(200) (111)❖
(301) ⧫
⧫(101) (200)⧫
(220)
⧫
⧫(211) (420)
⧫(321) (112)⧫⧫
(400)
⧫(411)
⧫
10 20 30 40 50 60 70 80
(312)
⧫
(220)❖
❖(200) (111)❖
(301) ⧫
Polyethylene glycol
Intensit y (a.u.)
2 ()
50 mm3 75 mm3 100 mm3 125 mm3 250 mm3 500 mm3
❖
Cu
⧫Sn Cu
2O
⧫(101) (200)⧫
(220)
⧫
⧫(211) (420)
⧫(321) (112)⧫⧫
(400)
⧫(411)
⧫
(111)
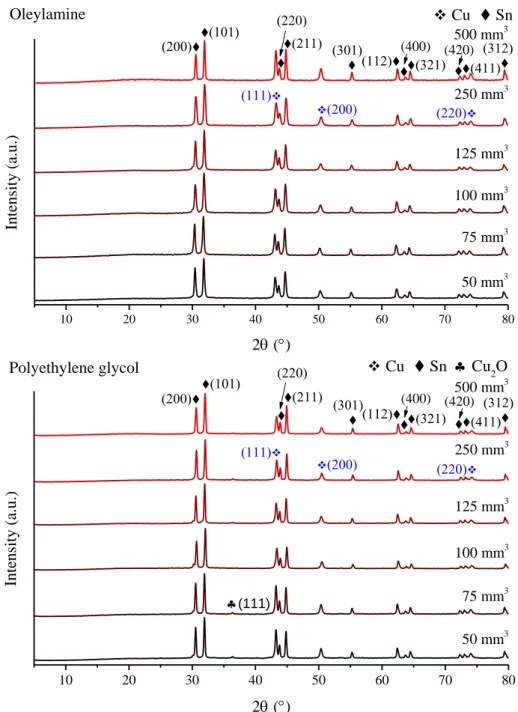
Fig. S2 The X-ray diffractograms of the end-products of mechanochemical treatment with
oleylamine or polyethylene glycol added in different amounts.
10 20 30 40 50 60 70 80 (200)
⧫
❖ (111) (211)
⧫ ❖ (200)
⧫ (101)
Polyvinylpyrrolidone
• Cu6
Sn
5❖Cu⧫
Sn
0.5 wt.%
1 wt.%
1.5 wt.%
2 wt.%
3 wt.%
5 wt.%
2 ()
Intensi ty (a .u.)
- - -
- - -
• (422)
(354) • (351) •
(442) • • (530) • (241) • (132) •
• (402) • (221) -
(623)
10 20 30 40 50 60 70 80
⧫(321)
⧫(301)
• Cu6
Sn
5❖Cu⧫
Sn Cetyltrimethylammonium bromide
Intensi ty (a .u.)
2 ()
0.5 wt%
1 wt%
1.5 wt%
2 wt%
3 wt%
5 wt%
- - -
- - -
• (422)
(354) • (351) •
(442) • • (530) • (241) • (132) •
• (402) • (221) -
(623) (200) ⧫
(111)❖ ⧫(211) (200)❖
⧫ (101)
10 20 30 40 50 60 70 80 (111)❖
(411) (420)
-
❖(220) (312)
⧫ ⧫
⧫(321) ⧫ (112)⧫⧫ (301) ⧫ (200)⧫
Intensit y (a.u.)
2 ()
0.5 wt%
1 wt%
1.5 wt%
2 wt%
3 wt%
5 wt%
• Cu
6
Sn
5❖Cu⧫
Sn Sodium dodecyl sulphate
⧫(211) (200)❖ (220)
⧫
⧫ (101)
- - -
- - -
• (422)
(354) • (351) •
(442) • • (530) • (241) • (132) •
• (402)
• (221) (623)
(400)
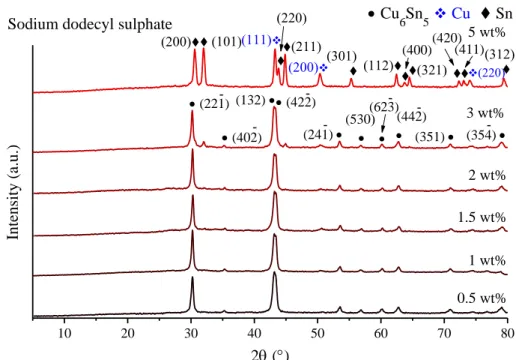
Fig. S3 XRD patterns of the milling end-products in the presence of varying amounts of PVP, CTAB or SDS surfactants.
Table S1
Phase distribution of the samples generated and cell parameters of the Cu
6Sn
5intermetallics.
Milled systems Crystal phase distribution (wt%) Cell parameters
Cu6Sn5 Cu Sn Ni a (Å) b (Å) c (Å) (°)
Cu-Sn, n-Heptane (500 mm3)
92.5 ± 6.2 4 ± 0.8 3.4 ± 0.9 − 11.0445
± 0.0189
7.2619
± 0.0139
9.8422
± 0.0212
98.8939
± 0.1878 Cu-Sn,
n-Heptane (250 mm3)
94.4 ± 4.2 3.4 ± 0.8 2.2 ± 0.9 − 11.0204
± 0.0171
7.2756
± 0.0155
9.8197
± 0.019
98.9396
± 0.161 Cu-Sn,
n-Heptane (125 mm3)
93.4 ± 3.9 3.5 ± 0.8 3.1 ± 0.6 − 11.0168
± 0.0175
7.2697
± 0.0155
9.819
± 0.0195
98.9363
± 0.166 Cu-Sn,
n-Heptane (100 mm3)
91.6 ± 6.0 3 ± 0.8 5.4 ± 1 − 11.0207
± 0.0183
7.2724
± 0.0161
9.8234
± 0.0203
98.9217
± 0.1731 Cu-Sn,
n-Heptane (75 mm3)
92.4 ± 5.7 5.5 ± 0.9 2.1 ± 1.3 − 11.0268
± 0.018
7.2759
± 0.0159
9.8278
± 0.02
98.9122
± 0.1702 Cu-Sn,
n-Heptane (50 mm3)
94.4 ± 4.2 2.9 ± 0.6 2.7 ± 0.3 − 11.0371
± 0.0192
7.279
± 0.0169
9.8319
± 0.0208
98.9874
± 0.1771 Cu-Sn,
without additive
92.6 ± 5.3 5.2 ± 0.8 3.2 ± 0.9 − 11.0447
± 0.0175
7.2735
± 0.0156
9.8354
± 0.0194
98.9426
± 0.1644 Cu-Sn,
NaCl (5 wt%)
93.9 ± 4.8 3.9 ± 0.3 2.2 ± 0.3 − 11.0443
± 0.0167
7.2747
± 0.0149
9.8339
± 0.0185
98.9464
± 0.1573 Cu-Sn,
NaCl (3 wt%)
91.9 ± 4.9 4.3 ± 0.8 3.8 ± 0.8 − 11.0364
± 0.0159
7.2764
± 0.011
9.8359
± 0.0174
98.871
± 0.1488
Cu-Sn, NaCl (2 wt%)
92.2 ± 5.7 3.4 ± 0.7 4.4 ± 0.9 − 11.0283
± 0.0138
7.2852
± 0.0112
9.8277
± 0.0154
98.8962
± 0.1292 Cu-Sn,
NaCl (1.5 wt%)
91.1 ± 6.1 4.9 ± 0.9 4 ± 0.8 − 11.0374
± 0.0164
7.2696
± 0.0112
9.8349
± 0.0178
98.9337
± 0.1508 Cu-Sn,
NaCl (1 wt%)
90.6 ± 4.8 5.5 ± 0.9 3.9 ± 1 − 11.0275
± 0.0151
7.2841
± 0.0102
9.8485
± 0.0149
98.8975
± 0.1338 Cu-Sn,
NaCl (0.5 wt%)
92.5 ± 5.3 3.8 ± 0.6 3.7 ± 0.7 − 11.0562
± 0.0184
7.2687
± 0.0133
9.8456
± 0.019
98.9053
± 0.1668 Cu-Sn,
CTAB (5 wt%)
22.4 ± 1.1 24.9 ± 1.0 52.7 ± 7.8 − 11.0253
± 0.0194
7.2771
± 0.0162
9.8283
± 0.0208
98.9964
± 0.1829 Cu-Sn,
CTAB (3 wt%)
44.0 ± 2.4 16.7 ± 0.9 39.3 ± 6.6 − 11.0438
± 0.0183
7.2866
± 0.0140
9.8413
± 0.0193
98.9956
± 0.1666 Cu-Sn,
CTAB (2 wt%)
47.7 ± 3 15.2 ± 0.9 37.1 ± 5.9 − 11.0490
± 0.0174
7.2651
± 0.0128
9.8428
± 0.019
98.9174
± 0.1688 Cu-Sn,
CTAB (1.5 wt%)
61.9 ± 3.7 15.1 ± 0.7 23 ± 2.3 − 11.0351
± 0.0176
7.2788
± 0.0156
9.8324
± 0.0196
98.9235
± 0.1666 Cu-Sn,
CTAB (1 wt%)
72.7 ± 4.9 14.2 ± 0.9 13.1 ± 1.1 − 11.0231
± 0.0181
7.2756
± 0.0159
9.8268
± 0.0201
98.9417
± 0.1709 Cu-Sn,
CTAB (0.5 wt%)
91.6 ± 6.2 5.5 ± 0.8 2.9 ± 0.9 − 11.0479
± 0.0182
7.2626
± 0.0132
9.8232
± 0.0198
98.9425
± 0.17 Cu-Sn,
PVP (5 wt%)
48.9 ± 4.3 21.9 ± 1.3 29.2 ± 4.3 − 11.0309
± 0.0176
7.2789
± 0.0155
9.8301
± 0.0195
98.9284
± 0.1664 Cu-Sn,
PVP (3 wt%)
87.6 ± 4 5.5 ± 0.8 6.9 ± 1.1 − 11.0304
± 0.0189
7.2762
± 0.0167
9.8298
± 0.0210
98.9288
± 0.1784 Cu-Sn,
PVP (2 wt%)
89.8 ± 5.2 4.8 ± 0.8 5.4 ± 0.9 − 11.0499
± 0.0172
7.2677
± 0.0126
9.8426
± 0.0187
98.9186
± 0.1665 Cu-Sn,
PVP (1.5 wt%)
90.7 ± 4.1 4.4 ± 1.2 4.9 ± 1 − 11.0584
± 0.0170
7.2614
± 0.0125
9.8444
± 0.0186
98.9740
± 0.1584 Cu-Sn,
PVP (1 wt%)
92 ± 4.1 4.1 ± 0.9 3.9 ± 0.6 − 11.0520
± 0.0198
7.2776
± 0.0144
9.8635
± 0.0223
98.6979
± 0.1909 Cu-Sn,
PVP (0.5 wt%)
93.4 ± 5.2 3.9 ± 0.8 2.7 ± 0.8 − 11.0413
± 0.0176
7.2822
± 0.0155
9.8362
± 0.0195
98.8818
± 0.1661 Cu-Sn,
ethylene glycol (500 mm3)
80.3 ± 5.7 6.8 ± 0.8 12.9 ± 1.2 − 11.0292
± 0.0153
7.2701
± 0.0115
9.8131
± 0.0159
98.9772
± 0.1286 Cu-Sn,
ethylene glycol (250 mm3)
52.2 ± 4.3 15.6 ± 0.9 32.2 ± 4.6 − 11.0215
± 0.0194
7.2913
± 0.0157
9.8262
± 0.0216
98.8528
± 0.1831 Cu-Sn,
ethylene glycol (125 mm3)
58 ± 4.6 16.9 ± 1.1 25.1 ± 3.2 − 11.0367
± 0.0176
7.2721
± 0.0156
9.8233
± 0.0196
98.9154
± 0.1668 Cu-Sn,
ethylene glycol 49.3 ± 3.7 14.4 ± 0.9 36.3 ± 5.3 − 11.0287
± 0.018
7.2726
± 0.0158
9.8273
± 0.0199
98.928
± 0.1699
(100 mm3) Cu-Sn, ethylene glycol (75 mm3)
46.1 ± 4.1 19.2 ± 1.0 34.7 ± 4.8 − 11.0201
± 0.0174
7.2764
± 0.0152
9.8245
± 0.0202
98.9408
± 0.1705 Cu-Sn,
ethylene glycol (50 mm3)
28.7 ± 1.5 24.4 ± 1.1 46.9 ± 7.4 − 11.0457
± 0.0168
7.2645
± 0.0127
9.8444
± 0.0188
99.014
± 0.1479 Cu-Sn,
SDS (3 wt%)
71.5 ± 5.5 14.2 ± 1.1 14.3 ± 2.3 − 11.0521
± 0.017
7.2777
± 0.0124
9.8230
± 0.0185
98.8733
± 0.1549 Cu-Sn,
SDS (2 wt%)
82.1 ± 5.9 11.3 ± 1 6.6 ± 1.0 − 11.0476
± 0.0164
7.2749
± 0.012
9.8274
± 0.0179
98.7477
± 0.1493 Cu-Sn,
SDS (1.5 wt%)
83.2 ± 5.9 11 ± 1.1 5.8 ± 0.9 − 11.0424
± 0.0173
7.281
± 0.0119
9.832
± 0.0189
98.8282
± 0.1614 Cu-Sn,
SDS (1 wt%)
89.6 ± 6.1 4.2 ± 0.8 6.2 ± 1 − 11.0334
± 0.0164
7.2737
± 0.0121
9.8189
± 0.0183
98.8928
± 0.1535 Cu-Sn,
SDS (0.5 wt%)
92.2 ± 6.2 3.4 ± 0.8 4.4 ± 0.9 − 11.0341
± 0.0118
7.2893
± 0.0104
9.8173
± 0.0127
98.8699
± 0.0998 Ni-Cu-Sn,
CTAB (5 wt%)
17.3 ± 0.9 29.8 ± 1.9 28.7 ± 4.6 24.2 ± 1.3 11.0370
± 0.0274
7.2847
± 0.0138
9.8302
± 0.0269
98.8655
± 0.2025 Ni-Cu-Sn,
PVP (5 wt%)
25.1 ± 0.8 17.6 ± 0.8 33.4 ± 5.8 23.9 ± 0.9 11.0227
± 0.0096
7.2950
± 0.0087
9.8288
± 0.0096
98.8752
± 0.0791 Ni-Cu-Sn,
ethylene glycol (50 mm3)
32.5 ± 2.7 19.5 ± 1.9 25.8 ± 5.2 22.2 ± 1.7 11.0369
± 0.0101
7.2964
± 0.0088
9.8036
± 0.0115
98.9424
± 0.0887 Ni-Cu-Sn,
SDS (5 wt%)
59.9 ± 3.4 9.1 ± 1.4 9.9 ± 3 21.1 ± 2.7 11.0360
± 0.0121
7.3022
± 0.101
9.8149
± 0.0129
99.0189
± 0.1095 Ni-Cu-Sn,
without additive
66.4 ± 3.8 4.1 ± 0.7 4.2 ± 0.8 25.3 ± 1.9 11.0441
± 0.0295
7.2723
± 0.0162
9.8324
± 0.0313
98.7267
± 0.2361 Ni-Cu-Sn,
n-heptane (125 mm3)
67.6 ± 4.9 3.2 ± 0.7 4.4 ± 1.1 24.8 ± 1.1 11.0425
± 0.0149
7.2850
± 0.009
9.8359
± 0.0138
98.7452
± 0.1284 Ni-Cu-Sn,
NaCl (5 wt%)
71.8 ± 5 3.5 ± 1.2 3.4 ± 1.1 21.3 ± 1.6 11.0281
± 0.0160
7.2739
± 0.0134
9.8362
± 0.0172
98.7116
± 0.1427
10 20 30 40 50 60 70 80 (220)◼
◼
Ni⧫
Sn
Intensi ty (a .u.)
2 () Oleylamine
500 mm3
250 mm3
100 mm3 50 mm3 (111)◼
(200)◼
(312) (301) ⧫
⧫
⧫(101) (200)⧫
(220)
⧫
⧫(211)
(420)
⧫(321) (112)⧫⧫
(400)
⧫(411)
⧫
10 20 30 40 50 60 70 80
Intensi ty (a .u.)
2 ()
◼ Ni
⧫Sn Polyethylene glycol
500 mm3
250 mm3
100 mm3
50 mm3 (220)◼ (111)◼
(200)◼
(312) (301) ⧫
⧫
⧫(101) (200)⧫
(220)
⧫
⧫(211)
(420)
⧫(321)
⧫ (112)⧫
(400)
⧫(411)
⧫
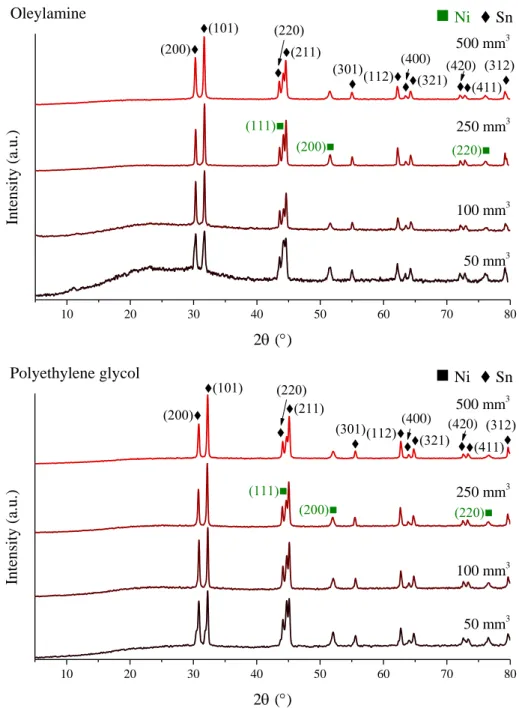
Fig. S4 X-ray diffraction patterns of the milled Ni and Sn starting reagents using oleylamine
or polyethylene glycol as milling additives.
10 20 30 40 50 60 70 80
(201) (002)
(101)
Intensi ty (a .u.)
Polyvinylpyrrolidone
2 ()
1 wt%
3 wt%
5 wt%
Ni3
Sn ◼
Ni⧫
Sn
unidentified reflections
(312)
⧫ (301)
⧫
⧫(101)
(220)
⧫
⧫(211)
(420)
⧫(321) (112)⧫⧫
(400)
⧫(411)
⧫ (200)⧫
(111)◼ (200)◼
(220)◼
10 20 30 40 50 60 70 80
Intensi ty (a .u.)
2 () Cetyltrimethylammonium bromide
5 wt%
unidentified reflections
3 wt%
1 wt%
(200)◼
(220)◼ (111)◼
(312) (301) ⧫
⧫
⧫(101)
(200)⧫ (220)
⧫
⧫(211)
(420)
⧫(321)
⧫ (112)⧫(400)
⧫(411)
⧫
(101) (002)
(201)
Ni3
Sn ◼
Ni⧫
Sn
10 20 30 40 50 60 70 80
1 wt%
Intensi ty (a .u.)
Sodium dodecyl sulphate
2 ()
0.5 wt%
3 wt%
5 wt%
unidentified reflections
(312) (301) ⧫
⧫
⧫(101) (200)⧫
(220)
⧫
⧫(211)
(420)
⧫(321)
⧫ (112)⧫
(400)
⧫(411)
⧫
(220)◼ (111)◼
(200)◼
Ni3
Sn ◼
Ni⧫
Sn
(201) (002)
(101)
10 20 30 40 50 60 70 80
250 mm3
100 mm3
Intensi ty (a .u.)
2 () Ethylene glycol
unidentified reflections500 mm3
50 mm3 (312) (301) ⧫
⧫
⧫(101) (200)⧫
(220)
⧫
⧫(211) (420)
⧫(321) (112)⧫⧫
(400)
⧫
(220)◼ (111)◼
(200)◼
Ni3
Sn ◼
Ni⧫
Sn
(002)
(201) (101)
10 20 30 40 50 60 70 80 (220)◼ (301)
⧫
(200)◼ (111)◼ (220)⧫
Intensi ty (a .u.)
2 ()
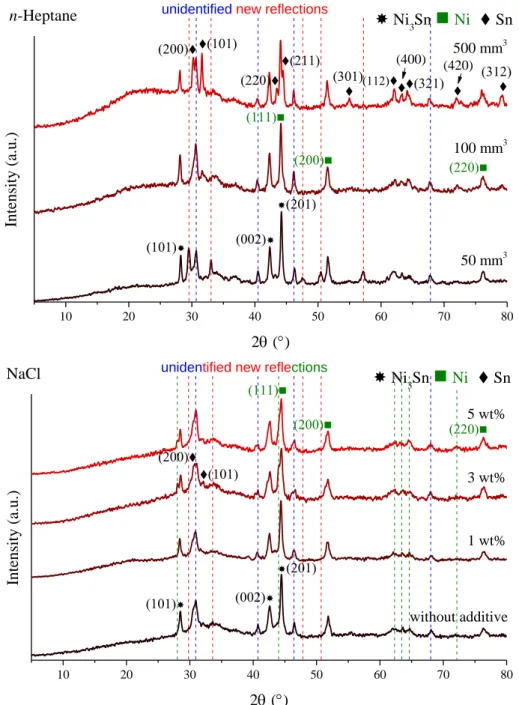
50 mm3 100 mm3 500 mm3 n-Heptane unidentified new reflections
⧫(101) (200)⧫
⧫(211)
⧫(321) (112)⧫⧫
(400)
(312)
⧫ (420)
⧫
(201) (002)
(101)
Ni3
Sn ◼
Ni⧫
Sn
10 20 30 40 50 60 70 80
1 wt%
Intensi ty (a .u.)
NaCl
2 ()
without additive 3 wt%
5 wt%
Ni3
Sn ◼
Ni⧫
Sn
unidentified new reflections (111)◼
(220)◼ (200)◼
(201) (002)
⧫(101) (200)⧫
(101)
Fig. S5 XRD patterns of the milling end-products in the presence of varying amounts of PVP, CTAB, SDS, ethylene glycol, n-heptane or NaCl additives and in the absence of additive.
Table S2
Lattice parameters of the formed hexagonal Ni
3Sn intermetallics.
Milled systems Lattice parameters
a (Å) c (Å) a (Å) c (Å) a (Å) c (Å)
Ni-Sn, PVP (3 wt%)
5.3056
± 0.007
4.2281
± 0.0045
Ni-Sn, CTAB (3 wt%)
5.3087
± 0.0196
4.2357
± 0.0126
Ni-Sn, SDS (1 wt%)
5.3245
± 0.0122
4.2194
± 0.0097 Ni-Sn,
PVP (1 wt%)
5.3263
± 0.0112
4.228
± 0.0072
Ni-Sn, CTAB (1 wt%)
5.3359
± 0.0121
4.2369
± 0.0129
Ni-Sn, SDS (0.5 wt%)
5.3131
± 0.0114
4.2201
± 0.0121
Ni-Sn,
ethylene glycol (500 mm3)
5.3556
± 0.0037
4.2376
± 0.0023
Ni-Sn, n-heptane (500 mm3)
5.3634
± 0.0015
4.2341
± 0.001
Ni-Sn, NaCl (5 wt%)
5.3536
± 0.0123
4.2268
± 0.0078 Ni-Sn,
ethylene glycol (250 mm3)
5.3626
± 0.0078
4.2328
± 0.0049
Ni-Sn, n-heptane (100 mm3)
5.3553
± 0.0015
4.2348
± 0.001
Ni-Sn, NaCl (3 wt%)
5.3435
± 0.0172
4.226
± 0.0109 Ni-Sn,
ethylene glycol (100 mm3)
5.3614
± 0.0145
4.2359
± 0.0092
Ni-Sn, n-heptane (50 mm3)
5.3558
± 0.0044
4.228
± 0.0028
Ni-Sn, NaCl (1 wt%)
5.3555
± 0.0023
4.2274
± 0.0015 Ni-Sn,
without additive
5.3594
± 0.0042
4.2385
± 0.0026
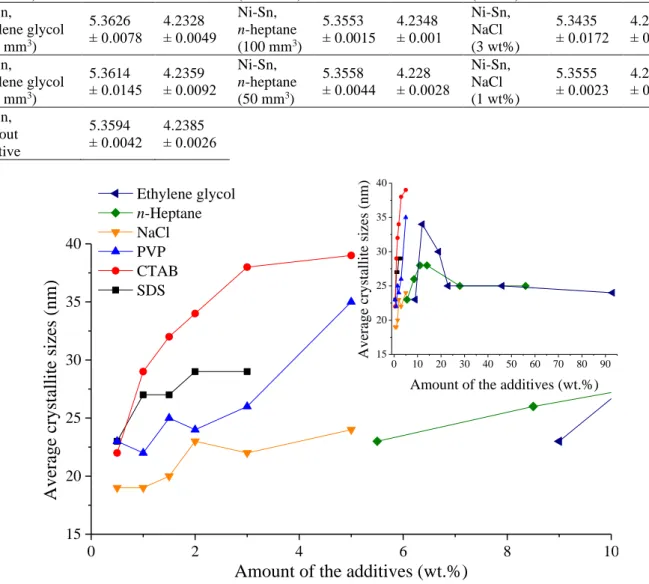
0 10 20 30 40 50 60 70 80 90 15
20 25 30 35 40
0 2 4 6 8 10
15 20 25 30 35 40
Average crystallite sizes (nm)
Amount of the additives (wt.%)
Av era ge cr ystal li te s iz es (nm)
Amount of the additives (wt.%)
Ethylene glycol n-Heptane NaCl PVP CTAB SDS
Fig. S6 The changes of the crystallite sizes of -bronze (Cu
6Sn
5) monitored through the variation of the amount of added milling additives compared to the total mass of the starting metal reagents.
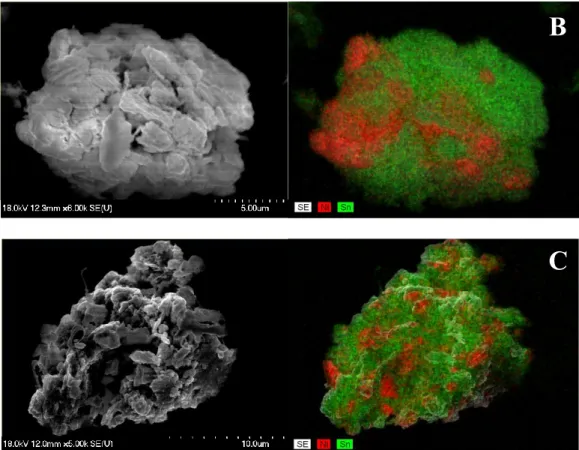
A
Fig. S7 SEM images and the corresponding elemental distribution maps derived by the energy dispersive X-ray analysis of the milled Ni-Sn powders with 5 wt.% NaCl (A), 50 mm
3oleylamine (B) and 5 wt.% PVP (C).
B
C
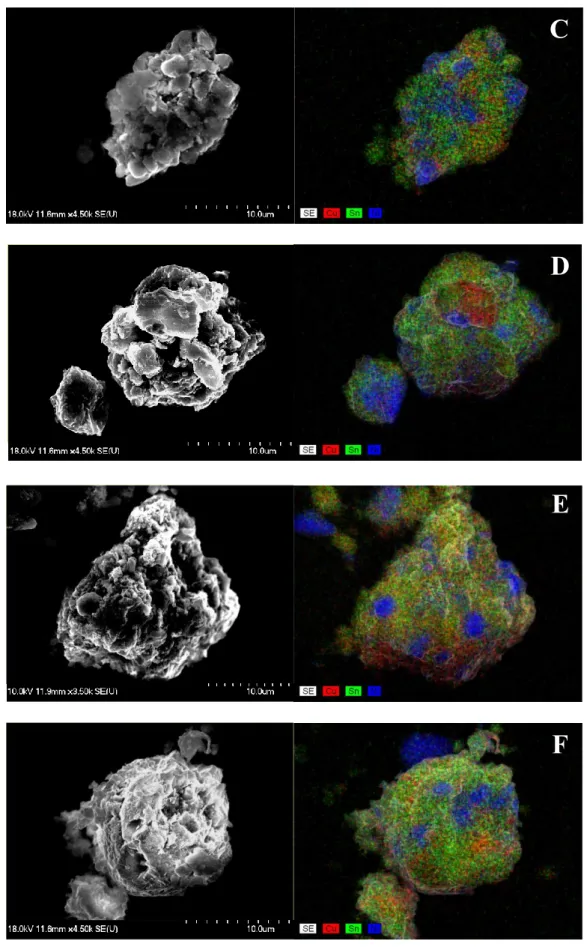
A
B
Fig. S8 SEM images and the corresponding elemental distribution maps registered by the energy dispersive X-ray analysis of the milled Ni-Cu-Sn powders with 50 mm
3polyethylene
C
D
E
F
glycol (A) oleylamine (B) and ethylene glycol (C) and 2 wt.% SDS (D), PVP (E) and CTAB (F).
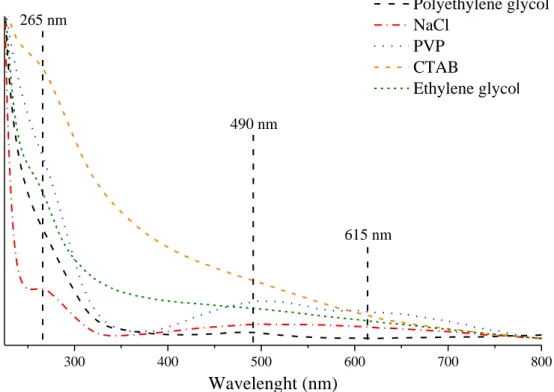
300 400 500 600 700 800
265 nm
Polyethylene glycol NaCl
PVP CTAB
Ethylene glyco
lNo rmal iz ed absorbance (a .u.)
Wavelenght (nm)
490 nm
615 nm
Fig. S9 UV-visible absorption spectra of the Ni-Cu-Sn nanocomposite using polyethylene
glycol (50 mm
3), NaCl (5 wt%), PVP (5 wt%), CTAB (5 wt%) and ethylene glycol (50 mm
3)
milling additives.
0.0 0.2 0.4 0.6 0.8 1.0 0.0
0.5 1.0 1.5 2.0 2.5 3.0
Q u an ti ty a d so rb ed g as ( cm
3/g S T P )
Relative pressure (p/p
0)
In absence of additive Adsorption
Desorption
0.0 0.2 0.4 0.6 0.8 1.0
0 5 10 15 20 25
Q u an ti ty a d so rb ed g as ( cm
3/g S T P )
Relative pressure (p/p
0)
Cetyltrimethylammonium bromide Adsorption
Desorption
0.0 0.2 0.4 0.6 0.8 1.0 0
5 10 15 20 25 30 35 40 45
Adsorption Desorption Polyvinylpyrrolidone
Q u an ti ty a d so rb ed g as ( cm
3/g S T P )
Relative pressure (p/p
0)
0.0 0.2 0.4 0.6 0.8 1.0
5 10 15 20 25
Adsorption Desorption Ethylene glycol
Q u an ti ty a d so rb ed g as ( cm
3/g S T P )
Relative pressure (p/p
0)
0.0 0.2 0.4 0.6 0.8 1.0 0
2 4 6 8 10
Sodium dodecyl sulfate
Q u an ti ty a d so rb ed g as ( cm
3/g S T P )
Adsorption Desorption
Relative pressure (p/p
0)
0.0 0.2 0.4 0.6 0.8 1.0
0 2 4 6 8 10
Q u an ti ty a d so rb ed g as ( cm
3/g S T P )
n-Heptane
Relative pressure (p/p
0)
Adsorption
Desorption
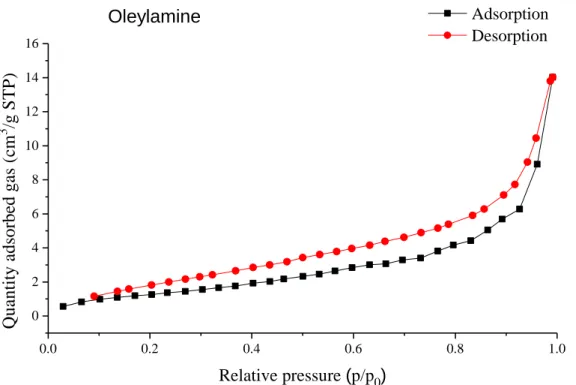
0.0 0.2 0.4 0.6 0.8 1.0 2
4 6 8 10 12 14 16 18
Q u an ti ty a d so rb ed g as ( cm
3/g S T P )
NaCl Adsorption
Desorption
Relative pressure (p/p
0)
0.0 0.2 0.4 0.6 0.8 1.0
0 2 4 6 8 10 12 14
Q u an ti ty a d so rb ed g as ( cm
3/g S T P )
Polyethylene glycol Adsorption
Desorption
Relative pressure (p/p
0)
0.0 0.2 0.4 0.6 0.8 1.0 0
2 4 6 8 10 12 14 16