Adsorption of Azobenzene on Hexagonal Boron Nitride Nanomesh Supported by Rh(111)
A ́ . Szitás, R. Gubó, T. Pásztor, A. P. Farkas, T. Ajtai, L. O ́ vári,* K. Palotás,* A. Berkó, and Z. Kónya
Cite This:J. Phys. Chem. C2020, 124, 14182−14194 Read Online
ACCESS
Metrics & More Article Recommendations*
sı Supporting InformationABSTRACT: Adsorption properties of azobenzene, the prototypical molecular switch, were investigated on a hexagonal boron nitride (h-BN) monolayer (“nanomesh”) prepared on Rh(111). The h-BN layer was produced by decomposing borazine (B3N3H6) at 1000−1050 K. Temperature-programmed desorption (TPD) studies revealed that azobenzene molecules adsorbed on the “wire” and “pore” regions desorb at slightly different temperatures. Angle-resolved high-resolution electron energy loss spectroscopy (HREELS) measurements demonstrated that thefirst molecular layer is characterized predominantly by an adsorption geometry with the molecular plane parallel to the surface. Scanning tunneling microscopy (STM) indicated a clear preference for adsorption in the pores, manifesting a
templating effect, but in some cases one-dimensional molecular stripes also form, implying attractive molecule−molecule interaction.
Density functional theory (DFT) calculations provided further details regarding the adsorption energetics and bonding and confirmed the experimental findings that the molecules adsorb with the phenyl rings parallel to the surface, preferentially in the pores, and indicated also the presence of an attractive molecule−molecule interaction.
1. INTRODUCTION
The discovery of the fascinating properties of graphene, including its self-supporting nature and exceptional electronic properties,1,2 solicited vivid interest in other two-dimensional (2D) materials as well.3−7 Atomically thin hexagonal boron nitride (h-BN) has also been thoroughly investigated.5−7 It is isostructural and isoelectronic to graphene, but the difference in electronegativity results in an insulating character with an electronic band gap of about 6 eV. It has high chemical and thermal stability and also a high predicted thermal con- ductivity.8Quite importantly, 2D hexagonal boron nitride is an excellent support and an ideal spacer for graphene-like nano- and optoelectronics.6,9 Besides, recent studies demonstrated that h-BN alone or decorated with small Au nanoparticles is a highly selective catalyst in oxidative dehydrogenation or partial oxidation reactions.10−12
h-BN monolayers have been “bottom-up” synthesized relatively easily on metal single-crystal surfaces of hexagonal symmetry13−22and also on rectangular ones like Pd(110),23as well as on bcc(110) surfaces, typically using borazine (B3N3H6).6,24 The morphology of the h-BN layer is determined by lattice mismatch and the strength of interaction between the nitride and the metal. The interaction with the elements of the copper group is weak, leading to the formation of a (nearly) planar h-BN monolayer.22,25−29Ruthenium and rhodium bind the nitride strongly. Besides, the lattice mismatch between h-BN and the metal substrate is significant (7.0% for Rh(111) and 8.2% for Ru(0001)), leading to the formation of a periodically corrugated, continuous monolayer of h-BN (“nanomesh”) on these metal substrates.16,19,28,30−32
The binding of h-BN to Rh(111) and Ru(0001) is the
strongest with N atoms at the top position and B atoms in 3- fold hollow sites, which is approximately fulfilled in the so- called“pore”regions.28However, due to the lattice mismatch, there are regions (“wire”) where this registry is not possible, resulting in weaker interactions and larger metal to h-BN distances. Interestingly, the nanomesh structure was observable on the Au/Rh(111) surface alloys as well, up to relatively large Au contents (∼0.9 ML); moreover, the pore diameter decreased significantly with the amount of Au in this range, allowing the tailored tuning of h-BN nanomesh morphology with the gold content.33 The periodically undulating h-BN monolayer formed on Rh(111) can be used as a template for the preparation of metal nanoparticles and related hetero- structures.33−35
The adsorption of (large) organic molecules on metal- supported h-BN monolayers has been intensely studied in the context of electronic decoupling, site-selective adsorption, orientational switching as a function of coverage, site-selective gating and charging, tip-gated charging, and even intercala- tion.7 Possible applications can be diverse, ranging from molecular electronics, heterogeneous catalysis, sensing, to light harvesting. The nanomesh superlattice, specifically, proved to be applicable as a template for the adsorption of organic
Received: February 27, 2020 Revised: June 3, 2020 Published: June 3, 2020
Article pubs.acs.org/JPCC
License, which permits unrestricted use, distribution and reproduction in any medium, provided the author and source are cited.
Downloaded via UNIV OF SZEGED on October 1, 2020 at 05:44:27 (UTC). See https://pubs.acs.org/sharingguidelines for options on how to legitimately share published articles.
molecules, as has already been pointed out for the C60 monolayer on h-BN/Rh(111).32,36−40 A strong preference for binding in the pores of h-BN/Rh(111) at room temperature was demonstrated for naphthalocyanine.32 Phthalocyanines also exhibited preferential adsorption in the pores, close to the pore edge (“wall”in between the pore and wire regions); the mobility of the molecules within the pores was significant already at 77 K, leading to blurred scanning tunneling microscopy (STM) images.38,39
In this paper, we report on the adsorption of azobenzene (C6H5N = NC6H5), a prototypical molecular switch,41−44 which was not yet studied on h-BN prepared on metal single crystals. The main aim of the present study is to search for the preferential adsorption site, bond strength, neighbor inter- action, and characteristic conformation of the molecule via experimental (HREELS, STM, TPD) and density functional theoretical (DFT) investigations.
Gas-phase electron diffraction measurements with data analysis using some structural constraints obtained from ab initio calculations indicated that the energetically most stable structure of separated trans-azobenzene molecules is planar, with aC2hsymmetry.45However, the torsional barrier for one phenyl ring around an N−C bond was found to be rather small:∼0.065 eV.45 Density functional theory (DFT) as well as second- and fourth-order Møller−Plesset perturbation theory (MP2 and MP4) calculations yielded typically planar C2hstructures but in some cases indicated tilted phenyl groups, depending also on the type of basis sets used.45−51 For example, the MP2 method with a 6-31 + G*basis resulted in a torsional angle of 19.5°for the two phenyl rings around the N−C bonds measured from the planar structure, but the energy barrier to the planarity of both phenyl rings was calculated to be small,∼0.04 eV.45Recent electron diffraction studies and theoretical results on trans stilbene indicate that the slight tendency for nonplanarity obtained for azobenzene in a few calculations can be attributed to the deficiency of the ab initio level used.52Since the great majority of calculations and the more recent electron diffraction results suggested planar geometry, as mentioned above, we assumeC2hgeometry for the isolated trans-azobenzene.
2. METHODS
The experiments were carried out in two separate ultrahigh- vacuum (UHV) systems evacuated down to 5×10⁻⁸Pa. The first one was equipped with a commercial scanning tunneling microscope (RT-STM, WA-Technology), a cylindrical mirror analyzer with a central electron gun (Staib-DESA-100) for Auger electron spectroscopy (AES), and a quadrupole mass spectrometer (Balzers-Prisma). Note that, in this chamber, AES and mass spectrometry (MS) were mainly applied to check the surface/ad-metal cleanliness and the gas-phase composition. The Rh(111) sample was mounted on a transferable sample cartridge, equipped with facilities for indirect heating of the crystal by thermal emission of a W- filament heated ohmically. For temperature measurement, a chromel-alumel thermoelement (K type) spot-welded to the side of the probe was applied. The acquisition of STM images was performed by an MK2-A810 SPM controller plus an MK3- HV1 smart piezo driver (SOFT-dB) and open source GXSM Python 2.7 software. STM images of 512 × 512 pixels were recorded in the constant-current (cc) mode at a bias of−1.0 or
−2.0 V on the sample and at a tunneling current in the range 0.02−2 nA, using chemically etched W tips. The final
conditioning of the tip was performed during the scans with voltage (1−5 V) and current (1−5 nA) pulses. The images are shown in top-view representation where brighter areas correspond to higher Z values. The X−Y−Z calibration of the STM images was performed by measuring the character- istic morphological parameters of a clean Rh(111) surface where the lateral nearest neighboring atomic distance of 0.27 nm and the step height of 0.22 nm were considered.
The second UHV system was equipped with an LK EELS 3000 spectrometer for high-resolution electron energy loss spectroscopy (HREELS), a quadrupole mass spectrometer (Balzers-Prisma) for temperature-programmed desorption (TPD), and a cylindrical mirror analyzer for AES. In HREEL spectra, the intensity of the elastic peak was typically in the range of 104−105counts-per-second (cps) with a resolution of 20−40 cm−1 full width at half-maximum (FWHM). All reported spectra were recorded with a primary beam energy of 6.5 eV and at an incident angle of 60°, with respect to the surface normal in the specular direction, unless stated otherwise. Spectra are displayed normalized to the elastic peak intensity, if not stated otherwise. The Rh(111) crystal was mounted on a tantalum wire, which was connected via a copper block to a liquid nitrogen reservoir. The sample was heated resistively from 100 to 1100 K; its temperature was monitored by a chromel-alumel thermocouple spot-welded to the edge of the crystal and was controlled with a feedback circuit to provide a linear heating rate of ca. 4 K/s for TPD measurements.
In both chambers, one-side-polished Rh(111) single crystals (dia. 6 mm×1.5 mm, orientation accuracy: 0.1°) purchased from MaTeck Ltd. were used. The samples were routinely cleaned applying cycles of Ar+ion sputtering (5−10 μA/cm2, 1.5 keV, 20 min) at 300 K and 10 min annealing in UHV at 1100−1250 K. The sample was oxidized in 3×10⁻⁸mbar of O2 at 1000 K afterward, followed by annealing in UHV at 1100−1250 K for 5 min. h-BN monolayers were prepared at 1000−1050 K via thermal decomposition of >99.8% purity borazine, a product of Katchem Ltd. Adsorption of azobenzene was performed from the background (1 × 10⁻⁷ mbar) controlled via a leak valve attached to the UHV chambers.
The glass bulb containing azobenzene could be pumped separately before/during adsorption.
To obtain a deep theoretical insight into the adsorption properties of azobenzene on the h-BN/Rh(111) surface, DFT calculations are performed employing the Vienna Ab initio simulation package (VASP)53,54with the projector augmented wave (PAW) method55 for the electron−ion interaction and with the optB86b-vdW functional56,57 for dispersion correc- tion. Our supercell slab model consists of three Rh atomic layers surfaced in the (111) crystallographic orientation with 12 × 12 Rh atoms in each layer, followed by the h-BN overlayer in a 13 × 13 superstructure, corresponding to the lattice mismatch31of h-BN and Rh(111) (the experimental in- plane lattice constant of Rh is 2.689 Å). Altogether, 770 (3× 144(Rh) + 2×169(B + N)) atoms reside in the supercell,33 which serves as the substrate for the adsorption of azobenzene molecules. Including the molecules, a minimum-15-Å-thick vacuum layer is added to the supercell in the perpendicular (111) direction to avoid unphysical interactions and to properly describe the vacuum tail of the electron wave functions for STM simulations.
The energetically preferred adsorption geometry of a single azobenzene molecule is determined from a total energy
comparison of a set of 50 configurations after geometry optimizations without and with dipole correction,58where the reported total energy differences correspond to the whole supercell. The initial configurations correspond to trans- or cis- azobenzene, where their N or N-nearest C atoms are above six surface adsorption sites (pore-N, pore-B, wall-N, wall-B, wire- N, wire-B), all of these in two different orientations: rotated by 90°with respect to each other. These combinations result in 48 configurations. Additionally, two more configurations are considered, where the NN double bond of a trans- or a cis- azobenzene is above a B−N bond in the pore region of h-BN/
Rh(111). After the energetically most favored adsorption geometry of a single azobenzene molecule is found, adsorption of a second molecule is considered in eight selected positions to obtain information about molecule−molecule interactions and possible molecular growth modes. During geometry optimizations, the Γ point samples the Brillouin zone, the bottom Rh layer isfixed, and all other atoms are freely relaxed until the residual force acting on all individual atoms becomes smaller than 0.02 eV/Å. A 3 × 3 × 1 k-point sampling is applied when calculating the adsorption energies, Bader charges,59−61charge transfer, molecule−molecule interactions, and STM images. The reported STM images are calculated with an s-type tip (Tersoff−Hamann approximation) using the revised Chen method62implemented in the BSKAN code.63,64
3. RESULTS AND DISCUSSION
3.1. Experimental Studies. 3.1.1. Temperature-Pro- grammed Desorption of Azobenzene from h-BN/Rh(111).
It is known from the literature that the multilayer of azobenzene desorbs at ∼240 K.44 In this work, TPD measurements were conducted in the monolayer regime to understand whether the heterogeneity of the surface is reflected also in the desorption spectra. The masses m/e = 51 and m/e = 77 were followed, which gave an intense contribution to the mass spectrum of azobenzene. Based on
the results (Figure 1), the following conclusions can be drawn after exposure of azobenzene at 130 K.
(i) At small exposures, the desorption maximum is at about 430−450 K, which stepwise shifts down to 380 K up to
∼7 L exposures. These states correspond very likely to the adsorption in the energetically most stable pore adsorption sites. We will discuss the energetically favorable adsorption geometries later in the DFT Section in Section 3.2. Nevertheless, the variety of adsorption geometries in the pore region and at the borderline of pores and walls explains the relatively significant changes in the peak temperatures in this exposure regime, not to mention the possible effect of lateral molecule−molecule interactions.
(ii) By increasing the exposure of azobenzene, we can distinguish an additional desorption peak (at 315 K) from the monolayer. Furthermore, it shifts down to even lower temperatures (280 K) and increases in intensity with exposure. These features are assigned to the population of energetically less favored adsorption sites in the wall and wire regions at larger exposures. In harmony with this observation, STM results indicate that these sites are typically uncovered at and above 320 K, and even in the pores, there are still free adsorption centers (Figure 6). According to STM images and DFT models, the area of pores is comparable to the area of wire and wall regions. In light of these, it is not surprising that the TPD peak area increased by this extent (18 L) compared to the 380 K peak. Moreover, previous TPD studies of azobenzene adsorption on Au(111) and Ag(111) revealed that the onset of the desorption from the monolayer can substantially shift down to lower temperatures for dense layers, when approaching the saturation of the first layer, due to molecule−molecule interactions.44Therefore, we cannot exclude a contribution of molecules in the pores to the main TPD peak at 280 K observed at 18 L.
(iii) Since in this study we are only concerned with the monolayer adsorption of azobenzene, we do not present multilayer spectra. However, we can observe a sharp small peak at 240 K even at 13 L exposure. This peak does not increase after further exposure (at 18 L), while the 280 K peak develops. One possible explanation for this phenomenon could be that we observe here desorption from the sample holder, but we assume an interpretation, which seems more likely. Namely, that afterfilling the pores with a single layer of azobenzene, at higher exposures, in parallel with stepwise formation of the monolayer in the wire regions, adsorption of azobenzene may occur on top of the first molecular layer in the pores as a minority process, on a “sticks where it hits”basis. This explains why we cannot observe a significantly larger contribution from the multilayer when the exposure increased from 13 L to 18 L.
Integrated TPD areas show a saturation of the monolayer only around 18 L, at which exposure we reach presumably the full monolayer coverage.
TPD results demonstrate well the inhomogeneity of adsorption sites on the h-BN nanomesh, and with increasing exposure, desorption maximums shift toward lower temper- atures. The trend is that the stability decreases on the order of pore−wall−wire regions of the BN monolayer as revealed by Figure 1.TPD spectra atm/e= 77, assigned to azobenzene molecular
desorption, after increasing exposures of azobenzene on h-BN/
Rh(111) at 130 K.
STM and DFT results presented below. Furthermore, the calculated adsorption energy for the trans molecule with the most stable geometry in the pore (−1.49 eV), of course with an opposite sign, is rather close to the desorption activation energy (Ea = 1.17 eV) determined by a simple Redhead analysis of low-exposure TPD curves (Tp= 450 K) assuming a preexponential factor of 1013s−1. Although we are aware of the limitations of Redhead analysis compared to other more reliable methods,65 this approximation can also demonstrate the conformity of our calculated and experimental results.
Schulze and co-workers44 applied the more reliable and accurate “complete analysis” method of TPD analysis for azobenzene adsorption energies on Au(111) single crystals.
Even with that method, they obtained a significant difference between the experimental and calculated binding energy values on the Au(111) sample for azobenzene adsorption (1.00 ± 0.15 vs 1.67 eV). We have discussed our results in detail in the Supporting Information.
3.1.2. High-Resolution Electron Energy Loss Experiments.
The vibrational spectrum of the nanomesh itself (Figure 2
spectruma) consists of two strong peaks at 795 and 1510 cm−1 and of a shoulder at∼1400 cm−1, which can be assigned to the out-of-plane transverse optical phonon mode (TO⊥), the in- plane longitudinal optical phonon mode (LO), and the in- plane transverse optical phonon mode (TO∥), respectively.
The second harmonic of TO⊥may also contribute to the LO peak.66
The adsorption of an azobenzene multilayer at 170 K led to the appearance of new peaks (Figure 2spectrumb), attributed to different vibrational modes of the molecule listed inTable 1.
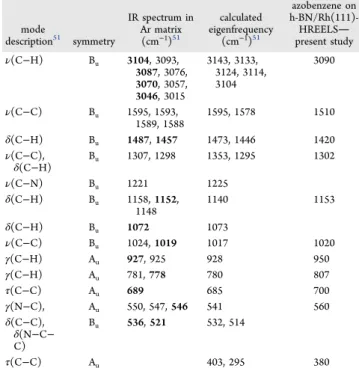
For comparison, IR data (both experimental and calculated) from the literature are also shown. Due to theC2hsymmetry of the molecule, Auand Bumodes are IR active, while Agand Bg modes are Raman active. Among the IR-active modes, Bu vibrations are in-plane, while Aumodes are out-of-plane. The more intense IR peaks are set in boldface. Note that all normal modes above 1000 cm−1 are in-plane, while the majority of vibrations below 1000 cm−1 are out-of-plane. We only observed modes of azobenzene and h-BN on our surface, indicating that the molecule adsorbed intact on the nanomesh.
The adsorption of azobenzene on h-BN/Rh(111) led to the diminution of LO loss of the nitride at 1510 cm−1due to the shadowing effect of the molecules. Since this peak overlaps with theδ(C−H) mode of azobenzene at ∼1480 cm−1, it is difficult to identify the intensity originated from the nitride
alone. Similarly, the most intense bands of the IR spectrum, γ(C−H) at 780 cm−1andτ(C−C) at 690 cm−1, overlap with the TO⊥nitride loss (795 cm−1). In the HREELS spectrum, a slight intensity increase was observed at 807 cm−1 upon azobenzene adsorption (Figure 2), implying that the attenuation of the TO⊥ nitride mode due to the shadowing effect of azobenzene is overcompensated by the appearance of the strong out-of-plane γ(C−H) and τ(C−C) modes. The presence of azobenzene on the surface also led to the broadening of the ∼800 cm−1 peak toward smaller wave- numbers and the appearance of a shoulder at ∼700 cm−1, attributed to theτ(C−C) mode (Figure 2inset).
In the next experiment, azobenzene was dosed at 300−310 K, to avoid the growth of a multilayer. The obtained HREELS spectra are shown inFigure 3. Note that the sticking coefficient Figure 2.HREELS spectrum of (a) h-BN/Rh(111) and (b) h-BN/
Rh(111) after 100 L azobenzene exposure at 170 K. 1 L = 10−6Torr
×s, where 1 Torr = 1.33 mbar.
Table 1. HREELS Losses Observed after Azobenzene Adsorption at 170 K and Their Assignmenta
mode
description51 symmetry
IR spectrum in Ar matrix (cm−1)51
calculated eigenfrequency
(cm−1)51
azobenzene on h-BN/Rh(111)- HREELS
present study
ν(C−H) Bu 3104, 3093,
3087, 3076, 3070, 3057, 3046, 3015
3143, 3133, 3124, 3114, 3104
3090
ν(C−C) Bu 1595, 1593,
1589, 1588
1595, 1578 1510
δ(C−H) Bu 1487,1457 1473, 1446 1420
ν(C−C),
δ(C−H) Bu 1307, 1298 1353, 1295 1302
ν(C−N) Bu 1221 1225
δ(C−H) Bu 1158,1152,
1148
1140 1153
δ(C−H) Bu 1072 1073
ν(C−C) Bu 1024,1019 1017 1020
γ(C−H) Au 927, 925 928 950
γ(C−H) Au 781,778 780 807
τ(C−C) Au 689 685 700
γ(N−C), Au 550, 547,546 541 560
δ(C−C), δ(N−C−
C)
Bu 536,521 532, 514
τ(C−C) Au 403, 295 380
aFor comparison, calculated and experimental IR peak positions of trans-azobenzene are also displayed. The IR peaks observed with strong or medium intensity are listed in boldface.
Figure 3. HREELS spectrum after increasing exposure of h-BN/
Rh(111) to azobenzene at 300 K.
can be smaller in this case due to the higher substrate temperature compared to the TPD measurements presented above. Losses characteristic of azobenzene appeared with stepwise increasing intensity. At the same time, the h-BN phonon modes gradually attenuated due to the shadowing effect of the increasing number of molecules at higher exposures. This phenomenon resulted in a more complex (sometimes nonmonotonous) behavior of the azobenzene losses overlapping with the h-BN peaks. It is interesting to note that theν(C−H) peak at 3070 cm−1(which is one of the most intense peaks with FT-IR spectroscopy) was very weak, indicating that the C−H bonds are approximately parallel to the surface. It suggests that the trans-azobenzene molecule adsorbs (nearly) parallel to the nitride monolayer. Although the in-plane modes between 1000 and 1600 cm−1are visible, the impact scattering mechanism can also contribute to their appearance.
To corroborate the hint for the adsorption geometry, angle- resolved HREELS measurements were also performed. It is known that the dipole scattering mechanism is only opera- tional at incident and detection angles near the specular geometry, while the cross section of the impact scattering mechanism typically changes less abruptly as a function of the detection angles.67Therefore, a steep intensity loss is observed for peaks dominated by the dipole mechanism, when departing from the specular geometry. Note that due to the presence of the metal substrate (“mirror charges”) only normal modes having a dynamic dipole component perpendicular to the surface can be excited by dipole scattering.
First, HREELS spectra of the nanomesh itself obtained at different angles of incidence are shown in Figure 4. A steep
intensity loss is observed for the out-of-plane TO⊥mode (785 cm−1) at the off-specular geometries: its intensity at 50 and 70° was only 30% of the specular intensity. On the other hand, a much milder angular dependence was found for the in-plane LO mode (1510 cm−1): its intensities at 50 and 70°were 50 and 65% of the specular intensity, respectively. This is reasonable considering that the h-BN“plane”is nearly parallel to the Rh(111) surface. The undulating character of the nanomesh may result in some dipole activity of the in-plane
modes of h-BN as well, but the corrugation of the nanomesh (∼0.2 nm) is relatively small compared to the periodicity of the superstructure (∼3.2 nm).
Next, HREELS spectra were collected at different angles of incidence after exposing h-BN/Rh(111) to 100 L of azobenzene at 300 K (Figure 5). Obviously, the out-of-plane
modes (720, 796, 965 cm−1) suffered a strong intensity loss at the off-specular geometries, while the attenuation of the in- plane peaks (1280, 1510 cm−1) was milder. The C−H stretch peak (3070 cm−1) is particularly meaningful in this sense because h-BN has no contribution to the spectra in this region.
The C−H stretch intensity is almost invariant to the applied measurement geometries, strongly indicating that the C−H bonds are essentially parallel to the surface. The change in the molecular dipole during a C−H stretch (dynamic dipole) is parallel to the C−H bond itself. C−H stretch motions are coupled together in various C−H stretch normal modes, but all are certainly characterized by in-plane dynamic dipoles. In case a phenyl ring were tilted with respect to the surface, at least some of the C−H stretch modes should be dipole-active, which was not observed. Therefore, the presented angle- resolved measurements confirm that the adsorption geometry of azobenzene is predominantly parallel to the h-BN monolayer. If both phenyl rings are parallel to the surface, then it also implies that the molecule is in its trans conformation.
3.1.3. Scanning Tunneling Microscopy Measurements.
Here, we present several characteristic STM images taken on the h-BN/Rh(111) surfaces exposed to azobenzene at 320 K.
The hexagonal nanomesh structure before the gas exposure can exhibit basically two different contrasts: honeycomb and disk shape (Figure 6A, top and bottom half). In the case of the honeycomb structure, the wire regions are bright and the pore regions are dark. This contrast is reversed for the disk-shaped structure where the pore regions are bright. This type of double appearance of the STM images taken on the h-BN monolayer supported by metal single crystals has been described in details over the last few years and associated with the change of d-band-dependent tunneling probability.7,31 It is important to note, however, that the spontaneous relay between the two imaging appearances suggests that this feature is not simply a bias-dependent change, but it is certainly based on the sudden chemical change of the tip termination itself.
Figure 4.HREELS spectra of h-BN/Rh(111) obtained at different electron incidence angles. The specular geometry is at 60°. Spectra are not normalized to the elastic peak intensity.
Figure 5.HREELS spectra obtained at different angles of incidence after the exposure of h-BN/Rh(111) to 100 L of azobenzene at 300 K.
The specular geometry is at 60°. Spectra are not normalized to the elastic peak intensity. The C−H stretch region is shown magnified in the inset.
To detect individual molecules adsorbed at 320 K, the substrate was exposed to 30 L of (C6H5N)2. The constant- current STM images recorded in two different scales are shown inFigure 6B,C. The image (B) of 50×50 nm2exhibits clearly the appearance of nanodots distributed more or less uniformly on the atomic terraces of the Rh(111) surface covered by the h-BN nanomesh without any preference at the step lines.
However, the dots assigned certainly to the individual azobenzene molecules adsorb exclusively in the pore regions as they are even more unambiguously discernible on the image (C) of 20 × 20 nm2. The height of these features is approximately 0.15 nm, and theyfill approximately half of the pore regions with a diameter of 2 nm. A more precise determination of the morphology of the molecules is very difficult due to the high mobility activated also by the tip itself at this temperature (RT). To demonstrate this effect, let us observe two images recorded subsequently after each other in nearly the same lateral positions (Figure 6C,D). On both images of 20×20 nm2, a reference dot is marked by“R” on the right side of the region. Comparing the other dots in the two records, it is clear that the molecules marked“a”appeared as new ones in the image (D) and they were not present in the corresponding “pore”-s in the first record (C). At the same time, the molecules present in the first record disappeared from the pores marked by“d”. From the fact that the number of molecules that appeared and disappeared is nearly the same, it can be concluded that the tunneling tip activates intensively the surface diffusion (jump from a pore site to another pore site) of the adsorbed molecules without activating their desorption. Naturally, an increase of the tunneling current may activate a desorption event, as well. We have found the best parameters for a relatively“calm” imaging: −1 V on the sample with a tunneling current of 20 pA. It is also observable in images (C) and (D) that some dots are brighter and exhibit a more extended shape laterally (in some cases a double-dot structure), which can be caused by a doubled adsorption in a pore site or a doubled imaging of the same individual molecule.
Naturally, concerning the shape of the adsorbed azobenzene molecules, imaging at much lower temperatures would provide a more detailed result.
At a higher exposure of 90 L of azobenzene, two different arrangements of the new features were observed (Figure 6E,F):
(i) the larger scale image of 100×100 nm2exhibits elongated wormlike islands (accumulated 1D molecular stripes) of 1−2 nm width as marked by“w”letters in the image (E); and (ii) individual nanodots as described above fitting to the lateral distribution of the pore regions (F). The former morphology suggests an island formation of the azobenzene molecules due to a short-range attractive interaction between them. A possible role of line defects of the nanomesh in the formation of the wormlike structures cannot be excluded completely.
These islands occupy naturally also the wire regions where the bond is weaker to the nanomesh. At the same time, the latter (ii) morphology clearly refers to the template effect of the pore regions.
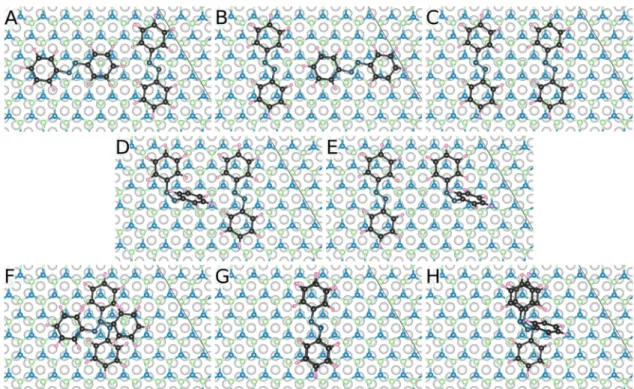
3.2. DFT Calculations. First, the energetically preferred adsorption geometry of a single azobenzene molecule is determined on the h-BN/Rh(111) nanomesh structure (the surface unit cell is shown in the top row ofFigure 7). We are interested in which isomer of the azobenzene (trans or cis) is preferentially bound to the surface and whether there is a preferred surface region (pore, wall, wire; see the top row of Figure 7) for adsorption. After geometry optimizations of the considered 50 adsorption structures (for a description, see Figure 6.STM images recorded at room temperature (A) before and
after different exposures of azobenzene onto the h-BN/Rh(111) surface at 320 K: (B−D) 30 L and (E, F) 90 L. Size of the images: (A, C, D, F) 20×20 nm2, (B) 50×50 nm2, and (E) 100×100 nm2. Parameters found for the best imaging of the surface covered by azobenzene molecules:Ut=−1 V voltage on the sample andIt= 20 pA current.
Figure 7.Energetically favored trans- (A, left) and cis- (B, right, 0.82 eV higher in total energy) azobenzene adsorption configurations after geometry optimizations with dipole correction (top: top view showing the surface unit cell and the different surface regions: pore, wall, wire;
middle: top view zoomed on the molecules; bottom: side view showing the charge transfer upon adsorption). For both isomers, the pore region of h-BN/Rh(111) is preferred (see alsoTable 2). The 3D charge transfers (ρsub+mol−ρsub−ρmol) upon molecular adsorption on the substrate are explicitly shown at the bottom of the figure (isosurface value: 2×10⁻⁴|e|/Å3; blue, electron accumulation; red, electron depletion). Colors for the atoms: gray (Rh), light green (B), light blue (substrate-N), dark blue (molecule-N), black (C), pink (H).
Section 2), the energetically most stable adsorption config- uration was a trans molecule in the pore, shown inFigure 7A.
The total energy ranges of the relaxed configurations in the characteristic surface areas (pore, wall, wire) with respect to this identified overall energy minimum are shown in Table 2.
As can be seen, these relative total energy ranges are quite narrow (≤0.09 eV for pore (0.08 eV for trans and 0.09 eV for cis),≤0.26 eV for wall (0.23 eV for trans and 0.26 eV for cis), and≤0.12 eV for wire (0.12 eV for trans and 0.08 eV for cis)) and they are practically distinct in the different surface regions, with a very small energetic overlap between pore and wall regions. The preferred surface area for the adsorption of both azobenzene isomers is clearly the pore region, followed by the wall region, and the nanomesh wire region is unfavored. These results are in agreement with the concluded heterogeneity of adsorption sites based on Figure 1, and they are in stark contrast to that of ethanol adsorption68 on h-BN/Rh(111), where no such preference for adsorption in the pore region of the nanomesh has been found. Furthermore, it is obtained that the best trans-azobenzene adsorption configuration is 0.82 eV lower in total energy than the best cis-azobenzene. This clearly indicates a preference for trans-azobenzene adsorption on h- BN/Rh(111). Note that the obtained trans−cis-azobenzene total energy difference of 0.82 eV in favor of the trans isomer is very close to that of a similar study on the MoS2surface, where 0.81 eV was found.69For the trans−cis energy difference in the gas phase, the value of 0.51 eV is reproduced,69and the trans isomer is favored due to the NN double bond, which enhances the delocalization of electrons in the π-conjugated flat molecule.
Figure 7shows the most favored trans- (Figure 7A) and cis- azobenzene (Figure 7B) adsorption configurations both located in the pore of the h-BN/Rh(111) nanomesh. Both
aromatic rings of trans-azobenzene are found to be parallel to the surface. This is in agreement with the experimental conclusions in Section 3.1. One aromatic ring of cis- azobenzene is also found to be close to parallel with the surface. All of these results are in agreement with those on MoS2.69For both isomers, a molecular N atom is preferred to be above a surface B atom, with such B−N center-to-center distances of 3.11 and 2.60 Å for the trans- and cis-azobenzene, respectively. These B−N distance values are slightly lower, most likely due to the presence of Rh underneath h-BN, but show the same tendency as found for azobenzene monolayers on a graphene layer, where 3.30 and 2.95 Å were, respectively, reported for trans and cis isomers.70
For our considered substrate, the adsorption energies (Eads= Esub+mol − Esub − Emol) are −1.51 eV (trans) and −1.22 eV (cis) without dipole correction, and these values slightly change to−1.49 eV (trans) and −1.19 eV (cis) with dipole correction taken into account. From chemical intuition, it seems straightforward that on inert surfaces, where vdW interactions dominate, the cis-azobenzene is less bound to the surface by having only one phenyl ring parallel to the substrate and the second phenyl ring isflipped up, in comparison to the trans-azobenzene, where both phenyl rings are parallel to the surface; therefore, this latter isomer binds stronger. This consideration is supported by our calculated detailed energetic data taking the N2 and the phenyl parts of the molecules separately, and the results are reported in Section S1 of the Supporting Information. Thus, the trans-azobenzene binds stronger to the h-BN/Rh(111) substrate than the cis- azobenzene, and the difference between the adsorption energies is 0.29 (0.30) eV without (with) dipole correction.
Interestingly, these values also match very well with the adsorption energy difference of 0.30 eV between trans- and cis- azobenzene adsorbed on MoS2, even though the adsorption energies themselves are smaller in that case:−0.98 eV (trans) and−0.68 eV (cis).69This, together with the very close values of the total energy difference between trans- and cis- azobenzene (0.82 and 0.81 eV), suggests that the h-BN/
Rh(111) and MoS2substrates behave very similarly in terms of energetics concerning the adsorption difference between single trans- and cis-azobenzene. Of course, at larger quantities of azobenzene molecules, substantial differences are expected due to the heterogeneity of the h-BN nanomesh structure and the much different adsorption energy values. On less inert surfaces, like on Cu(100), thecisconformer of an azobenzene derivative is more stable than the trans because of stronger metal−N bonding.71
The adsorbed molecules inFigure 7are characterized by the following element-specific effective Bader charges (Zvalence − QBader) averaged to one atom without (with) dipole correction:
trans-N:−0.50 (−0.49)|e|; trans-C:−0.04 (+0.02)|e|; trans- H: +0.15 (+0.06)|e|; cis-N:−0.46 (−0.44)|e|; cis-C: −0.06 (−0.01) |e|; cis-H: +0.16 (+0.09) |e|. The obtained effective Table 2. Relative Total Energy Ranges for the Considered
Single Azobenzene Molecular Adsorption Configurations on Various Surface Regions of h-BN/Rh(111) with Respect to the Identified Overall Energy Minimum (0 eV)a
relative total energy ranges (eV) trans-azobenzene
pore (9 configurations): 0.00−0.08 wall (8 configurations): 0.04−0.27 wire (8 configurations): 0.33−0.45 cis-azobenzene
pore (9 configurations): 0.82−0.91 (0.00−0.09) wall (8 configurations): 0.88−1.14 (0.06−0.32) wire (8 configurations): 1.17−1.25 (0.35−0.43)
aFor the cis-azobenzene, the relative total energies are also reported (in parenthesis) with respect to the energetically favored cis- azobenzene (in the pore; see Figure 7B), which is 0.82 eV higher in total energy than the overall favored trans-azobenzene in the pore region of the nanomesh (denoted 0 eV; seeFigure 7A).
Table 3. Element-Specific Bader Charge Differences (Qsub+mol−Qsub−Qmol) in|e|Units upon the Adsorption of Trans- and Cis-Azobenzene Molecules (Denoted“mol”) in Their Energetically Preferred Configurations (Shown inFigure 7) in the Pore of the h-BN/Rh(111) Substrate (Denoted″sub″)a
sub-Rh sub-B sub-N mol-N mol-C mol-H mol-N2 mol-phenyl1 mol-phenyl2
trans-azobenzene −0.037 −0.011 −0.054 0.041 0.066 −0.005 0.041 0.029 0.032
cis-azobenzene −0.013 −0.033 −0.054 0.075 0.029 −0.004 0.075 0.021 0.004
aThe corresponding Bader charge differences for another partitioning of the molecules are also shown for N2 and the two phenyl rings separately.
Bader charges on the N atoms of the molecules are larger in absolute value compared to those on MoS2,−0.28 |e|(trans) and−0.24|e|(cis),69and this indicates a stronger bonding to h-BN/Rh(111) as discussed above comparing the adsorption energies. Detailed data on the Bader charges of the constituting atoms of the single azobenzene molecules shown in Figure 7 are reported insection S2of the Supporting Information.
Figure 7also shows the 3D charge transfers upon molecular adsorption (ρsub+mol−ρsub−ρmol). The rearrangement of the electrons to form the bonds between the molecules and the substrate is evident. The charge-transfer mechanism upon molecular adsorption is quantified in terms of calculating the element-specific Bader charge differences (Qsub+mol− Qsub − Qmol), which are reported in Table 3. While the substrate-N atoms donate an equal amount of partial electron charge to the molecule (−0.054|e|) for both trans- and cis-azobenzene, the charge transfer from the substrate-B and Rh atoms is rather different. More charge is transferred from the Rh for the trans (−0.037|e|) than for the cis (−0.013 |e|) and concomitantly less charge is transferred from the B for the trans (−0.011|e|) than for the cis (−0.033|e|). At the molecular side, the charge transfer from H is very small (<|0.005 e|), and all donated charge is received by the molecular N and C atoms, however, in different proportions. While 38% (0.041/(0.041 + 0.066)) of the received charge transfer is obtained by the molecular N atoms and 62% by the molecular C atoms for the trans, these values are 72% (0.075/(0.075 + 0.029)) by N and 28% by C for the cis. This difference, together with the enhanced charge transfer from the substrate-B atoms, indicates a dominating (substrate-B)−(molecule-N) bonding character for the cis- azobenzene, which correlates well with the reduced (substrate- B)−(molecule-N) center-to-center distance of 2.60 Å in comparison to that of the trans-azobenzene, 3.11 Å.Table 3
also reports corresponding Bader charge differences for taking another partitioning of the molecule: N2and two phenyl rings.
While N2 has considerably less charge transfer for the trans (0.041|e|) than for the cis (0.075|e|), the phenyl rings have much more: trans, 0.029 and 0.032 |e| (both parallel to the surface) and cis, 0.021|e|(almost parallel to the surface) and 0.004 |e| (flipped). This difference, together with the proportionally more charge transfer to the molecular C atoms and the enhanced charge transfer from the substrate Rh atoms, indicates a dominating substrate−phenyl interaction for the trans-azobenzene. Thesefindings explain the different adsorption energies of the two azobenzene isomers on the h- BN/Rh(111) substrate.
By calculating the adsorption energies of representative single trans-azobenzene molecules in the wall and wire regions as well, we reproduced the experimentally found decreasing stability order of pore−wall−wire: Eads = −1.49 eV (pore),
−1.40 eV (wall),−1.17 eV (wire), which is clear evidence for the template effect of the h-BN nanomesh on Rh(111). For more details, the reader is referred to Section S6 of the Supporting Information.
Motivated by the possibility that a second molecular layer starts to grow before reaching the monolayer and by the presence of narrow molecular islands inFigure 6E, as the next step, in addition to the energetically most favored trans- azobenzene molecule in the pore of h-BN/Rh(111) (Figure 7), the adsorption of a second molecule is considered in eight selected positions to obtain information about possible molecular growth modes and molecule−molecule interactions.
The relaxed geometries are shown in Figure 8, and their relative total energies calculated with and without dipole correction are reported in the figure caption. The config- urations inFigure 8are grouped as follows. The second trans- Figure 8.Energetic preference order of eight considered configurations for the adsorption of two azobenzene molecules in the pore region of h- BN/Rh(111), and their relative total energies with respect to that of the lowest one (trans(rot)−trans) without/with dipole correction: (A) trans(rot)−trans (0/0 meV), (B) trans−trans(rot) (3/4 meV), (C) trans−trans (52/54 meV), (D) cis−trans (788/815 meV), (E) trans−cis (882/
913 meV), (F) trans(rot)-above-trans (953/967 meV), (G) trans-above-trans (1131/1136 meV), and (H) cis-above-trans (1595/1638 meV). The color schemes for the atoms are reported in the caption ofFigure 7.
azobenzene molecule is adsorbed in the nanomesh porebeside thefirst one in different orientations and sequences so that the (substrate-B)−(trans-molecule2-N) bond is assured (top row:
Figure 8A−C); a cis-azobenzene molecule is adsorbed in the nanomesh porebesidethe trans-azobenzene in two sequences so that the (substrate-B)−(cis-molecule-N) bond is assured (middle row:Figure 8D,E); trans- or cis-azobenzene molecules are adsorbedabovea trans-azobenzene in the nanomesh pore (bottom row: Figure 8F−H). We find that this grouping naturally follows the energetic preference order of the adsorption configurations. The energetically preferred struc- tures are two trans-azobenzenes beside each other in the pore of h-BN/Rh(111), and a composition of a rotated molecule by 90° beside the other one is favored by about 50 meV over parallel molecules. The best configuration is denoted ″trans- (rot)−trans″, and the oppositely ordered composition, denoted trans−trans(rot), is practically degenerate in total energy. Note that two trans-azobenzenes along their long directions do notfit to the pore of the nanomesh (Figure 7A).
The adsorption of a cis- and a trans-azobenzene in the pore is energetically much less favored. The obtained total energy differences of 788 (815) and 882 (913) meV without (with) dipole correction between cis−trans compared to trans−trans adsorptions are close to the difference between the single cis- and trans-molecules, 0.82 eV (Table 2). The observed variations are related to molecule−molecule interactions, where the cis−trans sequence is preferred over the trans−cis one (Figure 8D,E). The azobenzene molecular adsorption above a single trans-azobenzene is unfavored, as indicated by the relative total energies of the configurations (respectively, 953 (967) meV, 1131 (1136) meV, and 1595 (1638) meV without (with) dipole correction) shown inFigure 8F−H. This finding is in line with the experimentally derived conclusion on the stability of only the first molecular layer at room temperature, which is based onFigure 1.
The energetically preferred trans(rot)−trans configuration shown inFigure 8A is described further. The (substrate-B)− (molecule-N) center-to-center distances are 3.12 and 3.29 Å for thefirst trans- (on the right side ofFigure 8A, denoted“T”) and the second (rotated) (on the left side of Figure 8A, denoted “TR”) trans-azobenzene molecule, respectively. The adsorption energy of the coupled molecules isEsub+T+TR−Esub
−ET+TR=−3.05 (−3.04) eV without (with) dipole correction (here, sub denotes the h-BN/Rh(111) substrate). This is roughly double that for the single trans-azobenzene in the pore, Esub+trans − Esub − Etrans = −1.51 (−1.49) eV, and the small difference indicates the presence of an interaction between the molecules. The latter is quantified, andEsub+T+TR
−Esub+T−Esub+TR+Esub=−0.08 (−0.10) eV is found, and the negative sign means an attractive molecule−molecule inter- action. Note that these values correspond to about 5−7% of the adsorption energy of a single trans-azobenzene in the pore.
More details and discussion on the hierarchy of interaction energies of the trans(rot)−trans configuration shown inFigure 8A are reported inSection S3of the Supporting Information.
The molecules (trans on the right side of Figure 8A, and trans(rot) on the left side ofFigure 8A) are characterized by the following element-specific effective Bader charges (Zvalence
− QBader) averaged to one atom without (with) dipole correction: trans-N: −0.53 (−0.46) |e|; trans-C: −0.03 (+0.01) |e|; trans-H: +0.13 (+0.07) |e|; trans(rot)-N: −0.47 (−0.46)|e|; trans(rot)-C: −0.05 (0.00) |e|; and trans(rot)-H:
+0.15 (+0.08)|e|. These values are apparently very similar to
those obtained for single azobenzene adsorption on h-BN/
Rh(111). Detailed data on the Bader charges of the constituting atoms of the two azobenzene molecules shown in Figure 8A are reported in Section S4 of the Supporting Information.
Given the energetically favored character of the trans(rot)− trans configuration shown in Figure 8A of two azobenzene molecules on the h-BN/Rh(111) substrate among the eight considered configurations reported in Figure 8, and the identified presence of an attractive molecule−molecule interaction, the formation of molecular chains shown inFigure 6E is possible at favorable conditions.
In the following, we investigate whether the molecule− molecule interaction can be increased further and how the adsorption and interaction energetics of two trans-azobenzene molecules above each other are related to those of a single trans-azobenzene by the template effect of the h-BN nanomesh on Rh(111). For this reason, we consider the trans(rot)-above- trans (shown inFigure 8F) and the trans-above-trans (shown in Figure 8G) configurations. We find that the molecule− molecule interactions are much larger for both of these configurations than for the energetically preferred trans(rot)− trans with−0.08 (−0.10) eV:Esub+T+TR − Esub+T− Esub+TR+ Esub = −0.49 (−0.47) eV for the trans(rot)-above-trans and Esub+T1+T2−Esub+T1 −Esub+T2+ Esub= −0.38 (−0.39) eV for the trans-above-trans without (with) dipole correction. Again, the negative sign means an attractive molecule−molecule interaction, and the obtained values correspond to about 25%
(trans-above-trans) and to about 32% (trans(rot)-above-trans) of the adsorption energy of a single trans-azobenzene in the pore. This ratio increases to about 33% (trans-above-trans) and to about 40% (trans(rot)-above-trans) in comparison to the adsorption energy of a single trans-azobenzene on the wire (−1.17 eV with dipole correction). This important finding indicates that molecule−molecule interactions are expected to play a crucial role in molecular growth at larger molecular exposures in direct competition with template-driven growth.
Furthermore, we note that the absolute value of the calculated adsorption energy of the second molecule (−0.65 eV) in the trans(rot)-above-trans configuration (Figure 8F) is in excellent agreement with the derived desorption activation energy of 0.62 eV related to the 240 K peak of the TPD data (Redhead approximation), which most likely corresponds to the onset of the growth of the second molecular layer in the pore. More details and discussion on the hierarchy of interaction energies of the trans(rot)-above-trans configuration shown inFigure 8F are reported inSection S3of the Supporting Information.
The molecules in the trans(rot)-above-trans configuration (trans and trans(rot): the molecule below and above, respectively, inFigure 8F) are characterized by the following element-specific effective Bader charges (Zvalence − QBader) averaged to one atom without (with) dipole correction: trans- N: −0.51 (−0.48) |e|; trans-C: −0.04 (+0.02) |e|; trans-H:
+0.14 (+0.07)|e|; trans(rot)-N:−0.48 (−0.45)|e|; trans(rot)- C: −0.05 (+0.01) |e|; and trans(rot)-H: +0.16 (+0.08) |e|. These values are, again, very similar to those obtained for single azobenzene adsorption on h-BN/Rh(111) and also to those of the trans(rot)−trans configuration. Detailed data on the Bader charges of the constituting atoms of the two azobenzene molecules shown in Figure 8F are reported in Section S4of the Supporting Information. The illustration of the 3D charge density rearrangements corresponding to the
molecule−molecule interaction,ρsub+T+TR−ρsub+T−ρsub+TR+ ρsub, is shown inFigure 9.
Finally, related to STM experiments, we note that the main goal ofFigure 6is to prove the existence of the molecules in the pore regions of the h-BN/Rh(111) substrate. Going beyond that, and providing high-resolution simulated STM images, additional insight into the molecular orbital characters of the adsorbed molecules on the substrate is reported, which might serve as a useful reference for future high-resolution STM studies of azobenzene/h-BN/Rh(111) systems at low temperatures. Therefore, STM images are simulated for the energetically favored single cis- and trans- as well as the trans(rot)−trans-azobenzene adsorption configurations at opposite bias voltage polarities. The results for ±1.5 V bias voltages are shown inFigure 10. As can be seen, the presence
of the molecules can be well recognized in the pore of the h- BN/Rh(111) nanomesh (particularly at positive bias voltage), just as in the experimental images inFigure 6. Furthermore, high-resolution imaging, as shown inFigure 10, provides the possibility of identifying the types and number of azobenzene molecules. Changing the bias polarity results in distinctly different molecular orbital characteristics for the (flat) trans-
azobenzenes, while the cis-azobenzene does not show any substantial differences in the STM contrast. Additionally simulated bias-voltage-dependent STM images for the single trans-azobenzene molecule are reported inSection S5of the Supporting Information.
4. CONCLUSIONS
The energetic and geometry aspects of the adsorption of azobenzene on h-BN/Rh(111) were addressed. TPD measure- ments disclosed that azobenzene desorption is characterized by two peaks in the submonolayer regime, tentatively assigned to molecules bound to the wire and pore regions. According to HREELS measurements, azobenzene adsorbs intact on the nitride surface at room temperature, with the molecular plane parallel to the surface. STM experiments revealed the templating effect of the periodically corrugated nanomesh: a strong preference for adsorption in the pores at ∼320 K;
however, in some cases, one-dimensional molecular stripes were also found, implying attractive molecule−molecule interactions. DFT calculations confirmed the experimental findings and provided more details about the adsorption energetics and bonding. Moreover, the calculations proved that azobenzene molecules keep their trans conformation also in the adsorbed phase. Simulated STM images indicated substantially different contrasts for the cis and trans forms.
Based on our results, we propose the following mechanism for azobenzene molecular growth on the h-BN/Rh(111) substrate. The trans-azobenzene is preferred compared to the cis isomer. At low amounts of the molecule, adsorption in the pore is clearly preferred, followed by wall- and wire-adsorption, showing a template effect. We identified a sizable molecule− molecule interaction for a 90°-rotated second trans-azoben- zene molecule on thefirst one. Therefore, at larger amounts of azobenzene, the growth of the multimolecular structure is determined by the complex interplay between template-driven and molecule−molecule interactions. At certain conditions, the formation of the second molecular layer is expected concomitantly filling the wall and wire regions of the nanomesh. This mechanism could be engineered in the future by fine-tuning relevant growth parameters for arriving at a desired molecular structure. The present results may also serve as a basis for future studies related to the light-induced switching of azobenzene on h-BN, relevant for nanoelectronic applications.
■
ASSOCIATED CONTENT*sı Supporting Information
The Supporting Information is available free of charge at https://pubs.acs.org/doi/10.1021/acs.jpcc.0c01725.
Energetic contributions to the bonding of one and two azobenzene molecules on h-BN/Rh(111) for four configurations; details of Bader charge analysis; simu- lated STM images of the trans-azobenzene at different bias voltages; energetic analysis of TPD data compared with DFT (PDF)
■
AUTHOR INFORMATION Corresponding AuthorsL. Óvári−ELI-ALPS, ELI-HU Non-Profit Ltd., H-6728 Szeged, Hungary; MTA-SZTE Reaction Kinetics and Surface Chemistry Research Group, University of Szeged, H-6720 Szeged, Figure 9.3D charge transfers (A, top view; B, side view) representing
the molecule−molecule interaction (ρsub+T+TR− ρsub+T− ρsub+TR+ ρsub) between two azobenzene molecules on the h-BN/Rh(111) substrate in the trans(rot)-above-trans configuration shown inFigure 8F (isosurface value: 2 ×10⁻⁴ |e|/Å3; blue, electron accumulation;
red, electron depletion). The color schemes for the atoms are reported in the caption ofFigure 7.
Figure 10. Simulated STM images of the energetically favored adsorption configurations of single azobenzene molecules (cis and trans inFigure 7) and of two azobenzene molecules (trans(rot)−trans inFigure 8A) in the pore of the h-BN/Rh(111) substrate at opposite bias polarities (top and bottom). The size of the images is 3.2×2.8 nm2. Note that the bias voltage is applied on the sample as in the experimentally used definition.
Hungary; orcid.org/0000-0001-8991-2708;
Email:ovari@chem.u-szeged.hu
K. Palotás− MTA-SZTE Reaction Kinetics and Surface Chemistry Research Group, University of Szeged, H-6720 Szeged, Hungary; Institute for Solid State Physics and Optics, Wigner Research Center for Physics, H-1525 Budapest, Hungary; orcid.org/0000-0002-1914-2901;
Email:palotas.krisztian@wigner.hu Authors
Á. Szitás −Department of Applied and Environmental Chemistry, University of Szeged, H-6720 Szeged, Hungary R. Gubó−Department of Applied and Environmental
Chemistry, University of Szeged, H-6720 Szeged, Hungary; ELI- ALPS, ELI-HU Non-Profit Ltd., H-6728 Szeged, Hungary T. Pásztor−MTA-SZTE Reaction Kinetics and Surface
Chemistry Research Group, University of Szeged, H-6720 Szeged, Hungary
A. P. Farkas− ELI-ALPS, ELI-HU Non-Profit Ltd., H-6728 Szeged, Hungary; MTA-SZTE Reaction Kinetics and Surface Chemistry Research Group, University of Szeged, H-6720 Szeged, Hungary
T. Ajtai−ELI-ALPS, ELI-HU Non-Profit Ltd., H-6728 Szeged, Hungary; Department of Optics and Quantum Electronics, University of Szeged, H-6720 Szeged, Hungary
A. Berkó−MTA-SZTE Reaction Kinetics and Surface Chemistry Research Group, University of Szeged, H-6720 Szeged, Hungary
Z. Kónya−Department of Applied and Environmental Chemistry and MTA-SZTE Reaction Kinetics and Surface Chemistry Research Group, University of Szeged, H-6720 Szeged, Hungary; orcid.org/0000-0002-9406-8596 Complete contact information is available at:
https://pubs.acs.org/10.1021/acs.jpcc.0c01725
Notes
The authors declare no competingfinancial interest.
■
ACKNOWLEDGMENTSFinancial supports from the National Research Development and Innovation Office of Hungary projects No. K120115 and No. FK124100 are gratefully acknowledged. This research was also supported by the European Union and the State of Hungary, cofinanced by the European Social Fund in the framework of TÁMOP-4.2.4.A/2-11/1-2012-0001 “National Excellence Program”. The ELI-ALPS project (GINOP-2.3.6- 15-2015-00001) was supported by the European Union and cofinanced by the European Regional Development Fund. K.P.
thanks E. Bruyer for useful discussions.
■
(1) Novoselov, K. S.; Geim, A. K.; Morozov, S. V.; Jiang, D.; Zhang,REFERENCES Y.; Dubonos, S. V.; Grigorieva, I. V.; Firsov, A. A. Electric Field Effect in Atomically Thin Carbon Films.Science2004,306, 666−669.(2) Novoselov, K. S.; Geim, A. K.; Morozov, S. V.; Jiang, D.;
Katsnelson, M. I.; Grigorieva, I. V.; Dubonos, S. V.; Firsov, A. A. Two- Dimensional Gas of Massless Dirac Fermions in Graphene.Nature 2005,438, 197−200.
(3) Batzill, M. The Surface Science of Graphene: Metal Interfaces, CVD Synthesis, Nanoribbons, Chemical Modifications, and Defects.
Surf. Sci. Rep.2012,67, 83−115.
(4) Agnoli, S.; Granozzi, G. Second Generation Graphene:
Opportunities and Challenges for Surface Science. Surf. Sci. 2013, 609, 1−5.
(5) Xu, M.; Liang, T.; Shi, M.; Chen, H. Graphene-Like Two- Dimensional Materials.Chem. Rev.2013,113, 3766−3798.
(6) Pakdel, A.; Bando, Y.; Golberg, D. Nano Boron Nitride Flatland.
Chem. Soc. Rev.2014,43, 934−959.
(7) Auwärter, W. Hexagonal Boron Nitride Monolayers on Metal Supports: Versatile Templates for Atoms, Molecules and Nanostruc- tures.Surf. Sci. Rep.2019,74, 1−95.
(8) Lindsay, L.; Broido, D. A. Enhanced Thermal Conductivity and Isotope Effect in Single-Layer Hexagonal Boron Nitride.Phys. Rev. B 2011,84, No. 155421.
(9) Yankowitz, M.; Xue, J.; LeRoy, B. J. Graphene on Hexagonal Boron Nitride.J. Phys.: Condens. Matter2014,26, No. 303201.
(10) Turner, M.; Golovko, V. B.; Vaughan, O. P. H.; Abdulkin, P.;
Berenguer-Murcia, A.; Tikhov, M. S.; Johnson, B. F. G.; Lambert, R.
M. Selective Oxidation with Dioxygen by Gold Nanoparticle Catalysts Derived from 55-Atom Clusters.Nature2008,454, 981−983.
(11) Grant, J. T.; Carrero, C. A.; Goeltl, F.; Venegas, J.; Mueller, P.;
Burt, S. P.; Specht, S. E.; McDermott, W. P.; Chieregato, A.;
Hermans, I. Selective Oxidative Dehydrogenation of Propane to Propene Using Boron Nitride Catalysts. Science 2016, 354, 1570− 1573.
(12) Shi, L.; Wang, D.; Song, W.; Shao, D.; Zhang, W.-P.; Lu, A.-H.
Edge-Hydroxylated Boron Nitride for Oxidative Dehydrogenation of Propane to Propylene.ChemCatChem2017,9, 1720.
(13) Paffett, M. T.; Simonson, R. J.; Papin, P.; Paine, R. T. Borazine Adsorption and Decomposition at Pt(111) and Ru(001) Surfaces.
Surf. Sci.1990,232, 286−296.
(14) Nagashima, A.; Tejima, N.; Gamou, Y.; Kawai, T.; Oshima, C.
Electronic Dispersion Relations of Monolayer Hexagonal Boron Nitride Formed on the Ni(111) Surface.Phys. Rev. B1995,51, 4606−
4613.
(15) Morscher, M.; Corso, M.; Greber, T.; Osterwalder, J.
Formation of Single Layer H-BN on Pd(111).Surf. Sci.2006,600, 3280−3284.
(16) Goriachko, A.; He, Y.; Knapp, M.; Over, H.; Corso, M.;
Brugger, T.; Berner, S.; Osterwalder, J.; Greber, T. Self-Assembly of a Hexagonal Boron Nitride Nanomesh on Ru(0001).Langmuir2007, 23, 2928−2931.
(17) Preobrajenski, A. B.; Nesterov, M. A.; Ng, M. L.; Vinogradov, A. S.; Mårtensson, N. Monolayer H-BN on Lattice-Mismatched Metal Surfaces: On the Formation of the Nanomesh.Chem. Phys. Lett.2007, 446, 119−123.
(18) Ćavar, E.; Westerström, R.; Mikkelsen, A.; Lundgren, E.;
Vinogradov, A. S.; Ng, M. L.; Preobrajenski, A. B.; Zakharov, A. A.;
Mårtensson, N. A Single H-BN Layer on Pt(111).Surf. Sci.2008,602, 1722−1726.
(19) Dong, G.; Fourré, E. B.; Tabak, F. C.; Frenken, J. W. M. How Boron Nitride Forms a Regular Nanomesh on Rh(111).Phys. Rev.
Lett.2010,104, No. 096102.
(20) Orlando, F.; Larciprete, R.; Lacovig, P.; Boscarato, I.; Baraldi, A.; Lizzit, S. Epitaxial Growth of Hexagonal Boron Nitride on Ir(111).
J. Phys. Chem. C2012,116, 157−164.
(21) Späth, F.; Gebhardt, J.; Düll, F.; Bauer, U.; Bachmann, P.;
Gleichweit, C.; Görling, A.; Steinrück, H.-P.; Papp, C. Hydrogenation and Hydrogen Intercalation of Hexagonal Boron Nitride on Ni(1 1 1): Reactivity and Electronic Structure. 2D Mater. 2017, 4, No. 035026.
(22) Schwarz, M.; Riss, A.; Garnica, M.; Ducke, J.; Deimel, P. S.;
Duncan, D. A.; Thakur, P. K.; Lee, T.-L.; Seitsonen, A. P.; Barth, J. V.;
et al. Corrugation in the Weakly Interacting Hexagonal-BN/Cu(111) System: Structure Determination by Combining Noncontact Atomic Force Microscopy and X-Ray Standing Waves.ACS Nano2017,11, 9151−9161.
(23) Corso, M.; Greber, T.; Osterwalder, J. H-BN on Pd(1 1 0): A Tunable System for Self-Assembled Nanostructures?Surf. Sci.2005, 577, L78−L84.
(24) Vinogradov, N. A.; Zakharov, A. A.; Ng, M. L.; Mikkelsen, A.;
Lundgren, E.; Mårtensson, N.; Preobrajenski, A. B. One-Dimensional