CHANGES IN SUBJECTIVE QUALITY OF LIFE AFTER THE ECONOMIC CRISIS IN HUNGARY
ÉVA IVONY1
ABSTRACT This paper is written to describe the changes in the subjective quality of life of the Hungarian population and its different social-demographic groups after the economic and financial crisis of 2008. These changes are analyzed in this study based on pooled cross-sectional data from the European Social Surveys by using a multidimensional quality of life index. Applying the difference-in- differences method, the study compares two periods: before and after the crisis.
The theoretical frame of this research is given by the early welfare theory of Eric Allardt (1973), and its revised version from 1993. Results show that the average subjective quality of life of Hungarians had not changed significantly by 2012.
However, the quality-of-life differences of groups specified by marital status and labor market presence increased after the crisis, but that of other dichotomous groups determined on the bases of subjective health, safety and income adequacy did not. In addition, the benefits of an optimistic subjective perception of quality of life also increased by 2012. These findings are valid despite the fact that the year 2012 can be viewed as the culminated effect of the recovery period, according to several macroeconomic, inequality and subjective indicators. Overall, the study is novel in three ways: first, it examines not simply the effect of the economic crisis of 2008 on subjective quality of life, but also its effect on the difference between social groups; second, the research employs a new multidimensional index for evaluating subjective quality of life; and third, it provides new evidence to support set-point theory.
KEYWORDS: crisis, having-loving-being, subjective quality of life
1 Éva Ivony is a Ph.D. candidate at the Corvinus University of Budapest; e-mail: evaivony@gmail.
com. The author would like to thank Zsolt Spéder and Tamás Keller for their valuable guidance, and Tamás Bartus and Gábor Hajdú for their comments.
INTRODUCTION
The 2008 financial and economic crisis was a shock for European societies. Its adverse effects were manifested primarily in weaker economic performance and higher unemployment rates, mainly among young people, and in growing social polarization, especially in transition countries. In parallel with this, the deterioration in living conditions has created more stress, uncertainty and frustration in the everyday lives of European citizens, first and foremost for vulnerable social groups (European Commission, 2014).
Everyone has been able to perceive the negative effects of the crisis on their own quality of life, including Hungarians. Starting from the “crisis year” (2009), changes in the main macroeconomic, social- and income inequality indexes were unfavorable until 2012, but improvements occurred from 2013 onwards (Szivós-Tóth, 2013, 2015, Medgyesi- Nagy, 2014; Gábos et al., 2016; Medgyesi, 2016). Concerning subjective indicators, while both life satisfaction and personal happiness declined during the crisis – with a short interruption and a period of increase in 2010 –, after the years of recovery a return to pre-crisis levels had not happened by 2012 (Ivony, 2017). The research, this paper is based on, as part of a larger overall research study, was designed to investigate the effects of the economic crisis of 2008 on the subjective quality of life of Hungarians.
We looked for an answer to the following research question: did the subjective quality of life of the population in Hungary (as measured using a multidimensional indicator) decline, on average, during the years of the recession compared to the years before the crisis? Regarding the fact that the crisis affected different social groups in different ways, we also investigated if there were any changes in the differences in the quality of life of individuals belonging to different social categories. Although the overall research effort was aimed at analyzing the effects of the crisis as a negative external event, the scope of the present study is limited and does not touch upon changes in the multidimensional indicators that measure subjective quality of life after 2013. Individual well-being is a multidimensional concept and researching this social phenomenon requires an interdisciplinary approach. We also note that, despite the fact that some psychological literature is cited in relation to affective indicators, the present paper does not not aim to analyze psychological well-being (Ryff, 1989; Ryff-Keyes, 1995), nor the state of mind of the Hungarian population (Kopp, 2008). Furthermore, consideration of the multidimensional measuring instruments which were developed based on the World Health Organization’s statistical classification of mental and behavioral disorders are also omitted from this study (Harrison et al., 2016 based on Huppert-So, 2013). After the introduction, a brief overview of preliminary research is presented, followed by a description of data and methods. Then, empirical results are discussed. Finally, a short summary and suggestions for further research are provided to conclude the paper.
THEORETICAL FRAME AND PRELIMINARY RESEARCH
The theoretical frame of this research is based on the early welfare theory of Eric Allardt (1973, 1976). Accordingly, welfare is essentially defined as the satisfaction of materialistic-, social- and personal growth needs, originally based on Maslow's theory of basic needs, known as the “Having-Loving-Being” model. Later on, the former author defined a simplified concept (Allardt, 1993), in which subjective quality of life is conveyed by indicators of satisfaction about objectively measurable quantitative factors of the main dimensions of welfare. Welfare and well-being are two different concepts, and are appropriately distinguished in the literature. Accordingly, welfare depends on economic development, income conditions, educational level and, of course, on other needs, goods, and public services (Stewart, 1996). Furthermore, the quality of societies is also determined by improvements in quality of life and individual well-being, measured by individual perceptions of life circumstances (Diener et al., 1999; Spéder, 2000; Utasi, 2002); additionally, “quality of life contains more global evaluations of life position and perspectives, and well-being contains more domain-specific perspectives” (Sirgy et al., 2006:401). For our research we constructed a multidimensional subjective quality of life index which consisted of the subjective indicators of the “Having-Loving-Being”
dimensions, as well as the long- and short-term emotional indicators sporadically found in the earlier Allardt model. The multidimensional indicator was developed with respect for the traditions of Allardt’s sociology, and maintains the most important dimensions of welfare (having-loving-being), but also splits the scattered emotional element “feelings of well-being” (Allardt, 1973:8) into two dimensions that represent the emotional side of subjective well-being (Diener, 1984). Diener’s theory was used to confirm this new conception; accordingly, we consider that affective subjective well-being consists of the following elements: global happiness as a long-term affect, short-term positive affects, and a lack of negative temporary emotions.
Set-point theory is often used in research into subjective well-being. It originates from the dynamic equilibrium model, and was developed based on the findings of household panel data analysis for developed countries, but has declined in importance over the past 30 years due to a lack of empirical and theoretical support (Headey-Wearing, 1989, 1991; Headey, 2008, 2010; Headey et al., 2014). In the wake of the economic crisis, this theory once again became the center of research efforts due to the contradictory findings of newer empirical studies (Gylfason et al., 2010; Gudmundsdottir, 2013; Cummins et al., 2014). We will return to this theory again in the summary of our results. According to the definition of the concept, individuals can be characterized by their average evaluation of subjective well-being during their lifetime that is determined by their social, material and cultural background. This average individual value is influenced by external positive or negative events that may happen as the consequence of macro processes (e.g., becoming unemployed), and individual life events (e.g., marriage,
childbirth, divorce, widowhood). As a result of these events, average well-being may deviate in some directions and extent, but over time returns to within the typical “set- point range” of the individual because of adaptation.
When analyzing the impact of the crisis on well-being, many studies have used this theory as a basis for interpretation, as Cummins and co-authors did (2014). According to their research results, the effects of the recession did not manifest in any significant deviation among the Australian population in terms of life satisfaction measured on a 10-point scale (using an analysis of 10 years of household panel data from HILDA surveys, starting from 2001). Differences in level of well-being moved only within the set-point range of the population thanks to their resilience. This approach incorporated external and internal resources such as income, family and friendships, and optimistic attitude, along with other factors such as the increased problem-solving ability of individuals, recovery from hardship, and their adaptation to adverse changes. This outcome may have happened not only because of personal resilience, but also due to market-supporting forms of crisis management, as seen in the cases of non-transitional European countries (Bjørnskov et al., 2014). After analyzing data from the Fraser Institute and the EuroBarometer surveys, Bjørnskov and co-authors explained the differences among countries by referring to the institutional approach to crisis management. While the well-being loss in times of crisis was more effectively minimized and the decline was smaller overall when government policies aimed at strengthening the economy were characterized by liberal or market-supporting decisions, centralized measures were, in contrast, followed by a greater decrease in the population’s well-being after a recovery period in Eastern-European countries such as Hungary. As others (Greve, 2012; Helliwell et al., 2014) have also stated, among European countries – based on data from ESS surveys between 2002 and 2010 – there was a decline in well-being during the years of the crisis. However, a composite indicator of average life satisfaction and happiness showed a greater decrease in transition countries where the change in social trust played a determinant role and GDP per capita a lesser one in shaping well-being. The opposite is true of non-transitional countries with a lower degree of dissatisfaction. Based on ESS data (2002-2014), classification of the pooled sample into groups according to the main elements of socioeconomic-status (income, education and occupation) did not reveal any significant associations with life satisfaction for one, two, or three years after the crisis in most categories. There were two exceptions: individuals with the highest educational level, and one occupational subgroup (lower-grade service class), both with negative effects. However, unemployment status in each set indicated a continuously strong, significantly negative association with well-being in all three years (Clench-Aas & Holte, 2017).
Although the above-described preliminary research work, embedded in different theoretical conceptions about well-being during the recession, was rich in explanatory variables, well-being in most cases was measured using only a single-item indicator,
and was additionally tested on subgroups along with the main structural factors.
Notwithstanding the utility of this approach, a single-item indicator is less reliable than a multidimensional one for measuring well-being (Diener & Biswas-Diener, 2000; Lim, 2008). Therefore, the question remains what results a multi-dimensional-indicator-based analysis applied to cross-sectional data in the case of Hungary would deliver, especially if data grouping were analyzed not only according to socioeconomic indicators but also using subjective indicators. Furthermore, most panel or cross-sectional research studies have used multivariate or multivariable analysis to examine the main or long-lasting effects on well-being. In contrast, based on pooled cross-sectional data we compared the post-crisis period to the pre-crisis one using the standard difference-in-differences (DID) method, which has rarely been employed in the literature.
CHANGES IN SUBJECTIVE QUALITY OF LIFE IN HUNGARY – HYPOTHESES
The adverse effects of the crisis in Hungary could be seen up to 2012, and are evident in macroeconomic statistics2 and the quantitative and qualitative findings about subjective well-being (European Commission, 2014; Ivony, 2017). We predict a decline in subjective quality of life in Hungary during the period of recovery which can be explained by four main mechanisms: (I) a period effect, which affected everybody negatively. This theory will be verified or falsified through testing hypothesis number one (H.1); (II) Second, crisis periods are usually followed by a weakening of social integration which may lead to an increase in differences in the subjective quality of life of different social groups.
To examine this explanatory mechanism, family status and presence on the labor market were chosen as the main indicators of social integration. This theory was tested through sub-hypotheses H.2/a-b; (III) Third, vulnerable social groups were harder hit by the crisis than others (classified by income adequacy, subjective health, and safety), showing the growing polarization of these sectors, as tested through sub-hypotheses H.3/a-c and described in the sub-paragraphs below; (IV) Fourth, we also tested the effect of the crisis on personal traits in relation to subjective quality of life based on empirical research findings about optimism (Wrosch-Scheier, 2003, Cummins-Wooden, 2014; Cummins et al., 2014). This theory is tested through hypothesis number four (H.4). (V) Moreover, we suppose that the spread of anomie accelerated, and that feelings of alienation also increased among Hungarian citizens during the recovery period. We hypothesize that this growing anomie and alienation played an important role in determining subjective quality of life. The expected negative association between these factors is tested through hypothesis five (H.5). The latter two assumptions are not considered explanatory 2 Source: www.ksh.hu; Szivós-Tóth, 2013.
mechanisms but we suppose they played important roles in shaping the subjective quality of life of Hungarians in the examined period.
Finally, it is plausible that the anticipated subjective quality of life decline by 2012 was due to changes in the proportions of social categories caused by macro processes compared to 2006. For example, the unemployment rate had increased by 2012. The effect of crisis-related unemployment on reducing well-being has already been proven in the literature many times, including in the case of Hungary (Helliwell et al., 2014;
Bjornskov, 2014; Siposne, 2016; Clench-Aas & Holte, 2017). For this reason we do not examine the unemployed as a separate group here. Obviously, there are other potential explanations as well, such as the increasing uncertainty of the population, a factor which deserves further investigation beyond the scope of this paper.
Our hypotheses about the general subjective quality of life of the population based on the above-presented literature are thus as follows: after the economic crisis, the average subjective quality of life of the Hungarian population decreased (H.1). According to the literature, married people are in better physical shape compared to singles, and their life expectancy is longer. Additionally, marriage creates many advantages for both parties: married people always report higher subjective well-being compared to those who have never been married. The reason for this is that marriage not only provides a more reliable income and conditions of existence, but it also yields psychological benefits (Frey-Stutzer, 2003; Lucas et al., 2003; Graham et al., 2010; Hank-Wagner, 2013). The crisis brought more stress and frustration into peoples’ daily lives (European Commission, 2014); consequently, we also assume that the differences in the quality of life between married and unmarried groups increased (H.2/a). Earlier analyses proved that being unemployed one or more times, for shorter or longer periods, independently of these parameters, has a negative effect on happiness (Oswald, 2003; Lucas et al., 2004; Headey et al., 2014). As we have already mentioned, the negative association of unemployment with subjective well-being has been described in the literature with regard to the economic crisis of 2008, also in the case of Hungary (Greve, 2012; Bjørnskow, 2014; Clench-Aas & Holte, 2017). In our research we also investigate the changes in the average quality-of-life differences of workers between the pre- and post-crisis periods compared to non-workers. We assume divergence and distancing between working and non-working groups according our hypothesis, as follows: post-crisis differences in the quality of life of those who worked during this period and those who did not work increased (H.2/b).
Many empirical research studies have stated that those who feel safe in their neighborhood and those who evaluate their general health as better are not only happier, but are more satisfied with their lives and also with their quality of life (Spéder-Kapitány, 2002; Lengyel-Janky, 2003; Graham et al., 2010). Regarding the subjective evaluation of income, this became one of the most important components of well-being among all those listed in terms of determining life circumstances after the crisis (Siposné, 2016).
Getting by with present income was also used as one of the major output indicators in explaining well-being (Hank-Wagner, 2013). Additionally, according to the Easterlin paradox, improvements in income situation do not result in an equivalent rise in satisfaction (Easterlin, 1974, 2001; Lengyel-Janky, 2003; Lelkes, 2003; Keller, 2008).
This is the reason why we used income adequacy instead of solely income for creating dichotomous groups. Additionally, during the recession the polarization of society and material deprivation increased in Hungary (Szivós-Tóth, 2013; Gábos et al., 2016). We assume, based on the aforementioned literature, that the well-being of vulnerable social groups declined, and that of dichotomous groups further diverged. We predict that the difference in subjective quality of life increased between those who were getting by on their present income and those who were not (H.3/a), as did the difference between those who subjectively felt themselves to be in good health, and those who did not (H.3/b), and also between those who felt safe and those who did not (H.3/c).
According to the literature, individual behaviors are primarily characterized by personal traits as regards subjective quality of life; this correlation is determined (among many other factors) by a person’s ability to reevaluate goals and also to be optimistic.
Those who have an optimistic attitude compared to pessimists are more active, initiate more, and are better able to let go of unattainable goals and set new ones. This explains why optimists were less frustrated, achieved a better quality of life, and reported higher individual levels of well-being (Wrosch-Scheier, 2003; Graham et al., 2010; Cummins- Wooden, 2014; Cummins et al., 2014). These facts, together with other empirical findings (European Commission, 2014), suggest an increase in pessimistic attitudes among the population during this period; consequently, we hypothesize that the differences in subjective quality of life between pessimists and optimists grew (H.4). Crisis periods are usually followed by a weakening of moral values and norms and an increase in individual anomie and alienation (Andorka, 1996; Andorka-Spéder, 1996; Spéder et al., 1998; Elekes-Paksi, 2000; Hegedűs, 2000). However, in the case of individual anomie and alienation we did not create a dichotomous variable but rather measured the attitude using a summative scale (described in the data and method section) following the earlier work of Andorka (1996) about anomie and alienation. Based on the cited empirical research studies, we predict that the spread of anomie accelerated and that feelings of alienation increased in the population. Consequently, we expected to find a strong negative association between subjective quality of life and anomie and alienation (H.5).
DATA AND METHODS
The cross-sectional data used in the study come from the European Social Survey (ESS). For our empirical analysis we used data from the rotation modules about “Personal
and social well-being” from the third and sixth waves. Data collection was conducted by the Hungarian Gallup Institute between November 21, 2006 and January 28, 2007 (N=1518), and by the Social Research Institute (TARKI) between November 11, 2012 and February 17, 2013 (N=2014). The hypotheses of the research were tested by using the standard method of difference-in-differences on pooled cross-sectional data (Buckley- Shang, 2003; National Bureau of Economic Research, 2007). The data were weighted according to the ESS documentation guidelines. Analysis with multivariate data was undertaken using the ordinary-least-squares method. In the case of the dichotomous explanatory variables, this helps express deviation, which is the difference between the differences estimated before the crisis (2006=0) compared to the difference estimated after the crisis (2012=1). The following regression equation was used for subjective quality of life:
Ŷ= ß0+ß1*Year + ß2*X1+ ß3*(Year*X1) + e;
where ß1= effects of the year 2012 (“after”); ß2=quality of life of married people compared to unmarried people (“treated group”), ß3= effect of years of crisis on married people’s quality of life (“after” * ”treated group”).
The difference-in-differences estimation is the interaction member’s unstandardized beta value (B3) expressed as follows: B3= (ȳmarried2012- ȳmarried2006) – (ȳunmarried2012- ȳunmarried2006). Based on the literature cited above, in this equation the Y is the output variable and its Ŷ value is estimated with the explanatory variables in this model. On the right “ß0” is the constant in the regression equation (i.e., the mean value of the dependent variable when the explanatory variable equals 0);
“Year” is the time of data collection; “ß1” is the effect of the year (the general effect of the recovery period); “X1” is the estimate of the individual parameter of the explanatory variable; “ß2” is the effect of the explanatory variable; “Year*X1” is the interaction product; “ß3” is the effect of the crisis years on the explanatory variables (in this study the unstandardized beta values are taken into account: B3), and “e” is the residuum. The empirical findings should be treated with caution because of the effects of unmeasurable factors, and especially the impact of the year 2010. We emphasize that the present study was not designed to analyze the direction of causation between variables. Thus, the chosen statistical methods shed light only on correlations, as well as the direction, strength and significance of the co-occurrences of variables.
The composite subjective quality of life indicator as the outcome variable was operationalized through the following questions: (1) “All things considered, how satisfied are you with your life as a whole nowadays?” as a proxy variable of the “having” dimension;
(2) “There are people in my life who really care about me.” (2006); “To what extent do you receive help and support from people you are close to when you need it?” (2012). The two questions are different in form but measure the feeling of being supported, as the indicator of the “loving” dimension. (3) “I generally feel that what I do in my life is valuable and
worthwhile,” as the indicator of the “being” dimension; (4) “Taking all things together, how happy would you say you are?” (5) The questions from the balance scale, which measures emotional balance based on short-term positive and negative feelings, were as follows: “How much of the time during the past week have you enjoyed life? … have you felt depressed? … have you felt calm and peaceful? … have you felt anxious?” Question numbers (1) and (4) were answered on an 11-item scale, where 0 meant “not at all happy/
satisfied” and 10 meant “very happy/satisfied.” In the case of (2)/2006, and (3) a five-point Likert scale was used, ranging from “Agree strongly” to “Disagree strongly.” For question (2)/2012 a seven-value scale was used, ranging from “Not at all” to “Fully agree,” recoded into a five-point scale. For registering short-term affects, four-point scales were used which ranged from “None or almost none of the time” to “All or almost all of the time.”
The explanatory dichotomous variables were operationalized by the following variables: marital status (“married – unmarried”): family status [(1) Legally married/
live in a legally registered civil union; (0) separated, divorced/civil union dissolved, widowed/civil partner died, none of these)], and “working – not working” for presence on labor market: “Which of these descriptions applies to what you have been doing for the last seven days?” [(1) in paid work; (0) in education, unemployed (was actively looking/
did not seek job), permanently sick or disabled, retired, homemaker, other activity].
Health, safety, and income adequacy were specified with the following variables: “How is your health in general?” [(1) very good, good, fair; (0) bad, very bad], “How safe do you – or would you – feel walking alone in this area after dark?” [(1) very safe, safe;
(0) unsafe, very unsafe], “Which of the descriptions on this card comes closest to how you feel about your household’s income nowadays?” [(1) Living comfortably on present income, coping; (0) finding it difficult, very difficult]. Personal traits were also measured on a five-point scale with agreement with the statement “I am always optimistic about my future.” The scale measuring combined individual anomie and alienation consisted of the following four indexes (as a summative scale, with higher scores meaning greater alienation): “Most days I feel a sense of accomplishment from what I do.” (inverse:
lack of meaning), “To what extent do you feel that people in your local area help one another?” (inverse: isolation), “In my daily life I get very little chance to show how capable I am.” (uselessness), “How much of the time during the past week have you felt lonely?” (loneliness). Responses were recorded in the cases of questions 1-3 on five- point scales and in the last case using a four-point Likert scale, as described above. The explanatory variables describing the statistics can be found in the annexes (Tables 1 and 2). Socio-demographic variables (sex, age, type of settlement, level of education, and net monthly household income per person) were used as control variables (see also annexes). Concerning the income control variables in the 2006 sample (N=1518), 189 people refused to answer the question about income, and in 75 cases the answer was “I don’t know” (a total of 265). In 2012 (N=2014), the former category consisted of 483 and the latter 109 (a total of 592); these cases were excluded from the multivariate analysis.
RESULTS: DESCRIPTIVE FINDINGS
Examination of the descriptive statistics in the case of the five major variables of subjective quality of life led to the following conclusions: by 2012, people in paid work were usually satisfied, happy and self-fulfilled, felt supported, and had a positive emotional balance. In the case of married people (living in partnership), we found the same results with one exception: significance disappeared in the case of life satisfaction.
Regarding income adequacy after the crisis, those who get by with their present income were typically happy, self-fulfilled, and had a positive emotional balance. People who subjectively evaluated their health as bad or very bad in 2012 are usually dissatisfied, unhappy, and live with a negative emotional balance. Those who did not feel safe were usually dissatisfied, unhappy, and emotionally unbalanced. Those who scored higher on the scale of anomie and alienation usually had a negative emotional balance. Optimists were typically satisfied, happy, self-fulfilled people, and showed a positive emotional balance.
TESTING THE HYPOTHESES OF THE RESEARCH
To test our hypotheses we created a summative subjective quality-of-life scale with the aforementioned five sub-scales (having, loving, being, happiness, positive-negative balance). On the summative scale of 0 – 36 higher values represented a favorable subjective quality of life (statistics for the scale were as follows: Chr. A.: 2006: 0.768;
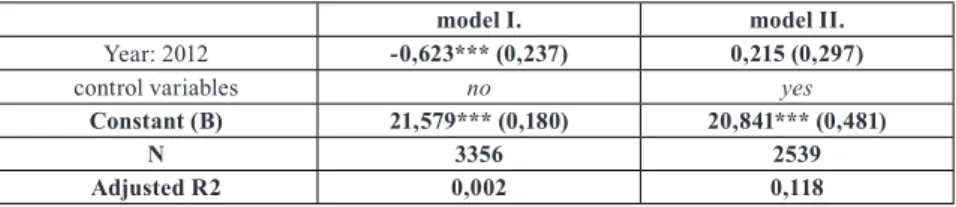
2012: 0.7813, and the pooled mean: 21.22; st. dev.: 6.79 [N=3356]). The regression analyses conducted on the pooled cross-sectional data in Model I (Table 1) show that the hypothesis is supported by the data and indicates that the subjective quality of life of the population had somewhat declined on average by 2012 compared to before the crisis.
The question, however, is whether this claim is supported by social and demographic factors.
3 The QoL scales were developed on the independent samples because of the different wording of the Loving scale.
Table 1. Regression models for subjective life quality, pooled cross-sectional data, OLS (unstandardized beta parameters, levels of significance)
model I. model II.
Year: 2012 -0,623*** (0,237) 0,215 (0,297)
control variables no yes
Constant (B) 21,579*** (0,180) 20,841*** (0,481)
N 3356 2539
Adjusted R2 0,002 0,118
Note: standard errors are in parentheses. Model II. controlled by sex, age, type of settlement, level of education, monthly net household income per person, missing cases: listwise. Significance levels: *p<0.10, **p<0.05,
***p<0.01
Model II shows that when socio-demographic factors are controlled for (age, sex, level of education, level of income, and settlement type), subjective quality of life did not differ significantly when the two periods were compared. This leads us to reject Hypothesis 1; the assumed adverse effects of the crisis – as a period effect – on subjective quality of life were not apparent by 2012. Turning to the changes in subjective quality of life of the dichotomous social groups, we first examined the sub-hypotheses of social integration. Hungarian demographic processes indicate that, starting from the 1980s through to the year 2017, there was a continuous decline in the proportion of marriages and, in parallel with this, the proportion of single people continuously increased. Data show that among the adult population in 2006, 48.7%, and in 2012, 44.1% were married,4 which explains the deviation in distribution between the two samples from these two years. Examination of presence on the labor market shows that the distribution of non- working individuals for these two years was as follows: student: 2006: 7.6%, 2012:
8.5%; unemployed: 4.7%, 8.2%; permanently sick/disabled: 3.9%, 3.4%; retired: 28.4%, 26.4%; homemaker/others: 10.0%, 6.7%, respectively. Along the dichotomous variables, the distribution of workers was almost the same in both samples (2006: 45.4%, 2012:
46.5%).
The results of the analysis in Table 2 show that married people had a favorable subjective quality of life before the crisis and an advantage of 1.020 index points over their unmarried counterparts, while taking into account the general effect of the recovery period (-0.225) the advantage of married people had grown by 1.033 points by 2012.
In the case of presence on the labor market, workers had a -0.163 point disadvantage compared to non-workers in 2006 – while when deducting the general effect of the recovery period (-0.371), the subjective quality of life of workers had increased by 1.332 by 2012. This means that an increase in the quality of life of married individuals compared to unmarried persons had occurred by 2012. Additionally, the situation with the unfavorable quality of life of workers compared to non-workers changed, and had
4 Data can be found at https://www.ksh.hu/docs/hun/xstadat/xstadat_eves/i_wdsd002.html
become much more favorable for the latter by 2012. Consequently, the increase in the distance between the dichotomous social groups in terms of well-being as an effect of the crisis, as outlined in Sub-hypotheses No.2/a-b, is proven.
Furthermore, before the crisis subjective quality of life was on average higher among those who were getting by with their present income (4.196 index-points) compared to those for whom this was difficult or very difficult. In 2006, the population in good health scored on average 4.701 index-points more than those who felt that their overall subjective health was bad or very bad. Regarding the role of safety, we found that before the crisis those who felt safe in their neighborhood evaluated their well-being as higher (on average, by 2.733 points) compared to those who reported to not feeling safe.
However, in these models the differences between the mean values of the groups (B3) did not show any significant deviation. For this reason, the polarization of the dichotomous vulnerable social groups as an adverse effect of the crisis, as outlined in Sub-hypotheses No.3.a-c, was not confirmed.
Table 2. Regression models of groups of hypotheses concerning subjective life quality, pooled cross-sectional data, OLS (unstandardized beta parameters, significance levels)
(2.a.) (2.b.) (3.a.) (3.b.) (3.c.)
social integration vulnerable social groups 2.a. Married 1,020**
(0,402)
2.b. Working -0,163
(0,432) 3.a. Getting by with
present income 4,196***
(0,378) 3.b. Good subjective
general health 4,701***
(0,503)
3.c. Feeling of safety 2,733***
(0,448) Year: 2012 -0,225
(0,409) -0,371
(0,368) 0,116
(0,357) -0,812
(0,633) 0,983*
(0,527) Interaction tag 1,033**
(0,527) 1,332**
(0,514) 0,074
(0,490) 0,925
(0,684) -0,883 (0,583) Constants 20,555***
(0,504) 21,040***
(0,493) 20,333***
(0,476) 16,906***
(0,609) 18,820***
(0,583)
N 2522 2503 2536 2536 2513
Adjusted R2 0,129 0,122 0,198 0,181 0,138
Note: standard errors are in parentheses. Reference categories: (2.a.) unmarried, (2.b.) not working, (3.a.) not getting by with present income, (3.b.) poor subjective health, (3.c.) lacking safety, Year: 2006. Models were controlled for: sex, age, type of settlement, level of education, monthly net household income per person.
Missing cases: list wise. Significance levels: *p<0.10, **p<0.05, ***p<0.01
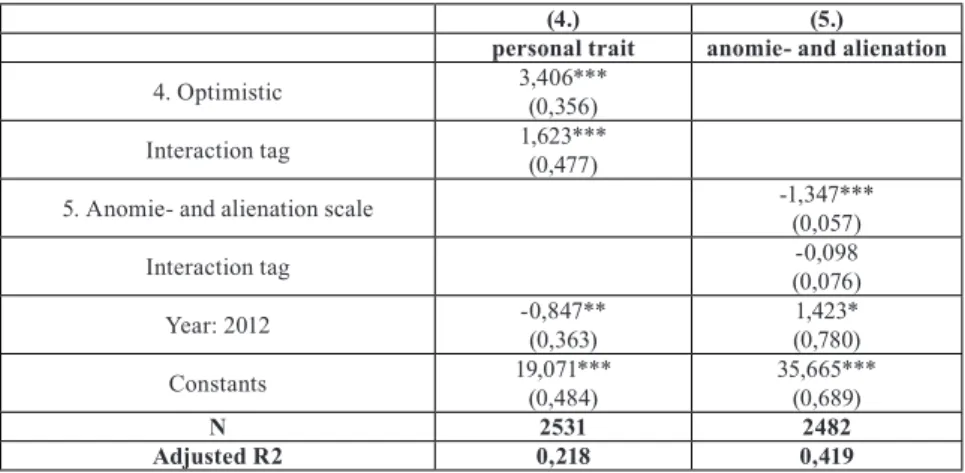
When it comes to personal traits, the outcome was different, as all three of the variables remained significant (Table 3). The optimistic population scored on average 3.406 points more on the subjective quality of life index compared to pessimists before the crisis. Based on the regression equation – and taking into account the general effect of the recovery period (-0.847 points) – the benefits of being optimistic grew by 1.623 index-points for the year 2012. The data presented here thus support Hypothesis No. 4.
Finally, the data verified our expectations and our tests proved the general negative association between quality of life and individual anomie and alienation (Table 3), without the significant impact of the year 2012. Consequently, Hypothesis No. 5 was confirmed.
Although we did not aim to compare the explanatory power of the models, the results of the regression estimations on the hypotheses’ groups proved that objective factors (marital status, presence on labor market) played a weaker role. Subjective indicators related to determining subjective quality of life decreased the explained variance, as we expected based on the literature (Michalos-Zumbo, 2002; Spéder- Kapitány, 2002; Gudmundsdottir, 2013). In the next step, we integrated these variables into our integrated model and can now draw conclusions, bearing in mind the above- mentioned facts.
Table 3. Regression models of groups of hypotheses on subjective life quality, pooled cross-sectional data, OLS (unstandardized beta parameters, significance levels)
(4.) (5.)
personal trait anomie- and alienation
4. Optimistic 3,406***
(0,356)
Interaction tag 1,623***
(0,477)
5. Anomie- and alienation scale -1,347***
(0,057)
Interaction tag -0,098
(0,076)
Year: 2012 -0,847**
(0,363) 1,423*
(0,780)
Constants 19,071***
(0,484) 35,665***
(0,689)
N 2531 2482
Adjusted R2 0,218 0,419
Note: standard errors are in parentheses. Reference categories: (4) pessimistic, Year: 2006. Models were controlled for: sex, age, type of settlement, level of education, monthly net household income per person.
Missing cases: list wise. Significance levels: *p<0.10, **p<0.05, ***p<0.01
INTEGRATED MODELS
The subjective quality of life of the population was determined using all the variables involved in the models above. To examine the individual role of each explanatory variable, we had to take into consideration all of the variables using one integrated model (Table 4).
Table 4. Integrated regression models for subjective life quality, pooled cross-section- al data, OLS (unstandardized beta parameters, significance levels)
model I. model II.
Year: 2012 0,474 (1,033) 0,615 (1,173)
Married 0,270 (0,270) 0,640** (0,314)
Inter -0,250 (0,354) 0,007 (0,412)
Working -0,476* (0,270) -0,633* (0,338)
Inter 0,353 (0,360) 0,711* (0,414)
Getting by with present income 2,794*** (0,279) 2,367*** (0,319)
Inter 0,029 (0,369) -0,080 (0,420)
Good subjective general health 2,635*** (0,392) 2,316*** (0,429)
Inter 0,035 (0,534) -0,089 (0,597)
Feeling safe 0,877*** (0,320) 1,045*** (0,360)
Inter -0,559 (0,410) -0,646 (0,469)
Optimistic 1,939*** (0,270) 1,625*** (0,301)
Inter 0,781** (0,364) 0,977** (0,414)
Anomie- and alienation Scale -1,160*** (0,053) -1,109*** (0,058)
Inter -0,046 (0,069) -0,057 (0,079)
Control variables no yes
Constants 27,002*** (0,783) 27,541*** (0,920)
N 3133 2404
Adjusted R2 0,510 0,496
Note: standard errors are in parentheses. Reference categories: 2006, not married, not working, not getting by with present income, poor subjective health, lacking safety, pessimistic. Control variables are the same as we used in Table 3. Missing cases: listwise. Significance levels: *p<0.10, **p<0.05, ***p<0.01
The main findings show that all explanatory variables were significantly associated with multidimensional subjective quality of life in the integrated models, thus no different results were generated other than those we have already discussed, except of the family status and the presence on the labor market. The well-being benefits of married people declined (0.007 points) for 2012, even though their advantage was 0.640 index points before the crisis. Workers had a -0.633 point disadvantage in terms of subjective quality of life in 2006, while a 0.711 point improvement was detected in 2012. But here the disadvantages and benefits were equalized (-0.633 + 0.711) so the subjective quality of life of the two groups was similar in 2012 (Table 4).
SUMMARY
This paper aimed to investigate the changes in the subjective quality of life of the Hungarian population and also of different social-demographic groups after the recession.
We analyzed pooled cross-sectional data by using the difference-in-differences method.
Taking into account set-point theory and the adaptation of the population that prevailed during this period, the results may not be surprising. However, before summarizing our findings, we should recall the adverse socioeconomic processes that characterized the period before the crisis (rising unemployment, growing indebtedness of the population, reduction of savings, and decreasing social transfers) and in addition, the decline in subjective well-being that was apparent from 2004 onwards. This might help to explain our results. On the one hand, after a period of recovery (2012) there was no significant difference in the subjective quality of life of individuals compared to the declining trends of 2006. Consequently, we could not prove the existence of our first main explanatory mechanism, the period effect. However, our findings provided empirical support for set- point theory, reaffirming the fact that people’s well-being returns to within its typical range after a short deviation as a result of adaptation. On the other hand, we identified that married people and those who were active on the labor market enjoyed a higher quality of life in 2012. First, this means that the existence of marriage and being active on the labor market provided adequate support for overcoming the difficulties of the crisis: married individuals and workers were able to achieve a better quality of life during the recovery period than their non-married/non-working counterparts. Second, it also signals further deterioration in the position of vulnerable groups; consequently, the second explanation is retained. Furthermore, individuals’ subjective perceptions according to selected social categories based on the most viable predictors (income adequacy, safety, and health) were not significantly different compared to the pre-crisis period. Therefore, our third posited explanatory mechanism did not prove to be relevant.
Based on the integrated model we claim that, due to combined effects, the earlier differences among social groups have disappeared, apart from in the case of having an optimistic attitude. This result is surprising if we consider the earlier widespread pessimism in Hungarian society, that was detected in many works during in the 1990s.
Overall, the study is novel in three ways: first, it examined not simply the effect of the economic crisis of 2008 on subjective quality of life, but also its effect on the differences between social groups; second, the research developed a new multidimensional index for evaluating subjective quality of life; and third, it provided new evidence for set-point theory. Finally, accounting the effect of the year of 2010 can be a new research goal, to highlighting the real life quality differences among different social groups employing the difference-in-difference-in-differences (DDD) method, and also with selecting a new benchmarking period before the crisis.
LITERATURE
Allardt, Erik (1973), “About Dimensions of Welfare: An Exploratory Analysis of a Comparative Scandinavian Survey. Research Reports, Nr. 1ˮ, Helsinki: University of Helsinki. Source: http://worlddatabaseofhappiness.eur.nl/hap_bib/ freetexts/
allardt_e_1973.pdf (downloaded: 17. 12. 2015.)
Allardt, Erik (1976), “Dimensions of welfare in a Comparative Scandinavian Studyˮ, Acta Sociologica, Vol. 19, No. 3, pp. 227-239.
Allardt, Erik (1993), “Having, Loving, Being: An Alternative to the Swedish Model of Welfare Researchˮ, in: Martha Nussbaum – Amartya Sen, ed., The Quality of Life, Oxford, Clarendon Press, pp. 88-94.
Andorka, Rudolf (1996), Deviáns viselkedések Magyarországon. Általános értelmezési keret az elidegenedés és az anómia fogalmak segítségével, in: Rudolf Andorka, Merre tart a magyar társadalom, Lakitelek, Antológia, pp. 32-78.
Andorka, Rudolf – Spéder, Zsolt (1996), “A szegénység Magyarországon 1992-1995ˮ, Esély, Vol. 7, No. 4, pp. 25-52.
Bjørnskov, Christian (2014), “Do Economic Reforms Alleviate Subjective Well-being Losses of Economic Crisis?ˮ, Journal of Happiness Studies, Vol. 15, No. 1, pp. 163- 182. http://dx.doi.org/10.1007/s10902-013-9442-y
Buckley, Jack – Shang, Yi (2003), “Estimating Policy and Program Effects with Observational Data: The „Differences in Differences” Estimatorˮ, Practical Assessment, Research & Evaluation, Vol. 8, No. 24, pp. 1-8. Source: http://PAREonline.
net/getvn.asp?v=8&n=24
Clench-Aas, Jocelyne – Holte, Arne (2017), “The financial crisis in Europe: Impact on satisfaction with life.”, Scandinavian Journal of Public Health, Vol. 45, No. 18, pp.
30-40. http://dx.doi.org/10.1177/1403494817718692
Cummins, Robert A. – Wooden, Mark (2014), “Personal Resilience in Times of Crisis:
The Implications of SWB Homeostasis and Set-Pointsˮ, Journal of Happiness Studies.
Vol. 15, No. 1, pp. 223-235. http://dx.doi.org/10.1007/s10902-013-9481-4
Cummins, Robert A. – Li, Ning – Wooden, Mark – Stokes, Mark (2014), “A Demonstration of Set-Points for Subjective Wellbeingˮ, Journal of Happiness Studies, Vol. 15, No. 1, pp. 183-206. http://dx.doi.org/10.1007/s10902-013-9444-9
Diener, Ed (1984), “Subjective well-beingˮ, Psychological Bulletin, Vol. 95, No. 3, pp.
542-575. http://dx.doi.org/10.1037/0033-292995.3.542
Diener, Ed – Eunkook M. Suh – Richard E. Lucas – Heidi L. Smith (1999), “Subjective Well-Being: Three Decades of Progress”, Psychological Bulletin, Vol. 125, No. 2, pp.
276-302.
Diener, Ed – Biswas-Diener, Robert (2000), “New Direction in Subjective Well-Being Research: The Cutting Edgeˮ, Indian Journal of Clinical Psychology, Vol. 27, No. 1,
pp. 21-33.
Durkheim, Émile (1982), Az öngyilkosság, Budapest, Közgazdasági és Jogi Könyvkiadó Easterlin, Richard A. (1974), “Does Economic Growth Improve the Human Lot? Some
Empirical Evidenceˮ, in: Paul A. David – Malvin W. Reder, ed., Nations, Households and Economic Growth: Essays in Honor of Mozes Abramowitz, New York, Academic Press, pp. 89-125.
Easterlin, Richard A. (2001), “Income and Happiness: Towards a Unified Theoryˮ, Economic Journal, Vol. 111, No. July, pp. 465-484.
Elekes, Zsuzsanna – Paksi, Borbála (2000), Anómia, lelki problémák, elégedettség – az ezredév végén, in: Spéder Zsolt, szerk., A jólét, elégedettség és társadalmi kohézió Magyarországon, Budapest, BKÁE, pp. 71-84.
European Commission (2014), “Coping with the crisis. Aggregate Report.
Eurobarometer Qualitative Studyˮ, EU: European Commission, Directorate-General for Employment, Social Affairs and Inclusion. Source: http://www.sciencedirect.com/
science/journal/09218009/25/1
Frey, Bruno S. – Stutzer, Alois (2003), “Does Marriage People Happy, Or Do Happy People Get Marriedˮ, Working Paper No. 143, Zurich, University of Zurich, Source:
http//:www.iew.uzh.ch/wp/iewwp080.pdf (downloaded: 08.12. 2015.)
Gábos, András – Tátrai, Annamária – B. Kis, Anna – Szivós, Péter (2016), “Anyagi depriváció Magyarországon, 2009-2015ˮ, in: Kolosi Tamás – Tóth István György, szerk., Társadalmi Riport 2016, Budapest, TÁRKI, pp. 130-150.
Graham, Carol – Chattopadhyay, Soumya – Picon, Mario (2010), “Adapting to Adversity:
Happiness and the 2009 Economic Crisis in the United Statesˮ, Social Research, An International Quarterly, Vol. 77, No. 2, pp. 715-748.
Greve, Bent (2012), “The impact of the financial crisis on happiness in affluent European countriesˮ, Journal of Comparative Social Welfare, Vol. 28, No. 3, pp. 183-193. http://
dx.doi.org/10.1080/17486831.2012.736354
Gudmundsdottir, Dora G. (2013), “The Impact of Economic Crisis on Happinessˮ, Social Indicators Research, Vol. 110, No. 1, pp. 1083-1101. http://dx.doi.org/10.1007/
s11205-011-9973-8.
Gudmundsdottir, Dora G. – Ásgeirsdóttir, Bryndís B. – Huppert, Felicia A. – Sigfúsdóttir, Inga D. –
Valdimarsdóttir, Unnur A. – Hauksdóttir, Arna (2016), “How Does the Economic Crisis Influence Adolescents’ Happiness? Population-Based Surveys in Iceland in 2000- 2010ˮ, Journal of Happiness Studies, Vol. 17, No. 3, pp. 1219-1234. http://dx.doi.
org/10.1007/s10902-015-9639-3.
Gylfason, Thorvaldur – Holmström, Bengt – Korkman, Sixten – Söderström, Hans T.
– Vihriälä, Vesa (2010), “From Boom to Bust: The Iceland Storyˮ, in: Thorvaldur Gylfason – Bengt Holmström – Sixten Korkman – Hans T. Söderström – Vesa Vihriälä, Nordics in Global Crisis. Voulnerability and Resilience, Helsinki: Taloustieto Oy, pp.
137-166., source: https://notendur.hi.is/gylfason/nordics_in_global_crisis.pdf Hank, Karsten – Wagner, Michael (2013), “Parenthood, Marital Status, and Well-being
in Later Life: Evidence from SHAREˮ, Social Indicators Research, Vol. 114, No. 2, pp. 639-653. http://dx.doi.org/10.1007/s11205-012-0166-x
Harrison, Eric – Quick, Annie – Abdallah, Saamah, eds., (2016), Looking through the Wellbeing Kaleidoscope, London: New Economics Foundation, source: https://www.
europeansocialsurvey.org/docs/about/Looking_through_wellbeing_kaleidoscope.pdf Headey, Bruce – Wearing, Alexander (1989), “Personality, Life Events, and Subjective
Well-Being: Toward a Dynamic Equilibrium Modelˮ, Journal of Personality and Social Psychology, Vol. 57, No. 4, pp. 731-739.
Headey, Bruce – Wearing, Alexander (1991), “Subjective well-being: a stocks and flows frameworkˮ, in: Fritz Strack – Michael Argyle – Norbert Schwarz, eds., Subjective Well-being: An Interdisciplinary Perspective. Oxford: Pergamon Press, pp. 49-73.
Headey, Bruce (2008), “Life Goals Matter to Happiness: A Revision of Set-Point Theoryˮ, Social Indicators Research, Vol. 86, No. 2, pp. 213-231. http://dx.doi.
org/10.1007/s11205-007-9138-y.
Headey, Bruce (2010), “The Set-Point Theory of Well Being Has Serious Flaws: On the Eve of a Scientific Revolution?ˮ, Social Indicators Research, Vol. 97, No. 1, pp. 7-21.
http://dx.doi.org/10.1007/s11205-009-9559-x.
Headey, Bruce – Muffels, Ruud – Wagner, Gert G. (2014), “National Panel Studies Show Substantial Minorities Recording Long-Term Change in Life Satisfaction:
Implications for Set-Point Theoryˮ, in:
Kennon M. Sheldon – Richard E. Lucas, eds., Stability of Happiness, Theories and Evidence on Whether Happiness Can Change. USA: Elsevier, pp. 101-126.
Hegedűs, Rita (2000), “Normaszegések elfogadása és érzékelése a köztudatbanˮ, in:
Spéder Zsolt, szerk., A jólét, elégedettség és társadalmi kohézió Magyarországon, Budapest, BKÁE, pp. 85-94.
Helliwell, John F. – Huang, Haifang – Wang, Shun (2014), “Social Capital and Well- Being in Times of Crisisˮ, Journal of Happiness Studies, Vol. 15, No. 1, pp. 145-162.
http://dx.doi.org/10.1007/s10902-013-9441-z
Huppert, Felicia A. – So, Timothy T. C. (2013), “Flourishing Across Europe: Application of a New Conceptual Framework for Defining Well-Beingˮ, Social Indicators Research, Vol. 110, No. 3, pp. 837-861. http://dx.doi.org/10.1007/s11205-011-9966-7.
Ivony, Éva (2017), “Szubjektív életminőség és érzelmi jóllét Magyarországon a gazdasági válság előtt és azt követően, európai kitekintésselˮ, Statisztikai Szemle, Vol. 95, No.
10, pp. 997-1022. http://dx.doi.org/10.20311/stat2017.10. hu0997
Keller, Tamás (2008), “Trendek az életszínvonallal való elégedettséget magyarázó tényezők hatásának időbeli alakulásában 1992 és 1997 közöttˮ, in: Kolosi Tamás – Tóth István György, szerk., Társadalmi Riport 2008, Budapest: TÁRKI, pp. 415-428.
Kopp, Mária, szerk., (2008), Magyar lelkiállapot 2008. Esélyerősítés és életminőség a
mai magyar társadalomban, Budapest: Semmelweis Kiadó
Lelkes, Orsolya (2003), “A pénz boldogít? A jövedelem és hasznosság kapcsolatának empirikus elemzéseˮ, Közgazdasági Szemle, Vol. 50, No. 5, pp. 383-405.
Lengyel, György – Janky, Béla (2003), “A szubjektív jólét társadalmi feltételeiˮ, Esély, Vol. 14, No. 1, pp. 3-25.
Lim, Hock-Eam (2008), ˮThe Use of Different Happiness Rating Scale: Bias and Comparison Problem?ˮ, Social Indicators Research, Vol. 87, No. 2, pp. 259-267. http://
dx.doi.org/10.1007/s11205-007-9171-x
Lucas, Richard E. – Clark, Andrew E. – Georgellis, Yannis – Diener, Ed (2003),
“Reexamining adaptation and the set point model of happiness: Reactions to changes in marital statusˮ, Journal of Personality and Social Psychology, Vol. 84, No. 3, pp.
527-539.
Lucas, Richard E. – Clark, Andrew E. – Georgellis, Yannis – Diener, Ed (2004),
“Unemployment alters the set point for life satisfactionˮ Pschological Science, Vol.
15, No. 1, pp. 8-13.
Medgyesi, Márton – Nagy, Ildikó (2014), “Fiatalok életkörülményei Magyarországon és az EU országaiban 2007 és 2012 között”, in: Kolosi, Tamás – Tóth, István György, szerk., Társadalmi Riport 2014, Budapest, TÁRKI, pp. 303-323.
Medgyesi, Márton (2016), “A háztartások megtakarításai és eladósodottsága Magyarországon, 2008-2015”, in: Kolosi, Tamás – Tóth, István György, szerk., Társadalmi Riport 2016, Budapest, TÁRKI, pp. 173-192.
National Bureau of Economic Research (2007), What’s New in Econometrics?
Difference-in-Differences Estimation, Massachusetts, Cambridge, NBER, Source:
http://www.nber.org/WNE/lect_10_diffindiffs.pdf
Oswald, Andrew J. (2003), “How Much Do External Factors Affect Wellbeing? A Way to Use 'Happiness Economics' to Decideˮ, Psychologist, Vol. 16, No.3, pp. 140-141.
Michalos, Alex C. – Zumbo, Bruno D. (2002), “Healthy days, Health satisfaction and satisfaction with the overall quality of life”, Social Indicators Research, Vol. 59, No.
3, pp. 321-338.
Ryff, Carol D. (1989), “Happiness Is Everything, or Is It? Explorations on the Meaning of Psychological Well-Beingˮ, Journal of Personality and Social Psychology, Vol. 57, No. 6, pp. 1069-1081.
Ryff, Carol D. – Keyes, Corey Lee M. (1995), “The Structure of Psychological Well- Being Revisitedˮ, Journal of Personality and Social Psychology, Vol. 69, No. 4, pp.
719-727.
Siposne Nandori, Eszter (2016), “How Did Subjective-Well-Being Change in Hungary Due to the Economic Crisisˮ, Social Indicators Research, Vol. 126, No. 1, pp. 241-256.
http://dx.doi.org/10.1007/s11205-015-0878-9
Sirgy, M. Joseph – Michalos, Alex C. – Ferriss, Abbott L. – Easterlin, Richard A. –
Patrick, Donald – Pavot, William (2006), “The Quality-of-Life (QOL) Research Movement: Past, Present, and Futureˮ, Social Indicators Research, Vol. 76, No. 3, pp.
343-466. http://dx.doi.org/10.1007/s11205-005-2877-8.
Spéder, Zsolt, szerk., (2000), A jólét, elégedettség és társadalmi kohézió Magyarországon,Budapest, BKÁE
Spéder, Zsolt – Paksi, Borbála – Elekes, Zsuzsanna (1998), “Anómia és elégedettség a 90-es évek elejénˮ, in: Kolosi, Tamás – Tóth, István György – Vukovich, György, szerk., Társadalmi Riport 1998, Budapest, TÁRKI, pp. 490-513.
Spéder, Zsolt – Kapitány, Balázs (2002), “A magyar lakosság elégedettségének meghatározó tényezői nemzetközi összehasonlításbanˮ, in: Kolosi, Tamás – Tóth, István György – Vukovich, György, szerk., Társadalmi Riport 2002, Budapest, TÁRKI, pp. 162-172.
Stewart, Frances (1996), “Basic Needs, Capabilities and Human Development”, in:
Awner Offer (Ed.): In Pursuit of the Quality of Life, Oxford, NY, Oxford University Press, pp. 46-65.
Szivós, Péter – Tóth, István György, szerk., (2013), Egyenlőtlenség és polarizálódás a magyar társadalomban. TÁRKI Monitor Jelentések 2012, Budapest, TÁRKI
Szivós, Péter – Tóth, István György, szerk., (2015), Jól nézünk ki (…?!) Háztartások helyzete a válság után. TÁRKI Monitor Jelentések 2014, Budapest, TÁRKI
Utasi, Ágnes (2002), “A bizalom hálója. Mikrotársadalmi kapcsolatok, szolidaritás.”, Budapest, Új Mandátum.
Wrosch, Carsten – Scheier, Michael F. (2003), “Personality and quality of life: The importance of optimism and goal adjustmentˮ, Quality of Life Research, Vol. 12, No.
1, pp. 59-72.
APPENDIX
A.Table 1. Distribution of dichotomous, control and explanatory variables in the pooled cross-sectional sample (Valid %, N, unweighted data)
Valid % N
Male 43,3 3532
under 30 years 18,6 3517
30-39 16,5 3517
40-49 16,5 3517
50-59 17,1 3517
60-69 15,6 3517
70 years or older 15,8 3517
Big city (+suburbs or outskirts of a big city) 28,1 3528
Town or a small city 36,8 3528
Country village +farm or home in the countryside 35,1 3528
Primary education or less 35,3 3520
Vocational secondary 25,8 3520
Secondary school 23,4 3520
Diploma (or upper) 15,5 3520
Married 54,2 3487
Working 44,0 3476
Getting by with present income 48,2 3490
Good subjective general health 84,3 3530
Feeling safe 73,5 3466
Optimistic 50,0 3510
A.Table 2. Control and explanatory describing statistics in the pooled cross-sectional sample
N Minimum Maximum Mean Std.
Deviation
Male 3532 0,00 1,00 0,4394 0,49638
under 30 years 3525 0,00 1,00 0,2041 0,40309
30-39 3525 0,00 1,00 0,1648 0,37102
40-49 3525 0,00 1,00 0,1785 0,38296
50-59 3525 0,00 1,00 0,1742 0,37931
60-69 3525 0,00 1,00 0,1442 0,35132
70 years or older 3525 0,00 1,00 0,1343 0,34106
Big city (+suburbs or outskirts
of a big city) 3529 0,00 1,00 0,2689 0,44347
Town or a small city 3529 0,00 1,00 0,3652 0,48154
Country village+farm or home
in the countryside 3529 0,00 1,00 0,3659 0,48175
Primary education or less 3523 0,00 1,00 0,3452 0,47550
Vocational secondary 3523 0,00 1,00 0,2618 0,43967
Secondary school 3523 0,00 1,00 0,2410 0,42773
Diploma (or upper) 3523 0,00 1,00 0,1520 0,35912
Married 3492 0,00 1,00 0,5752 0,49438
Working 3479 0,00 1,00 0,4578 0,49829
Getting by with present
income 3494 0,00 1,00 0,4870 0,49990
Good subjective general health 3530 0,00 1,00 0,8533 0,35382
Feeling safe 3473 0,00 1,00 0,7391 0,43920
Optimistic 3510 0,00 1,00 0,5107 0,49996
Anomie- and alienation Scale 3423 4 21 9,5482 2,79118