University of Szeged Faculty of Science and Informatics
Doctoral School of Geosciences
Department of Economic and Social Geography
Spatial analysis of the world city network using air traffic data
Theses of the PhD dissertation
Gábor Dudás
Consultant Dr. Lajos Boros lecturer
Szeged
2013
I. Justification for research topic, literary review
Movements of people and goods, trade and transfer of information have always been fundamental components of human societies. Throughout history, the realization of these processes has been largely dependent on the socio-economic level of development, but especially on the technological level of all the time.
From the second half of the 20th century, however, the development of transportation and information technologies (the so-called time-space shrinking technologies) resulted in comprehensive changes in the economy. Capitalism, based on complex systems and organised at a global scale has been evolved, which process has had great impact on the spatial organisation of the globalised society too (DICKEN, P. 2007, DERUDDER, B. et al. 2008, NAGY E. – PÁL V. 2010, RODRIGUE,J-P.et al. 2006). As part of this process, space and time constraints, which separate certain geographical locations from each other, seem to cease increasingly. As the result of this progress, places seem to get „closer” to each other, and considering accessibility and distance, there is no doubt that our world has been „shrinking” (DICKEN, P. 2011, HAUGER, G. 2001, SHIN, K-H. – TIMBERLAKE,M. 2000,STUTZ,F.P.– WARF,B.2011,TAYLOR,P.J.et al.2002, WARF,B. 2006, ZOOK,M.A.–BRUNN,S.D.2006). This approach, however, can be misleading. Many researchers share the point of view, that the development of information technologies and its rapid expansion from the 1970s on have accelerated information flows at global scale to such an extent, that time defeats space more and more, so its space forming ability decreased almost to zero. As the result of this, the concept of the distance is redefined (MÉSZÁROS R.2008,2010), and gone through significant changes in interpretation (JAKOBI Á. 2007).
According to this, however, a number of researcher points out, that the absolute distance between two points does not change, but the relative distances are decreasing (WARF,B. 2006). This process does not concern all the places of the Earth, and not all places and people are affected equally (BERNEK Á. 2002, 2006, DICKEN,P. 2011, KNOWLES,R.D. 2006, MASSEY,D. 1994, WARF,B. 2006). It should be kept in mind, that the operation of transport and communication systems requires extremely expanded infrastructures. As these facilities are very expensive, they are primarily built up in strategic nodes (world cities) (HAUGER,G. 2001).
These cities, as the real nodes of flow systems, possess all the space modifying technologies that connect different points of space and control the flows of economic resources, individuals, capital, goods and information (CASTELLS,M.
1996).
However, based on the hierarchy of the world cities, they are connected into flow systems in different ways, and contribute to their realization in different ways too. So the positions of the various cities in the world city hierarchy strongly influence the concentration of the technologies that may have impact on global flows and networks and thus the distances and the spatial relationship between certain points of spaces.
Consequently it is important to research the hierarchy and the relationship of the nodes.
Most of the studies agreed, that transport plays an important role in the establishment and operation of networks, however, there was a difference in the extent they considered the transport’s role important in space restructuring. I apply this line of thought in my study and based on this, I examine the space forming role of air transport.
Air transport facilitates integration by having a positive effect on the accessibility (SHORT,J.R. et al.1996) and embeddedness in the global economy of given areas, moreover it renders the flows of people, goods and information possible. This is a prerequisite for the development and change of world cities and world economy (KEELING,D.J.1995), and simultaneously it contributes both to the maintenance of the cities’ position in the hierarchy and to the reproduction of centre-periphery relations.
II. Research objectives
The most important starting point of my research was the assumption that the space forming effect of transportation and info-communication technologies appears in different ways at the various levels of city hierarchy. These effects are stronger and more positive in case of cities situated at the top of world city hierarchy, while descending the hierarchy levels, these effects are becoming more rare and casual. Based on this, the main objective of the paper is to outline and apply such a theoretical and practical framework in empirical studies that can be used in world city network research. Moreover, it would help to understand the spatial configuration of the world, outlines the economic power centres that control the organization of the world economy and contributes to the expansion of the theoretical background of world city network research.
Due to the structure of the thesis, my research goals and questions can be divided into two groups. Based on the problems and justification outlined in the former paragraph, the central question of my dissertation is the following: How will the space-shrinking technologies change the already existing power relations between global cities/macro regions, and how do they reproduce spatial, social inequalities? So in this context, I examine how the cities at the top of the world city hierarchy move in time and space, if we take into consideration alternative distance units instead of geographical distance during the analysis of the spatial patterns between world cities. In this context, further questions have also been raised.
• What kind of spatial patterns and differences can be outlined between the cities situated at the top of world city hierarchy (London, New York, Tokyo) and the semi-peripheral world cities (Johannesburg, Mexico city, Sao Paulo, Sydney)?
• What kind of spatial characteristics does Budapest have in the studied context, and how does it fit into the spatial structure formed by global cities?
• What kind of changes did the bankruptcy of the Hungarian national airline cause in the spatial configuration of Budapest’s connections?
• How will the time accessibility of certain regions change from the global and semi-peripheral cities?
However, to answer all these questions further methodological issues have been raised.
• What kind of data should be used to examine the spatial shifts?
• What kind of analytical methods and mapping techniques should be used to visualize the changes?
Besides answering the research questions mentioned above, my purpose was to confirm the relevance of air traffic data in the world city research.
Moreover, my aim was to summarize the results of previous world city examinations, to present the main scientific approaches and their primary critics, as well as to explain the main characteristics of aviation.
III. Methodology
The examination of the spatial relationship of world cities is a complex task for several reasons. Therefore, based on former studies (DERUDDER,B. et al.
2008, KEELING,D.J.1995, MATSUMOTO,H. 2004, 2007, ZOOK,M.A.–BRUNN S.
D. 2004, 2005, 2006), I basically used quantitative research methods and in the absence of adequate databases, my examination was based on internet data collection.
1. Determination of the analytical units
In this paper the units analysed were world cities and global cities situated at the top of the world city hierarchy. In my point of view, world cities are the commanding and controlling centres of the world economy. World cities are such nodes, where the production of special services and the organization and control of interdependent material, economic and cultural flows are taking place. Using this definition and based on JOHN FRIEDMANN’S (1986) concept, I determined 100 cities that were considered world cities in my study. The ranking of the world cities was based on the population of the cities (www.citypopulation.de), their role in the world economy (GaWC rank) and the passenger traffic of the cities’ airports (ACI 2006). According to these conditions, the geographical distribution of the world cities was the following: Europe (32), North-America (23), Far-East (22), Latin- America (8), Africa (6), Middle-East and Southwest-Asia (5), Oceania (4).
The determination of global cities was also crucial for my analysis, since they served not only as departure airports during the data survey, but they had an important role in calculating the economic distance values too. In this study, I consider a small number of world cities to be global cities, that is six world cities with global roles from each of the three economic core regions. According to my examination, global cities are at the top of world city hierarchy that, as they are flow and network centres, provide the flow and production of knowledge and information, and ensure the smooth operation of the world economy. Based on this, the following cities are considered as global cities in this study: Amsterdam, Frankfurt, London, Madrid, Paris and Rome; Atlanta, Chicago, Los Angeles, New York, Toronto, Washington D.C. in North America, and finally Bangkok, Beijing, Hong Kong, Singapore, Seoul and Tokyo in the Far East.
2. Data query for the analysis
The data used in this study was obtained from one of the leading online travel agency’s website (www.orbitz.com). Two global data queries, an additional survey as to examine the impacts of the bankruptcy of Malév – and control queries at predetermined and fixed date were performed during the research. The first query was on 1-3 February 2010 for flights leaving on 1 March 2010 and returning on 8 March 2010. The second query was on 5-7 June 2010 for flights leaving on 2 August 2010 and returning on 9 August 2010, while the additional survey was on 6 October 2012 for flights leaving on 5 November 2012 and returning on 12 November 2012. These queries were conducted with the global city as the departure airport for round-trip travel to each destination city, excluding trips from and to the same global city. The data contained the lowest fares (economy seats) the departure-, transfer- and arrival airports, as well as the shortest flight times.
The control queries were executed on monthly (in case of Budapest and world cities) and on weekly (in case of Budapest and alpha world cities) basis from July 2009 to June 2011 using the same method applied in the global data queries.
3. Calculation and visualisation of economic distance
The mapping of economic distance is rather complicated and complex methodologically and also requires a high amount of data and calculation work. As to handle and organize the queried data in order to determine and to map the economic distance between the world cities, the ESRI ArcGIS 9.3 and its modules, as well as the graphic software of CorelDraw were used.
The calculation and the mapping of the economic distance between the world cities and global cities were performed using the parameters of ticket price, geographical distance and price per distance parameter. In order to define the economic distance, first the costs of 1 km travel - the so-called price per distance parameter - from „A” city to „B” city had to be determined. However, as to avoid distorting results the price per distance parameter for four different flight zones had to be determined (Table 1.). So, the costs of one kilometre travel in short-haul
routes was 0,256 USD, in medium-haul routes 0,160 USD, in long-haul routes 0,140 USD and in ultra-long-haul routes 0,122 USD. Finally economic distance of a given city pair was calculated by dividing the ticket prices by the appropriate price per distance parameter.
Flight zone Flight time (h)
Distance (km)
Cost of 1 km flight (USD)
Short-haul <3 <2000 0,256
Medium-haul 3-6 2001-4000 0,160
Long-haul 6-12 4001-9500 0,140
ultra long-haul >12 >9500 0,122 Table 1. Categorization of distance levels in air transportation (Source: AEA 2004, FRANCIS,G.et al. 2007 and own calculation)
4. Visualization of time-distance
In my study, to depict the temporal relations, I chose traditional isochrone mapping techniques. For the preparation of the time distance maps the shortest travel times between the cities were used. For the representation of these data, a geostatistical interpolation procedure - so-called kriging – was used with the difference, that the altitude values of the selected points was substituted by travel time. To implement the necessary calculations and to map the results, the ESRI ArcGIS 9.3 and its Geostatistical Analyst module were used.
IV.
The summary of the results
Due to the structure of the thesis, among the results of the study there are both theoretical and practical in nature.
Theoretical results
1. Based on the relevant academic literature, I came to the conclusion that maps representing economic distance and time distance values can provide an appropriate framework for world city analysis. While on the one hand they eliminate the deficiencies of previous research (e. g. the lack of origin/destination airports data etc.), on the other hand their further advantage is that investigations can be based on exact intercity-flows between world cities.
2. Having examined the economic distance maps of London, New York and Tokyo I came to the conclusion, that only the maps of London and New York revealed positive trends, while on the map of Tokyo the world cities “were becoming more
distant” from each other. So, these results justify my initial assumption only partially.
My research revealed that the capital of the United Kingdom and the American metropolis presented similar territorial structures with sharp regional characteristics, which illustrates the importance of the transatlantic economic relations, the eastward shifting of the existing balance of power and emphasizes the importance of cities in the Indian subcontinent as offshoring and outsourcing centres. In addition, the unexpected result of the economic distance research is that an economic threshold line was highlighted – which in some respects can be considered as a limit of my model - at a distance of approximately 750 km around London. The same phenomenon can be is also experienced in case of New York at the North American region. However, due to the different geographical conditions in the North American continent, two lines can be determined, one at the distance of approximately 500 km and one at about 1600-1800 km far from the city.
In contrast, the map of Tokyo does not reflect the city’s position in the world city hierarchy, as according to my observation, the cities were basically getting more distant from each other. This suggests, that in the case of the Japanese capital some global processes appear site-specific (e.g. high airport charges, overcrowded airport, economic recession in Japan etc.), which may be influenced by additional political and economic decisions that may be reflected in the economic distance values of the city. However, a more detailed explanation of these negative values may be a possible direction for further research.
3. The economic distance analysis of global cities located in economic core regions revealed that the assumptions had been made at the beginning of the research can be just partly justified. In Europe, regardless of the cities’ position in the world city hierarchy, positive shifts are dominant. In North America, the position in the hierarchy has a significant modifying effect, which is best reflected in the connections of New York and Los Angeles. In contrast, in the Far East region the opposite processes were outlined, and positive shifts were dominant in cities of the lower hierarchy levels.
Having examined the economic distance maps of the European core regions, it has been proven, that London can be considered as the continents’ most important economic- and air traffic centre, since its connections showed almost in all cases positive shifts. In case of other cities mixed structures were outlined, but the majority of these shifts were positive. Based on the maps the previously established power structures proved to be stable and Europe has its most important economic relations with the cities of North America. Nevertheless, in the Asia- Pacific region, the rise of China as a new economic centre can be observed, which is in a strong connection with the decline of the Japanese relations. My study also highlighted the fact that even in case of the European cities an economic threshold line has been outlined, according to which a circle can be drawn around the cities at different distances. The cities located within this line show negative shifts, while
cities located over this line show positive shifts. . For example in case of Amsterdam and Madrid this line can be drawn at a distance of around 650 km, at Paris and Frankfurt it is at a distance of approximately 700 km, while in the case of London and Rome it is around 750 km.
My study of the North American core region showed similar trend as experienced in the European region. On macro-regional and city-level a more detailed picture was outlined, which was greatly influenced by the cities’ position in the world city hierarchy. The maps outlined, that in case of the global cities of the United States, the historically evolved close North-Atlantic economic relations proved to be stable. My study also revealed that in the Far East region the economic centre of gravity is not in the Chinese region, as it was in case of Europe, but moved to the offshoring and outsourcing centres of India. In addition, the economic distance maps of New York and Los Angeles outline the economic dependency of the South American region, since these cities show significant and positive shift. The cities of South America are connected to the economy of the United States and thus the global markets through the two gateway cities: New York and Los Angeles.
The economic distance analysis of the global cities of the Far East highlighted that the area is integrated with varying degrees into the global economic processes and system of flows, since completely different spatial structures were outlined both at macro-regional and city level, furthermore negative trends were dominant. My research - revealed that not Tokyo and Hong Kong - the cities at the top of the world city hierarchy - have the best values, but Singapore and the dynamic developing centre of South Korea, Seoul. Moreover, my study revealed that unlike in the previous core regions, in none of the global cities of the Far East can an economic threshold line be outlined.
4. Having examined the economic distance of the peripheral cities it can be concluded that the peripheral location of the cities in the flow systems is highlighted on these maps. Mixed structures were outlined, which were dominated by negative shifts. Moreover, the degree of positive and negative shifts is much higher than experienced in the core areas.
These maps illustrate the historically established dependency – mostly in case of Sao Paulo - and justify, that these areas are still strongly dependent on the United States, because the closest relationships are outlined here. However, the first signs of change turned up, as positive relations with global business centres seem to emerge. This could be the first steps of a deepening global integration.
5. The economic distance analysis of Budapest proved, that in the case of this post- socialist „world city”, similar spatial patterns and dependencies can be outlined as experienced by the European global cities. The Eastern European region’s integration into the Western European economic space is considered to be
continuous. The pre-existing power structures proved to be stable according to present global economic trends.
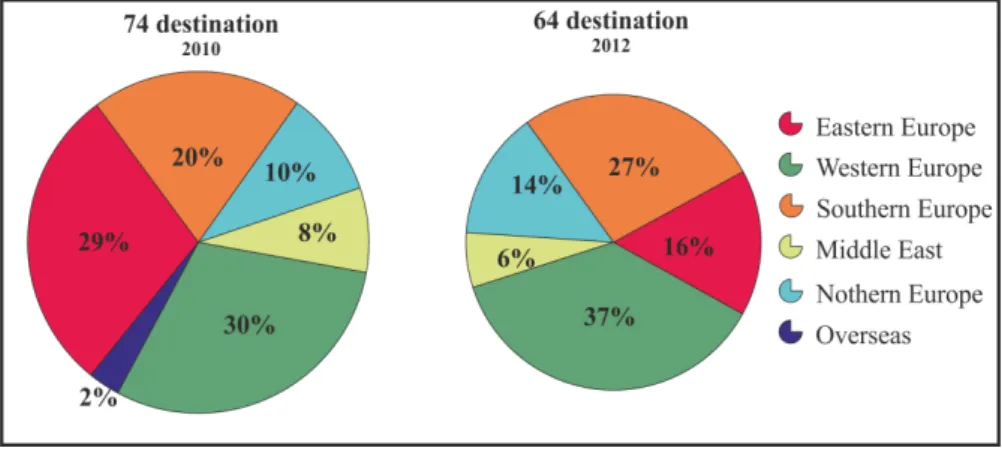
The examination of the Malév’s failure revealed that the ceased operation of the airline resulted in the decrease of traffic, capacity and flight number. The passenger traffic of Liszt Ferenc airport was rearranged, and the importance of the low cost airlines increased significantly. My thesis also highlighted the fact, that the number of directly accessible destinations decreased, which affected mostly the Southeast European, Middle Eastern and intercontinental destinations (Figure 1.).
Figure 1.: The distribution of directly accessible destinations from Budapest in 2010 and 2012
(Source: Own calculation according to ERDŐSI F. 2011 and www.bud.hu)
Having compared the spatial structures of the Hungarian capital before and after the failure of Malév, I concluded that both at macro-regional and city level there are minimal detectable differences only in the extent but not in the direction of the positive and negative shifts. More significant changes were detected in the intra-European city connections of Budapest, due to the failure of Malév, which affected intracontinental connections the most. The economic threshold line of Budapest had been at a distance of approximately 900 km in October 2010, while it had moved to the distance of 1100 km by October 2012.
Based on the temporal investigation I got to the conclusion that the failure of Malév had not significantly changed the economic distance values, while the comparison of the time dimension showed stable main structures at macro-regional level and only minimal differences at the city level.
6. Having examined the time-distances of global cities located in the economic core regions I revealed, that in comparison with the economic distance, the space forming factor of time is smaller due to the evolved system of flows in air
transport. This statement is confirmed by the fact that global cities show greater similarity inside certain macro-regions compared to economic distance maps. In case of the temporal relations, differences between core regions can be observed.
The historically evolved centre-periphery relations stand, as well as the better values of the European and North American cities compared with the cities in the Far East.
The time maps of the European cities’ outlined that good time accessibility is associated with leading role in the economy and good air connectivity. Therefore Europe’s three economic and business centres (London, Frankfurt and Paris) have the best time-distance values. In addition, the maps are depicting the time accessibility, emphasizing nodal role of the global cities on the continent. They have also direct air connection with most of Europe’s world cities, so the vast majority of the continent is accessible within four hour travel time.
According to the time-distance maps of North American cities similar spatial patterns were outlined inside and outside the continent due to the widely used hub and spoke system and the continents’ geographical features. These spatial patters stress the prominent role of New York as economic and political gateway in the intercontinental space of flows, since it had the best values among the North American global cities.
The time-distance maps of global cities of Pacific Asia’s revealed that some cities have weaker values, and compared to reference values they are below ideal due to geographical fragmentation and developmental differences within the region. At a macro-regional level, the South American continent is a periphery from the Asian cities, while the core regions show good time accessibility values.
These maps outline – in contrast with the economic distance maps – the previously evolved power structures. Moreover the cities show positive shifts which are situated at the top of the world city hierarchy, so Beijing and Tokyo stands out as the two major nodes of flow.
7. In accordance with the examination of the semi-peripheral and peripheral cities with global roles geographical location, as well as peripheral position in the system of flows, resulted in weaker time accessibilities in the case of the researched cities.
More area is dominated by negative tendencies and positive trends could be observed only in North America as well as in Western Europe. The investigation also showed that global events, such as the 2010 football World Cup in South Africa can positively alter the time accessibility of certain region, however, this rate is much smaller than experienced in the case of the economic distance values.
8. Having examined the time-distance of Budapest great similarity was shown with the time accessibility structures of the European global cities on a global scale. The temporal comparison also revealed that the bankruptcy of Malév changed essentially the time accessibility of certain areas. The most significant changes
have taken place in Europe, since the Hungarian airline’s route network was primarily focused on the cities of the continent. Due to the termination of these direct links in Eastern Europe, South-Western Europe and the Balkan Peninsula accessibility zones decreased.
The study has highlighted also, that a failure of a dominant market participant can lead to new power- and flow structures, which does not necessarily entail negative effects. The bankruptcy of Malév confirmed the former statement, since new entrants have appeared in the Hungarian market, so certain regions became accessible via other air channels, which improved their time-distance values. Based on this, new routes has started operating by Qatar Airways from Budapest, resulted decrease in time-distance of the southern part of Far East and Australia in October 2012. While similar processes were outlined in the Baltic area due to the new routes of airBaltic.
Practical results
In my study a new data analysing and mapping method was developed, which is appropriate for flow-mapping between world cities and exploring their spatial relationships.
Economic distance maps were created based on the latter mentioned methodology (Figure 2.) depicting the economic distance in relation to geographical distance between the city-pairs. Those connections, which are cheaper in relation to geographical distance assume intense relationships and show positive shifts, while in case of weaker connections negative shifts is dominant.
Time-distance maps representing accessibility between world cities summarize travel times of the city-pairs on one map, while maintaining the spatial distances, they illustrate temporal relations using isolines (Figure 3.). Mapping isolines, I used a geostatistical interpolation procedure called kriging. This process resulted a more detailed „timesurface” then the usually used interpolation procedures. In addition, to help the analization of the time-distance maps I created idealized time maps. To illustrate time-distance flight time of direct air links were used thus they served as a reference for the analysis of the temporal accessibility.
V. Applicability of the research results
The results of the study could be utilized in several ways both in theory and practice.
• My theoretical results can be used in wider world city network research and air traffic research as well, because only few economic geography analyses’ examined the space forming factor of economic- and time- distance so far.
• Analytical methods presented in the thesis can generate discussions, and may inspire further research in a similar point of view.
• Economic- and time-distance maps can help to uncover the spatial structure of the world, as well as they can underpin the former results of world city network research from a new point of view.
• Economic distance maps can be useful both in economic and geopolitical aspect, since they show important information and depict the major nodes which determine the configuration of the world economy. Moreover they can help in the preparation of corporate decision making, since they delineate the weakly accessible, poorly connected areas.
VI. Further directions of the research
The directions in the further research of this topic can be both theoretical and methodological. In the theoretical analysis of geographical distance the involvement of further indicators (e.g. flight frequency, aircraft utilization, passenger numbers) may be relevant, which could enhance the quantification of flows between the world cities. Moreover, the study can be extended by involving the cities of semi-periphery and periphery with world city functions, and this extension also the extent of these areas’ integrity into the economic system and system of flows would become also measurable. The repetition of this examination at later times would provide the opportunity to track the changes in terms of the economic distances, thus to measure the effects of the economic and political processes. Finally to take further the methodology of the research, the refinement of the calculation and mapping procedure by involving further indices would be favourable as it would help to eliminate the limitations of the model and would also improve the mapping of spatial relations.
Publications in the subject of the thesis
1. DUDÁS G. 2010a: A légi közlekedési szektor liberalizációja és az európai fapados piac. - Tér és Társadalom. 1. pp. 137-184.
2. DUDÁS G. 2010b: Low-cost Airlines in Europe: Network Structures After the Enlargement of the European Union. – Geographica Pannonica. 14. 2. pp. 49- 58.
3. DUDÁS G.–JURKOVICS M.–NAGY GY. 2010: Centre-periphery disparities in air accessibility. – Geographica Timisiensis. 19. 1. pp. 219-229.
4. DUDÁS G. – MÓRICZ Á. 2010: Budapest térkapcsolatai az európai fapados piacon. In: BAJMÓCY P. – JÓZSA K. (szerk.) Geográfus Doktoranduszok X.
Országos Konferenciája. - SZTE TTIK Gazdaság- és Társadalomföldrajz Tanszék, Szeged. CD-Kiadvány.
5. DUDÁS G. – PERNYÉSZ P. 2011a: A globális városok térkapcsolatának vizsgálata légi közlekedési adatok felhasználásával. - Tér és Társadalom. 4.
pp. 81-105.
6. DUDÁS G.– PERNYÉSZ P. 2011b: A világvárosok gazdasági távolságának és elérhetőségének összehasonlító vizsgálata légi közlekedési adatok felhasználásával. In: BAJMÓCY P. – JÓZSA K. (szerk.) Geográfus Doktoranduszok XI. Országos Konferenciája. - SZTE TTIK Gazdaság- és Társadalomföldrajz Tanszék, Szeged. CD-Kiadvány.
7. DUDÁS G.–PERNYÉSZ P. 2011c: Shrinking distances? Mapping the economic distance of world cities using air traffic data. - In KOVALCIK,J.–MURÁNSKY, M.–ROCHOVSKÁ,A. (eds.): Where do we go from there? Economic trends, social trajectories and policies of identities in post-communist capitalism:
collection of papers from the 4th Forum of PhD Students International Seminar: Bratislava, Slovak Republic, October 1-2, 2010. pp. 32-44.
8. DUDÁS G.–PERNYÉSZ P.–KATONA Á. 2011: „Shrinking distances?” Mapping the economc distance and accessibility of the European hub cities using air traffic data. - EuroBroadMap: Europe seen from here and elsewhere.
International Conference – Part of the FP7 project „Visions of Europe in the world” 1-2 Dec. 2011. pp. 78-84.
9. MÓRICZ Á. – DUDÁS G. 2010: Globális városhierarchia és elérhetőség – Budapest és a világvárosok légi kapcsolatának vizsgálata. - In: CSAPÓ T.– KOCSIS ZS. (szerk.): A településföldrajz általános kérdései. Savaria University Press, Szombathely. pp. 153-164.
10. PERNYÉSZ P.–DUDÁS G.2012: Térinformatikai módszerek alkalmazása légi forgalmi adatok elemzésében. – In: PÁL V. (szerk.): A társadalomföldrajz lokális és globális kérdései. SZTE-TTIK Gazdaság- és Társadalomföldrajz Tanszék, Szeged. pp. 220-230.
Other publications
1. PÁL V.–BOROS L.–DUDÁS G. (2011): Az autógyártás húzóágazattá válása és sajátos földrajzi kérdései Kelet-Közép-Európában. Tiszteletkötet Rudl József 60. születésnapjára, PTE, Pécs
The publication/presentation is supported by the European Union and co-funded by the European Social Fund. Project title: “Broadening the knowledge base and supporting the long term professional sustainability of the Research University Centre of Excellence at the University of Szeged by ensuring the rising generation of excellent scientists.” Project number: TÁMOP-4.2.2/B- 10/1-2010-0012