Molecular therapies
. János Aradi . Zoltán Balajthy
. Éva Csősz . Beáta Scholtz . István Szatmári
. József Tőzsér . Tamás Varga
Edited by . Zoltán Balajthy and Dr.. József Tőzsér
, University of Debrecen
Molecular therapies
by . János Aradi, . Zoltán Balajthy, . Éva Csősz, . Beáta Scholtz, . István Szatmári, . József Tőzsér, . Tamás Varga, . Zoltán Balajthy, Dr.. József Tőzsér, and
Copyright © 2011 The project is funded by the European Union and co-financed by the European Social Fund., Manuscript completed: 17 November 2011
―Manifestation of Novel Social Challenges of the European Union in the Teaching Material of Medical Biotechnology Master‘s Programmes at the University of Pécs and at the University of Debrecen‖ Identification number: TÁMOP-4.1.2-08/1/A-2009-0011
Table of Contents
Index ... 1
1. 1. Functional Genomics ... 5
1. 1.1 Definitions ... 5
2. 1.2 About diseases ... 5
3. 1.3 Approaches to understanding disease mechanisms ... 5
3.1. 1.3.1 Gene expression is regulated in several basic ways ... 6
3.2. 1.3.2 Microarrays: functional genomics in cancer research ... 6
3.3. 1.3.3 A Variety of Genetic Alterations Underlie Developmental Abnormalities and Disease ... 6
3.4. 1.3.4 Genomic microarrays ... 7
3.4.1. 1.3.4.1 Array based comparative genome hybridization (aCGH) ... 8
2. 2. Recombinant proteins ... 9
1. 2.1 Overview: Protein pharmaceuticals ... 9
2. 2.2 Cell-free systems: In vitro transcription and translation ... 9
3. 2.3 Recombinant protein expression in isolated cells (cell culture) ... 10
4. 2.4 Non-prokaryotic expression systems ... 10
4.1. 2.4.1 Cloning in Pichia pastoris ... 10
4.2. 2.4.2 Baculovirus mediated protein expression in insect cells ... 10
4.3. 2.4.3 Mammalian expression systems ... 11
5. 2.5 Purification of recombinant proteins ... 11
3. 3. Gene Therapy: Vectors and Strategies. ... 13
1. 3.1 Vectors for Gene Therapy ... 13
2. 3.2. Types of gene transfer, vectors for gene therapy ... 14
3. 3.3. General gene therapy strategies ... 22
4. 3.4. Human gene therapy ... 24
4. 4. Protein replacement therapies. ... 31
1. ... 31
5. 5. Recombinant antibodies and the phage display technology ... 37
1. 5.1. Introduction ... 37
1.1. 5.1.1. The structure of antibodies and their production in the body ... 37
1.2. 5.1.2. Antigen-antibody binding ... 39
2. 5.2. The production of therapeutic antibodies ... 40
2.1. 5.2.1. The production of antibodies in hybridoma cells. ... 41
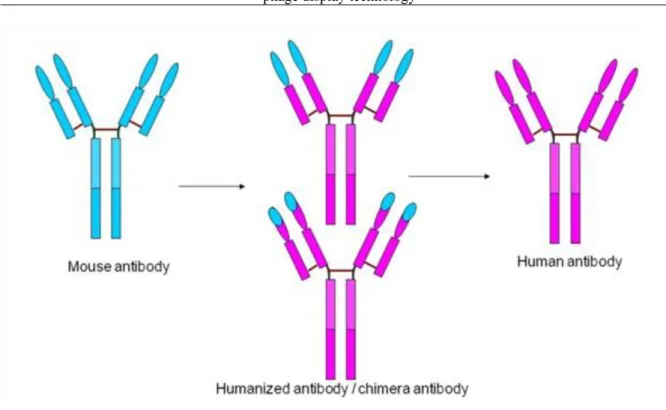
2.2. 5.2.2. Humanized antibodies ... 41
2.3. 5.2.3. Production of human antibodies ... 42
3. 5.3. Generation of antibodies by phage display ... 42
3.1. 5.3.1. The phage display technology ... 42
3.2. 5.3.2. Generation of phage libraries ... 45
4. 5.4. Administration of therapeutic antibodies ... 48
6. 6. Anti-cytokine Therapy (sepsis). ... 51
1. 6.1. The consequences of developing inflammation ... 51
2. 6.2. Development of Inflammatory Response: Synthesis of Lipid Mediators ... 53
3. 6.3. Role of the Liver in Maintenance of Homeostasis: Acute Phase Response ... 56
4. 6.4. Time-Course of the Inflammatory Response During Sepsis ... 58
7. 7. Animal models and transgenesis in biotechnology ... 66
1. ... 66
8. 8. Embryonic and adult stem cells in regenerative medicine I. ... 69
1. 8.1 Embryonic stem cells ... 69
2. 8.2 Somatic cell reprogramming into pluripotent stem cells ... 71
3. 8.3 Adult stem cells ... 75
9. 9. Embryonic and adult stem cells in regenerative medicine II. ... 77
1. 9.1 Pluripotent stem cells for regenerative medicine ... 77
2. 9.2 Clinical application of stem cells ... 79
3. 9.3 Stem cell therapy to cure various diseases ... 81
10. 10. Cell Cycle and Cancer Therapy, p53 I. ... 83
1. 10.1 Cell Cycle ... 83
2. 10.2. Mitogenic Signaling in Eukaryotic Cell Controls the Rate of Cell Division ... 85
3. 10.3. Biochemical Events of Cell-cycle – in M Phase ... 88
4. 10.4. Protooncogenes ... 88
5. 10.5. ErbB/HER Receptors ... 90
6. 10.6. Therapeutic targets ... 90
11. 11. Cell Cycle and Cancer Therapy, p53 II. ... 96
1. 11.1. Tumor Suppressor Genes and p53 ... 96
2. 11.2. Biochemical Pathways of Apoptosis and its Therapeutic Utilization ... 100
12. 12. Gene Silencing Technologies. ... 104
1. 12.1 Introduction ... 104
2. 12.2 Action of antisense oligonucleotides ... 104
3. 12.3 Chemical modifications of gene silencing oligonucleotides; general considerations 106 4. 12.4 Inhibition of transcription by triple helix forming oligonucleotides ... 110
5. 12.5 Gene silencing by ribozymes ... 112
6. 12.6 Gene silencing with short RNA fragments ... 115
7. 12.7 Important final note ... 120
List of Figures
1.1. Figure 1.1. Global analysis of gene expression ... 6
1.2. Figure 1.2. Mapping of genetic aberration ... 7
1.3. Figure 1.3. Different arrays for different purposes ... 7
1.4. Figure 1.4. Array CGH maps DNA copy number, alteration to position in the genome ... 8
2.1. Figure 2.1. Linearization of template ... 10
2.2. Figure 2.2. Baculovirus/insect expression system ... 11
2.3. Figure 2.3. Methotrexate (MTX) selection ... 11
2.4. Figure 2.4. Conventional purufucation strategy ... 12
3.1. Figure 3.1. In vivo gene therapy ... 13
3.2. Figure 3.2. Ex vivo gene therapy ... 13
3.3. Figure 3.3. Liposomes ... 14
3.4. Figure 3.4. Naked DNA ... 14
3.5. Figure 3.5. Gene particle bombardment ... 15
3.6. Figure 3.6. Retrovirus ... 16
3.7. Figure 3.7. Life cycle of retroviruses ... 16
3.8. Figure 3.8. Moloney Murine Leukemia Virus Based Retroviral Vector I. ... 16
3.9. Figure 3.9. Moloney Murine Leukemia Virus Based Retroviral Vector II. ... 17
3.10. Figure 3.10. Retroviral gene therapy ... 18
3.11. Figure 3.11. Lentiviral vector ... 19
3.12. Figure 3.12. Adenoviruses ... 20
3.13. Figure 3.13. Evolution and adenoviral vectors ... 20
3.14. Figure 3.14. Adenoviral gene therapy ... 21
3.15. Figure 3.15. Adeno-associated viruses ... 21
3.16. Figure 3.16. Gene therapy strategies I. ... 22
3.17. Figure 3.17. Gene therapy strategie II. ... 23
3.18. Figure 3.18. Gene therapy strategie III. ... 23
3.19. Figure 3.19. Severe combined immunodeficiency (SCID); lack of adenosine deaminase (ADA) 24 3.20. Figure 3.20. Gene therapy for severe immunodeficiency synfrom I. ... 25
3.21. Figure 3.21. Gene therapy for severe immunodeficiency synfrom I. ... 25
3.22. Figure 3.22. Ornithine transcarbamoilase (OTC) deficiency ... 26
3.23. Figure 3.23. Transports of lipids with plasma lipoproteins ... 27
3.24. Figure 3.24. Regulation of the mevalonate pathway ... 27
3.25. Figure 3.25. Levels of the genetic deficiencies of LDL receptor ... 28
3.26. Figure 3.26. Correlation between the LDL cholesterol level of blood and the number of LDL receptors in liver ... 28
3.27. Figure 3.27. General treatments of the high plasma cholesterol level ... 29
4.1. Figure 4.1. Structure of insulin. ... 32
4.2. Figure 4.2. Cohn fractionation. ... 33
4.3. Figure 4.3. Activation of Factor XI. ... 34
4.4. Figure 4.4. Structure and activation of Factor VIII. ... 34
4.5. Figure 4.5. Steps in a human Factor VIII gene transfer protocol. ... 35
5.1. Figure 5.1. The structure of antibodies. ... 37
5.2. Figure 5.2. The structure of antibody heavy chain. ... 38
5.3. Figure 5.3. The structure of antibody light chain. ... 38
5.4. Figure 5.4. Production of antibodies by B cells. ... 38
5.5. Figure 5.5. The clonal selection and clonal expansion. ... 39
5.6. Figure 5.6. Polyclonal antibodies. ... 39
5.7. Figure 5.7. Monoclonal antibodies. ... 40
5.8. Figure 5.8. Production of antiodies in hybridoma cells. ... 41
5.9. Figure 5.9. Humanized antibodies. ... 41
5.10. Figure 5.10. Production of human antibodies in genetically modified mice. ... 42
5.11. Figure 5.11. The structure of M13 phage. ... 43
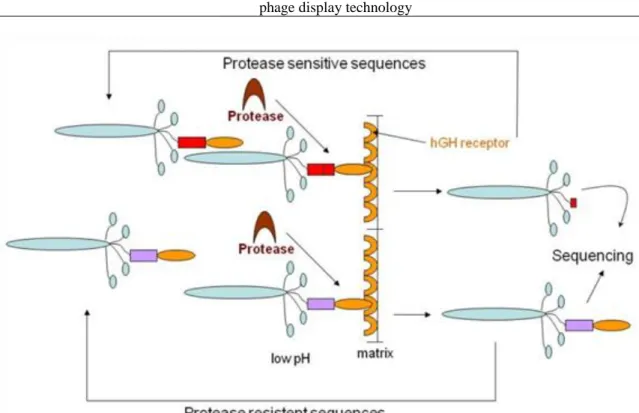
5.12. Figure 5.12. Specific elution of immobilized phage particles. ... 43
5.13. Figure. 5.13. Enzyme phage display. ... 44
5.14. Figure 5.14. Substrate phage display I. ... 44
5.15. Figure 5.15. Substrate phage display II. ... 44
5.16. Figure 5.16. Enzyme-substrate phage display I. ... 44
5.17. Figure 5.17. Enzyme-substrate phage display II. ... 45
5.18. Figure 5.18. Generation of phage libraries. ... 45
5.19. Figure 5.19. Generation of protease substrate phage library. ... 46
5.20. Figure 5.20. Substrate phage display –engineering of protease substrate sequences. ... 46
5.21. Figure 5.21. In vivo phage display – mapping vascular endothelial cells. ... 47
5.22. Figure 5.22. Generation of antibody libraries from whole blood. ... 47
5.23. Figure 5.23. The mechanism of antibody dependent cell mediated cytotoxicity (ADCC). ... 48
5.24. Figure 5.24. Administration therapeutic antibodies with immunosupressant activity. ... 49
5.25. Figure 5.25. Forms of therapeutic antibodies. ... 49
5.26. Figure 5.26. Forms of small-sized therapeutic antibodies. ... 50
6.1. Figure 6.1. Migration of neutrofil from vascular space to tissues ... 51
6.2. Figure 6.2. Stream of cytokines in sepsis ... 52
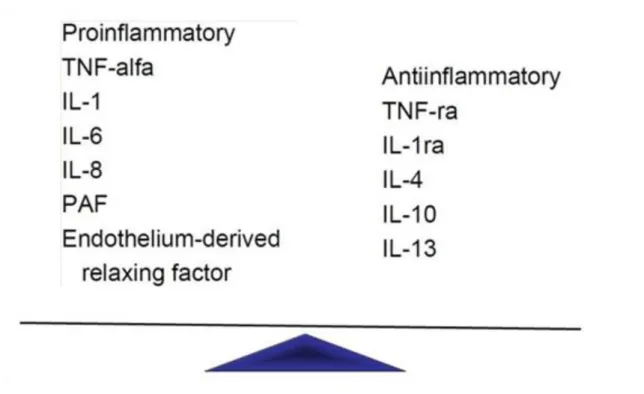
6.3. Figure 6.3. Inflammatory cytokines and anti-cytokines ... 52
6.4. Figure 6.4. Development of inflammatory response, synthesis of lipid mediators ... 53
6.5. Figure 6.5. Development of inflammatory response I. ... 54
6.6. Figure 6.6. Indication of cytokine synthesis of inflammation ... 55
6.7. Figure 6.7. Synthesis of NO controlled by cytokine ... 56
6.8. Figure 6.8. Acute phase response ... 57
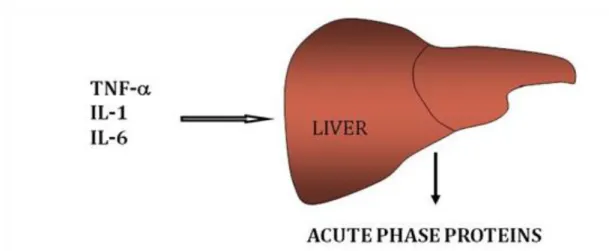
6.9. Figure 6.9. Inflammatory mediators that modulate hepatic APR synthesis ... 57
6.10. Figure 6.10. Time-course of the inflammatory response during sepsis ... 58
6.11. Figure 6.11. Endothelial activation, coagulation and fibrin clot formation I. ... 59
6.12. Figure 6.12. Coagulation response ... 60
6.13. Figure 6.13. Endothelial activation, coagulation and fibrin clot formation II. ... 60
6.14. Figure 6.14. Coagulation, fibrin clot formation and inhibition of fibrinolysis ... 61
6.15. Figure 6.15. Endogenous activated Protein C has multiple Mechanisms of activation ... 62
6.16. Figure 6.16. Contribution of high-mobility group box1 (HMGB1) to sepsis ... 63
6.17. Figure 6.17. Collapse of homeostasis ... 63
6.18. Figure 6.18. Development of septic shock and organ failure ... 64
8.1. Figure 8.1. Stem cells I. ... 69
8.2. Figure 8.2. Stem cells II. ... 69
8.3. Figure 8.3. The most important characteristics of embryonic stem (ES) cells ... 70
8.4. Figure 8.4. Generation of human ES cells ... 71
8.5. Figure 8.5. Generation of transgenic and knock out mice (blastocyst injection) ... 71
8.6. Figure 8.6. Nucleic reprogramming of somatic cells into pluripotent cells ... 72
8.7. Figure 8.7. Animal cloning is based on somatic cells nuclear transfer (SCNT) ... 72
8.8. Figure 8.8. IN human only therapeutic cloning ... 73
8.9. Figure 8.9. Induced pluripotent stem (iPS) cell generation ... 73
8.10. Figure 8.10. Lineage specific reprogramming (trans-differentiation) by transcription factors 74 8.11. Figure 8.11. The promise of ES/iPS cell research ... 74
8.12. Figure 8.12. Adult stem cell example: hematopoetic stem cells (HSC) ... 75
9.1. Figure 9.1. ES (iPS) based transplantation medicine ... 78
9.2. Figure 9.2. iPS cells based gene correction ... 78
9.3. Figure 9.3. Transgene delivery strategies ... 78
9.4. Figure 9.4. Curative potential 34CD+ hematopoetic stem cells (HSC) to treat disorders of the blood system ... 80
9.5. Figure 9.5. Are there any spontaneous lineage conversions (trans-differentiation) in vivo? ... 81
10.1. Figure 10.1. The functional cell cycle ... 83
10.2. Figure 10.2. Cyclin-CDK regulators of cell cycle ... 83
10.3. Figure 10.3. Constitutive and inducible cell cycle kinase inhibitors ... 84
10.4. Figure 10.4. Mitogen-Activated Protein (MAP) kinase cascade ... 85
10.5. Figure 10.5. Transcriptional events in G1 phase of cell-cycle ... 86
10.6. Figure 10.6. Mechanisms of gene-supression by the Retinoblastoma Protein ... 87
10.7. Figure 10.7. Biochemical events of cell-cycle in M-phase ... 88
10.8. Figure 10.8. Cancer causing genes in mitotic signal pathway ... 89
10.9. Figure 10.9. Proto-oncogenes and oncogenes ... 89
10.10. Figure 10.10. Different families of Receptor Tirosi Kinase recognize a diverse set of different ligands ... 91
10.11. Figure 10.11. Ligand binding activates RTKs by dimerization ... 91
10.12. Figure 10.12. Proto-oncogenes are normal genes that can become oncogenes ... 91
10.13. Figure 10.13. Neu, EGFR targeting methods ... 92
10.14. Figure 10.14. Expression of HER2 receptor on the surface of normal and tumor cells ... 92
10.15. Figure 10.15. Therapeutic targets ... 93
10.16. Figure 10.16. Blocking of oncoproteins of EGFR and Mitogen-Activated Protein Kinase signalization via monoclonal abs and specific inhibitors ... 93
11.1. Figure 11.1. Transcriptional events in G1 phase of cell-cycle ... 96
11.2. Figure 11.2. Tumor suppressor genes: retinoblastoma and P53 ... 96
11.3. Figure 11.3. Regulation transcription factor of P53 I. ... 97
11.4. Figure 11.4. Regulation transcription factor of P53 II. ... 97
11.5. Figure 11.5. Primary structure of transcription factor p53 ... 98
11.6. Figure 11.6. Restoration of p53 function in tumor cells I. ... 98
11.7. Figure 11.7. Restoration of p53 function in tumor cells II. ... 98
11.8. Figure 11.8. Loss of p53 is observed in 50% of all human cancers ... 99
11.9. Figure 11.9. Morphology of apoptosis ... 100
11.10. Figure 11.10. Biochemical pathways of caspase activation dependent cell death ... 101
11.11. Figure 11.11. Killing tumors by induction of apoptosis ... 101
11.12. Figure 11.125. Cell death prevention after Stroke ... 102
12.1. Figure 12.1. The basic concept of antisense activation ... 104
12.2. Figure 12.2. Potential mechanisms of action of antisense oligonucleotides ... 105
12.3. Figure 12.3. Stability, cellular uptake of antisense oligonucleotides, accessibility to the target 105 12.4. Figure 12.4. Chemical modification of gene silencing oligonucleotides I. ... 107
12.5. Figure 12.5. Chemical modification of gene silencing oligonucleotides II. ... 107
12.6. Figure 12.6. Chemical modification of gene silencing oligonucleotides III. ... 107
12.7. Figure 12.7. Chemical modification of gene silencing oligonucleotides IV. ... 108
12.8. Figure 12.8. Chemical modification of gene silencing oligonucleotides V. ... 108
12.9. Figure 12.9. Half lives of natural DNA, phosphorotioate (PS) and end-blocked oligonucleotides with 2‘-OCH3 or locked nucleotides (LNA in human serum ... 109
12.10. Figure 12.10. Gene silencing in the laboratory for experimental purposes ... 110
12.11. Figure 12.11. Schematic representation of triple helix ... 111
12.12. Figure 12.12. A comparison of the anti-gene and anti-sense strategy ... 111
12.13. Figure 12.13. Structure of parallel triplets ... 111
12.14. Figure 12.14. Structure of antiparallel triplets ... 112
12.15. Figure 12.15. General structures of ribozymes often utilized for gene silencing ... 113
12.16. Figure 12.16. Merchanism of celf-splicing of the rRNA precursor of Tetrahymena ... 113
12.17. Figure 12.17. Construction of hammerhead ribozymes against M1 RNA ... 113
12.18. Figure 12.18. Group I intron ribozyme designed to bind and repear mutant p53 ... 114
12.19. The miRNAs are endogenous noncoding RNAs. The antisense strand of miRNAs does not form a perfect double helix of the target mRNA. Usually multiple binding sites exist for miRISC at the 3‘ untranslated region of the target mRNA. ... 115
12.20. Figure 12.20. miRNA and siRNA pathways ... 116
12.21. Figure 12.21. miRNA and siRNA biosynthetic pathway ... 116
12.22. Figure 12.22. miRNA and siRNA pathways, and various methods to induce RNA interference 117 12.23. Figure 12.23. Functionally active siRNA ... 117
12.24. Figure 12.24. Roles of Ago proteins in gene silencing induced by siRNA and miRNA ... 117
12.25. Figure 12.25. Plasmids expressing functional shRNA ... 118
12.26. Figure 12.26. Action of shRNA-plasmid gene silencer ... 118
12.27. Figure 12.27. Gene silencing with 21 nt long dsRNA oligos ... 119
12.28. Figure 12.28. Lentiviral delivery of shRNA and its mode of action ... 119
Index
LIST OF FIGURES
• Figure 1.1. Global analysis of gene expression
• Figure 1.2. Mapping of genetic aberration
• Figure 1.3. Different arrays for different purposes
• Figure 1.4. Array CGH maps DNA copy number, alteration to position in the genome
• Figure 2.1. Linearization of template
• Figure 2.2. Baculovirus/insect expression system
• Figure 2.3. Methotrexate (MTX) selection
• Figure 2.4. Conventional purufucation strategy
• Figure 3.1. In vivo gene therapy
• Figure 3.2. Ex vivo gene therapy
• Figure 3.3. Liposomes
• Figure 3.4. Naked DNA
• Figure 3.5. Gene particle bombardment
• Figure 3.6. Retrovirus
• Figure 3.7. Life cycle of retroviruses
• Figure 3.8. Moloney Murine Leukemia Virus Based Retroviral Vector I.
• Figure 3.9. Moloney Murine Leukemia Virus Based Retroviral Vector II.
• Figure 3.10. Retroviral gene therapy
• Figure 3.11. Lentiviral vector
• Figure 3.12. Adenoviruses
• Figure 3.13. Evolution and adenoviral vectors
• Figure 3.14. Adenoviral gene therapy
• Figure 3.15. Adeno-associated viruses
• Figure 3.16. Gene therapy strategies I.
• Figure 3.16. Gene therapy strategie II.
• Figure 3.16. Gene therapy strategie III.
• Figure 3.17. Severe combined immunodeficiency (SCID); lack of adenosine deaminase (ADA)
• Figure 3.18. Gene therapy for severe immunodeficiency synfrom I.
• Figure 3.19. Gene therapy for severe immunodeficiency synfrom I.
• Figure 3.20. Ornithine transcarbamoilase (OTC) deficiency
• Figure 3.21. Transports of lipids with plasma lipoproteins
• Figure 3.22. Regulation of the mevalonate pathway
• Figure 3.23. Levels of the genetic deficiencies of LDL receptor
• Figure 3.24. Correlation between the LDL cholesterol level of blood and the number of LDL receptors in liver
• Figure 3.25. General treatments of the high plasma cholesterol level
• Figure 4.1. Structure of insulin.
• Figure 4.2. Cohn fractionation.
• Figure 4.3. Activation of Factor XI.
• Figure 4.4. Structure and activation of Factor VIII.
• Figure 4.5. Steps in a human Factor VIII gene transfer protocol.
• Figure 5.1. The structure of antibodies.
• Figure 5.2. The structure of antibody heavy chain.
• Figure 5.3. The structure of antibody light chain.
• Figure 5.4. Production of antibodies by B cells.
• Figure 5.5. The clonal selection and clonal expansion.
• Figure 5.6. Polyclonal antibodies.
• Figure 5.7. Monoclonal antibodies.
• Figure 5.8. Production of antiodies in hybridoma cells.
• Figure 5.9. Humanized antibodies.
• Figure 5.10. Production of human antibodies in genetically modified mice.
• Figure 5.11. The structure of M13 phage.
• Figure 5.12. Specific elution of immobilized phage particles.
• Figure 5.13. Enzyme phage display.
• Figure 5.14. Substrate phage display I.
• Figure 5.15. Substrate phage display II.
• Figure 5.16. Enzyme-substrate phage display I.
• Figure 5.17. Enzyme-substrate phage display II.
• Figure 5.18. Generation of phage libraries.
• Figure 5.19. Generation of protease substrate phage library.
• Figure 5.20. Substrate phage display –engineering of protease substrate sequences.
• Figure 5.21. In vivo phage display – mapping vascular endothelial cells.
• Figure 5.22. Generation of antibody libraries from whole blood.
• Figure 5.23. The mechanism of antibody dependent cell mediated cytotoxicity (ADCC).
• Figure 5.24. Administration therapeutic antibodies with immunosupressant activity.
• Figure 5.25. Forms of therapeutic antibodies.
• Figure 5.26. Forms of small-sized therapeutic antibodies.
• Figure 6.1. Migration of neutrofil from vascular space to tissues
• Figure 6.2. Stream of cytokines in sepsis
• Figure 6.3. Inflammatory cytokines and anti- cytokines
• Figure 6.4. Development of inflammatory response, synthesis of lipid mediators
• Figure 6.5. Development of inflammatory response I.
• Figure 6.6. Indication of cytokine synthesis of inflammation
• Figure 6.7 Synthesis of NO controlled by cytokine
• Figure 6.8. Acute phase response
• Figure 6.9. Inflammatory mediators that modulate hepatic APR synthesis
• Figure 6.10. Time-course of the inflammatory response during sepsis
• Figure 6.11. Endothelial activation, coagulation and fibrin clot formation I.
• Figure 6.12. Coagulation response
• Figure 6.13. Endothelial activation, coagulation and fibrin clot formation II.
• Figure 6.14. Coagulation, fibrin clot formation and inhibition of fibrinolysis
• Figure 6.15. Endogenous activated Protein C has multiple Mechanisms of activation
• Figure 6.16. Contribution of high-mobility group box1 (HMGB1) to sepsis
• Figure 6.17. Collapse of homeostasis
• Figure 6.18. Development of septic shock and organ failure
• Figure 8.1. Stem cells I.
• Figure 8.2. Stem cells II.
• Figure 8.3. The most important characteristics of embryonic stem (ES) cells
• Figure 8.4. Generation of human ES cells
• Figure 8.5. Generation of transgenic and knock out mice (blastocyst injection)
• Figure 8.6. Nucleic reprogramming of somatic cells into pluripotent cells
• Figure 8.7. Animal cloning is based on somatic cells nuclear transfer (SCNT)
• Figure 8.8. IN human only therapeutic cloning
• Figure 8.9. Induced pluripotent stem (iPS) cell generation
• Figure 8.10. Lineage specific reprogramming (trans-differentiation) by transcription factors
• Figure 8.11. The promise of ES/iPS cell research
• Figure 8.12. Adult stem cell example: hematopoetic stem cells (HSC)
• Figure 9.1. ES (iPS) based transplantation medicine
• Figure 9.2. iPS cells based gene correction
• Figure 9.3. Transgene delivery strategies
• Figure 9.4. Curative potential 34CD+ hematopoetic stem cells (HSC) to treat disorders of the blood system
• Figure 9.5. Are there any spontaneous lineage conversions (trans-differentiation) in vivo?
• Figure 10.1. The functional cell cycle
• Figure 10.2. Cyclin-CDK regulators of cell cycle
• Figure 10.3. Constitutive and inducible cell cycle kinase inhibitors
• Figure 10.4. Mitogen-Activated Protein (MAP) kinase cascade
• Figure 10.5. Transcriptional events in G1 phase of cell-cycle
• Figure 10.6. Mechanisms of gene-supression by the Retinoblastoma Protein
• Figure 10.7. Biochemical events of cell-cycle in M- phase
• Figure 10.8. Cancer causing genes in mitotic signal pathway
• Figure 10.9. Proto-oncogenes and oncogenes
• Figure 10.10. Different families of Receptor Tirosi Kinase recognize a diverse set of different ligands
• Figure 10.11. Ligand binding activates RTKs by dimerization
• Figure 10.12. Proto-oncogenes are normal genes that can become oncogenes
• Figure 10.13. Neu, EGFR targeting methods
• Figure 10.14. Expression of HER2 receptor on the surface of normal and tumor cells
• Figure 10.15. Therapeutic targets
• Figure 10.16. Blocking of oncoproteins of EGFR and Mitogen-Activated Protein Kinase signalization via monoclonal abs and specific inhibitors
• Figure 11.1. Transcriptional events in G1 phase of cell-cycle
• Figure 11.2. Tumor suppressor genes:
retinoblastoma and P53
• Figure 11.3. Regulation transcription factor of P53 I.
• Figure 11.4. Regulation transcription factor of P53 II.
• Figure 11.5. Primary structure of transcription factor p53
• Figure 11.6. Restoration of p53 function in tumor cells I.
• Figure 11.7. Restoration of p53 function in tumor cells II.
• Figure 11.8. Loss of p53 is observed in 50% of all human cancers
• Figure 11.9. Morphology of apoptosis
• Figure 11.10. Biochemical pathways of caspase activation dependent cell death
• Figure 11.11. Killing tumors by induction of apoptosis
• Figure 11.12. Cell death prevention after Stroke
• Figure 12.1. The basic concept of antisense activation
• Figure 12.2. Potential mechanisms of action of antisense oligonucleotides
• Figure 12.3. Stability, cellular uptake of antisense oligonucleotides, accessibility to the target
• Figure 12.4. Chemical modification of gene silencing oligonucleotides I.
• Figure 12.5. Chemical modification of gene silencing oligonucleotides II.
• Figure 12.6. Chemical modification of gene silencing oligonucleotides III.
• Figure 12.7. Chemical modification of gene silencing oligonucleotides IV.
• Figure 12.8. Chemical modification of gene silencing oligonucleotides V.
• Figure 12.9. Half lives of natural DNA, phosphorotioate (PS) and end-blocked oligonucleotides with 2‘-OCH3 or locked nucleotides (LNA in human serum
• Figure 12.10. Gene silencing in the laboratory for experimental purposes
• Figure 12.11. Schematic representation of triple helix
• Figure 12.12. A comparison of the anti-gene and anti-sense strategy
• Figure 12.13. Structure of parallel triplets
• Figure 12.14. Structure of antiparallel triplets
• Figure 12.15. General structures of ribozymes often utilized for gene silencing
• Figure 12.16. Merchanism of celf-splicing of the rRNA precursor of Tetrahymena
• Figure 12.17. Construction of hammerhead ribozymes against M1 RNA
• Figure 12.18. Group I intron ribozyme designed to bind and repear mutant p53
• Figure 12.19. Possible mechanisms of action A:
siRNA, B: mi RNA
• Figure 12.20. miRNA and siRNA pathways
• Figure 12.21. miRNA and siRNA biosynthetic pathway
• Figure 12.22. miRNA and siRNA pathways, and various methods to induce RNA interference
• Figure 12.23. Functionally active siRNA
• Figure 12.24. Roles of Ago proteins in gene silencing induced by siRNA and miRNA
• Figure 12.25. Plasmids expressing functional shRNA
• Figure 12.26. Action of shRNA-plasmid gene silencer
• Figure 12.27. Gene silencing with 21 nt long dsRNA oligos
• Figure 12.28. Lentiviral delivery of shRNA and its mode of action
Chapter 1. 1. Functional Genomics
1. 1.1 Definitions
Genomics means the study of genomes (the DNA comprising an organism) using the tools of bioinformatics.
The prerequisite of genomics is the accessibility of genome sequences in well annotated databases. This is static data: the genome sequence is not supposed to change (or changes very slowly) over time. Bioinformatics is the study of protein, genes, and genomes using computer algorithms and databases.
Functional genomics is investigating the correlations between genome and phenotype in:
• Normal and pathological conditions of an organism
• When the organism is responding to changes in the environment
• different organisms
The prerequisite of functional genomics was the development and application of global (genome-wide or system-wide) experimental approaches to assess gene function by making use of the information and reagents provided by structural genomics. It is characterized by high throughput or large-scale experimental methodologies combined with statistical or computational analysis of the results (Hieter and Boguski 1997).
Functional genomics as a means of assessing phenotype differs from more classical approaches primarily with respect to the scale and automation of biological investigations. A classical investigation of gene expression might examine how the expression of a single gene varies with the development of an organism in vivo. Modern functional genomics approaches, however, would examine how 1,000 to 10,000 genes are expressed as a function of development (UCDavis Genome Center)
2. 1.2 About diseases
Genetic variation is responsible for the adaptive changes that underlie evolution. Some of these changes improve the fitness of a species, while other changes are maladaptive. For the individual in a species, these maladaptive changes may represent disease, or elevated risk to disease development. From the molecular perspective we may talk about mutation and variation (characteristic to the individual, static), whereas from the medical perspective we distinguish healthy and pathological condition, which may change during the lifetime of the individual.
Previously, a large distinction was made between monogenic (single gene) and polygenic (complex) disorders.
They are now seen to be more on a continuum. We may define a single-gene disorder as a disorder that is caused primarily by mutation(s) in a single gene. However, all monogenic disorders involve altered functions of many genes. 90% of monogenic diseases appear by puberty, only 1% have onset after age 50. Diseases of complex origin tend to appear later; if the onset is early, the burden is greater. Examples are anomalies of development, early onset asthma, high blood pressure, cancer, diabetes, autism, obesity, osteoporosis. For complex disorders there is a gradient of phenotype in the affected population. Multiple genes are involved in the development of complex diseases, and the combination of specific sequence variants (sometimes including mutations as well) in those genes define the development and the severity of the disease. Complex diseases are non-Mendelian: they show familial aggregation, but not segregation. This means that they are heritable, but it is not easy to identify the responsible genes in pedigrees (e.g. by linkage analysis). Cancer is a special type of complex disease characterized by genetic instability. Thus, genetically cancer is characterized by multiple genetic (chromosomal) aberrations, inlcuding deletions, duplications, or rearrangements of chromosomal DNA.
Multiple genes are affected, and the unique combination of loss and gain of function aberrations leads to the manifestation of different types of cancers. Apart from familial cancer syndromes, genetic aberrations of tumor cells are not present in other cells of the body, and they are usually not heritable.
3. 1.3 Approaches to understanding disease
mechanisms
The usual approach to decipher monogenic diseases is using classical genetics and genomics, including linkage analysis, genome-wide association studies (GWAS), identification of chromosomal abnormalities and genomic DNA sequencing. The study of complex, multigenic diseases on the other hand requires utilization of functional genomics, genomics, genetics, molecular biology etc. Data from global analyses may identify targets for molecular therapy, which may be quite variable:
• Genes that cause disease (cardiovascular, diabetes, Alzheimer‘s)
• Interactions between genes and the environment that lead to chronic disease
• Various aspects of cancer: response to treatment, prognosis, recurrence
• Basic biological questions involving regulation of genes
3.1. 1.3.1 Gene expression is regulated in several basic ways
One of the most used functional genomics approaches is global gene expression analysis, since there is a good correlation between RNA expression patterns and expression levels and phenotype (disease). Gene expression microarrays are widely used for this purpose.
Figure 1.1. Figure 1.1. Global analysis of gene expression
3.2. 1.3.2 Microarrays: functional genomics in cancer research
Global gene expression analysis may contribute to personalized cancer medicine in several ways:
• It may help identify who is at risk (Prognosis)
• It may help identify who will and won‘t respond to each agent
• It may help identify alternatives for patients with chemo-resistant disease
• It may lead to better utilization of existing and new drugs, or development of strategies for unique combinations of drugs (lecture 2, slide 5).
3.3. 1.3.3 A Variety of Genetic Alterations Underlie Developmental
Abnormalities and Disease
In addition to gene expression analyses, global analysis of DNA sequence variations, mutations and larger chromosomal aberrations are equally important. In contrast to RNA, DNA is relatively robust and can be assayed specimens that have been treated in multiple ways, including archival tissue from hospital laboratories.
Global genomic analyses can be performed e.g. by genomic microarrays.
Figure 1.2. Figure 1.2. Mapping of genetic aberration
Figure 1.3. Figure 1.3. Different arrays for different purposes
3.4. 1.3.4 Genomic microarrays
Genomic microarray is a microarray technology that detects chromosomal abnormalities and/or sequence variations. In the clinical lab it is complementary to fluorescence in situ hybridization (FISH), although genomic microarrays provide information the a genome wide scale. In the research lab it helps the discovery of the genetic basis of diseases. Its significance lies in the fact that many disorders are likely to be caused by microdeletions and other chromosomal abnormalities that cannot be detected by FISH. SNP arrays may offer even more resolution, and additional information (both genotype and copy number).
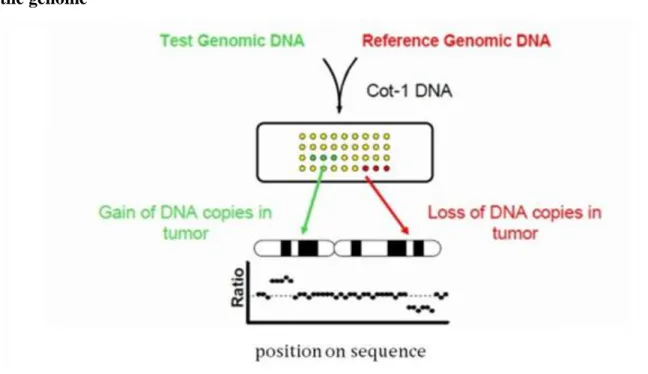
3.4.1. 1.3.4.1 Array based comparative genome hybridization (aCGH)
Figure 1.4. Figure 1.4. Array CGH maps DNA copy number, alteration to position in the genome
This technique measures the amount (copy number) of DNA, not RNA. It compares two samples: the ‗Test‘
sample and the ‗Reference‘ sample For instance, tumor copy number profiles are a reflection of two processes:
• Selection for alterations in gene expression that favor tumor development. Selective advantage to maintain set of aberrations.
• Mechanisms of genetic instability promoting changes in the genome. (Iinitiating oncogenetic event in murine models and methotrexate resistance in MMR deficient and proficient cell lines. aCGH aids cancer research in several ways :
• Based on the results better tests can be performed that measure the DNA copy number of oncogenes and TSGs.
• Monitor cancer progression and distinguish between mild and metastatic cancerous lesions using FISH (Fluorescence in situ hybridization) probes on regions of recurrent copy number aberrations in several tumor types.
• It can be used to reveal more regional copy number markers that can be used for cancer prediction.
• Identifying and understanding the genes that are involved in cancer will help to design therapeutic drugs that target the dysfunction genes and/or avoid therapies that cause tumor resistance.
Chapter 2. 2. Recombinant proteins
1. 2.1 Overview: Protein pharmaceuticals
Biotechnology have been used to make bioactive products for medical or research purposes for a long time. The biotechnology inductry have been hugels succesful in producing simpler, smaller molecules, such as antibiotics, but the mass production of human proteins (or even smaller peptides) proved to be significantly more complicated. Many hormones are in fact small peptides (calcitonin, oxytocin, vasopressin) and can be synthesized using the method developed by Bruce Merrifield in the sixties. Chemical peptide synthesis is very efficient (over 99% per bond), but that means that for even a short 50-amino acid peptide the overall yield will be 60.5%. Traditionally, human or animal proteins intended for medical purposes are isolated from natural sources, using complicated protein purification techniques. Human and animal tissues, including blood can be sued as natural source for several important proteins. 8-9% of blood consists of 10000 different proteins, although the bulk of this is really made up from about 20 major blood proteins. Blood clotting factors for the treatment of coagulation diseases were for a long time isolated from human blood using Cohn fractionation developed in 1946. A great advantage of proteins isolated from human blood is the species-identity, which prevents the mounting of immune response against the protein product, and the human proteins also carry all posttranslational modifications necessary for their biological activity. At the same time, there never is a sufficient supply of human blood, and any protein pharmaceuticals isolated from human or animal tissues may contain traces of infectious agents (known or unknown), and hazardous contaminants incompletely removed during purification. Recombinant DNA technology provides the means to produce human protein pharmaceuticals in simple organisms, utilizing well-established fermentation technologies. There are four general approaches to produce recombinant proteins:
1. Expression in cell-free systems (in vitro) 2. Expression in isolated cells (cell cultures) 3. Expression in transgenic plants/animals 4. Gene therapy in humans
During this lecture we will discuss the first two systems, comparing the advantages and disadvantages of the in vitro and cell culture systems, and their applications.
2. 2.2 Cell-free systems: In vitro transcription and translation
Cell-free systems are exceptionally useful for research purposes, but the low yields excludes their utilization for the mass production of proteins. There advantages over in vivo gene expression are:
• When the protein is: toxic to the host cell, insoluble or forms inclusion bodies, degraded rapidly by intracellular proteases
• Speed and directness of all procedures
• Absence of constraints from a living cell
• Pure product
Disadvantages over in vivo gene expression are:
• Lack of cellular membranes
• Lack of post translational modifications
Eukaryotic transcription in vivo is based on the specific interaction of several proteins, the DNA template and the newly produced RNA. The majority of the proteins are involved in regulation and posttrancriptional processing. Since the majority of these functions are not needed in an in vitro system, we can utilized the much
simpler transcriptional system of the bacteriophages. For this we need the phage RNA polymerase, nucleotides and the appropriate buffer.
On the other hand, eukaryotic translation requires ribosomes, tRNAs, amino acids, template RNA and a host of other proteins, not all well characterized. Therefore, in vitro translation systems are always provided as crude extract of cells.
Figure 2.1. Figure 2.1. Linearization of template
3. 2.3 Recombinant protein expression in isolated cells (cell culture)
The first step of recombinant protein expression is identification and cloning of its gene. This process is the subject of recombinant DNA technology, and will not be discussed in this lecture. A critical decision point is determining which expression system to use: in vitro or in vivo, and if in vivo, which species to choose.
Culturing and protein purification conditions are based on standard approaches, but always require empirical optimization. Initially prokaryotes were used to produce recombinant proteins - however, for larger proteins, or proteins with extensive posttranslational modifications eukaryotic sytems are better suited.
4. 2.4 Non-prokaryotic expression systems
4.1. 2.4.1 Cloning in Pichia pastoris
This system uses a special plasmid that works both in E. coli and yeast. Once the gene of interest is inserted into this plasmid, it must be linearized, then yeast cells are transfected with linear plasmid. Following transfection double cross-over recombination event occurs to cause the gene of interest to insert directly into P. pastoris chromosome where the old AOX gene used to be. From now on the gene of interest is under control of the powerful AOX promoter.
4.2. 2.4.2 Baculovirus mediated protein expression in insect cells
This system uses the Autographica californica multiple nuclear polyhedrosis virus (Baculovirus), which commonly infects insects cells of the alfalfa looper (small beetle) or armyworms (and their larvae). The system uses super-strong promoter from the polyhedrin coat protein to enhance expression of proteins while virus resides inside the insect cell - protein is not required for infection or viral life cycle. Secreted proteins better expressed by stably transfected insect cell lines, from the ie-1 promoter (infection interferes with secretory pathways).
Figure 2.2. Figure 2.2. Baculovirus/insect expression system
4.3. 2.4.3 Mammalian expression systems
In these systems the gene is initially cloned into plasmid, and propagated in bacterial cells, then the mammalian cells are transformed by electroporation (with linear plasmid) and the gene integrates (1 or more times) into random locations within different chromosomes. The cells are typically derived from the Chinese Hamster Ovary (CHO) cell line. Often, multiple rounds of growth and selection using methotrexate to select for those cells with highest expression and integration of DHFR and the gene of interest.
Figure 2.3. Figure 2.3. Methotrexate (MTX) selection
5. 2.5 Purification of recombinant proteins
Protein purification protocols produce proteins with variable purity - as always, therapeutical proteins have to be extremely pure. Steps of the purification strategies are based on different physicochemical properties of the proteins, such as size, charge, side chains, hydrophobicity. This requires several purification steps, lengthy optimization for ech protein, and sensitive and specific detection of the protein at each step. For recombinant proteins on the other hand, it is possible to attach a short protein sequence, a so called tag to the N or C terminal of the protein using recombinant DNA technology. The tags are designed to bind smaller molecules or metal ions with high affinity and specificity, and can greatly shorten and standardize the purification of a wide variety of proteins.
Figure 2.4. Figure 2.4. Conventional purufucation strategy
Chapter 3. 3. Gene Therapy: Vectors and Strategies.
Gene therapy is one of the key technologies of the twenty-first century. Hopes are high to find new treatments for cancer, AIDS, heart attack, stroke, and other common ailments.
1. 3.1 Vectors for Gene Therapy
The transfer of therapeutic genes into patient cells depends critically on the further development of in vivo gene transfer systems. Such vectors should have certain properties in order to deliver the gene efficiently to the target cell. They must be easy to produce and high titer preparations of vector particles should be reproducible. From a safety aspect, they should be non-toxic and should not elicit undesired effects such as immune reactions in the host. The therapeutic gene should be expressed persistently at a high level. Viral vectors should target defined types of cells or tissue and infect stationary as well as dividing cells, because most cells in an adult patient are in a postmitotic state. The insertion to the host genome must be specific in order to avoid insertional mutagenesis.
Specific insertion would render the repair of gene defects possible.
Figure 3.1. Figure 3.1. In vivo gene therapy
Figure 3.2. Figure 3.2. Ex vivo gene therapy
2. 3.2. Types of gene transfer, vectors for gene therapy
Over the past years, a wide range of vector systems of viral and nonviral origin have been developed. While methods such as the direct injection of naked plasmid DNA, gene transfer through a gene gun, or as liposome vesicle showed low transfection efficiency, experiments using viral vectors looked more promising.
Figure 3.3. Figure 3.3. Liposomes
Figure 3.4. Figure 3.4. Naked DNA
Figure 3.5. Figure 3.5. Gene particle bombardment
Genomes of retroviruses, adenoviruses and adeno-associated viruses (AAV) make up the bulk of the most frequently used viral vectors. Other, less commonly used viral vectors are derived from the Herpes simplex virus I (HSV-1), the baculovirus, and others. Viruses have evolved and adopted many properties of cells in the process, which enables them to identify target cells efficiently and penetrate them. They migrate from the cytoplasm to the nucleus to express their genes in the host cell. This viral life cycle enables infectious virions to transfer genetic information with great success.
Retroviral Vectors
Retroviruses are a large versatile group of viruses with a genome consisting of single or double-stranded RNA.
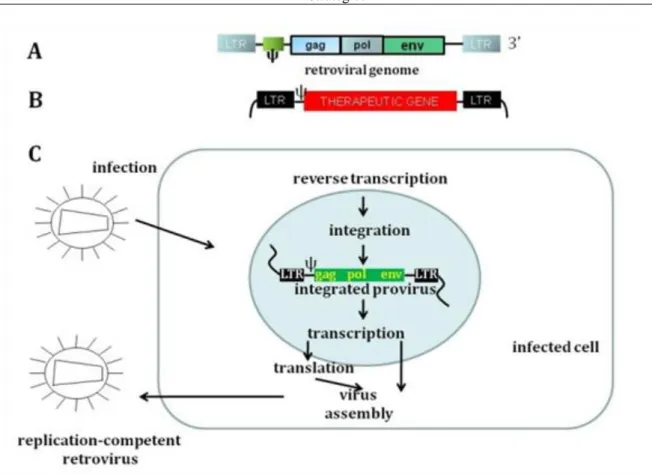
They have a diameter of about 100 nm and they are covered by an envelope. The envelope contains a viral glycoprotein which binds to cellular receptors, thus defining the specificity of the host and cell type that is infected. The envelope protein furthers fusion with a cellular surface membrane or with endosomal compartments inside the cell. Depending on the arrangement of their genome, retroviruses are divided into two categories, the simple and the complex retroviruses. All retroviruses contain three essential genes, gag, pol, and env. Gag codes for structural proteins that constitute the matrix, the capsid, and the nucleoprotein complex. Pol codes for reverse transcriptase and integrase, while env codes for the proteins of the envelope. There is also a psi packaging signal and two LTRs (long terminal repeats) with regulatory functions within the virus. The prototype for a simple retrovirus carrying only a small set of information is the Moloney murine leukemia virus (MoMLV). Complex retroviruses such as lentiviruses (e.g., the human immunodeficiency virus, HIV) contain additional regulatory and accessory genes. Initially, vectors for gene therapy were developed from simple retroviruses, very often MoMLV. In order to develop retroviral vectors, knowledge of the viral life cycle became fundamental. After the infection of the host cell, the viral RNA is reversely transcribed into linear double-stranded DNA by reverse transcriptase. This process takes place in the cytoplasm, and the viral DNA is then introduced into the nucleus followed by a stable insertion into the host genome.
Figure 3.6. Figure 3.6. Retrovirus
Figure 3.7. Figure 3.7. Life cycle of retroviruses
Figure 3.8. Figure 3.8. Moloney Murine Leukemia Virus Based Retroviral Vector I.
The mechanism by which retroviruses are introduced into the nucleus of the host cell differs between simple and complex retroviruses. Whereas simple retroviruses can only enter the nucleus where the nuclear membrane is being dissolved during the mitotic process, lentiviruses have a pre-integration complex that relies on an active cellular transport mechanism through the nuclear pore without destroying the nuclear membrane. Unlike MoMLV, lentiviruses are therefore able to transduce stationary host cells. Once the virus has entered the nucleus, the viral enzyme integrase initiates the integration of the viral DNA into the host genome. The integrated viral DNA is called a provirus. It limits expression of cellular genes and uses the host cell for viral gene expression. The transcriptional activity of the host is controlled by cis-acting proviral LTR regions.
Complex retroviruses have additional trans-acting factors that activate RNA transcription (e.g., HIV-1 tat). After the translation of the viral genes, the resulting protein products and the viral RNA form viral particles that are released from the cell via the cell membrane by budding.
Most retroviral vectors currently used in gene therapy studies are based on MoMLV, one of the first gene vehicles used in human gene therapy experiments. In order to produce viruses with a deficient replication mechanism that only replicate in the packaging cell and not in the host cell, the viral genes have been removed and replaced by a therapeutic gene. Gag, pol, and env are expressed in trans in the packaging cell. When the modified viral genome containing the therapeutic gene is transfected into the packaging cell, all required components are brought together to form a recombinant virus. This virus can transfect target cells, but is unable to form infectious particles because genes code for viral proteins are missing from its genome. This is a safety device often used in viral vectors. The viral genes responsible for the replication of the virus are separated from the rest of the genome, thus reducing the risk of a recombination of infectious particles.
Figure 3.9. Figure 3.9. Moloney Murine Leukemia Virus Based Retroviral Vector II.
Lentiviruses are a subfamily of retroviruses with all the advantages of retroviral constructs plus the ability to transduce also postmitotic cells and tissue, including neurons, retinal, muscle, and hematopoietic cells. Recently developed lentiviral vectors are largely based on the HIV genome. In order to avoid a recombination of infectious HIV particles, as many endogenous HIV proteins as possible have been deleted without reducing the transduction and expression rate. Furthermore, more recently developed vectors carry regulatory elements that have been added later. The cPPT (central polypurine tract) sequence facilitates the synthesis of the second strand and the transport of the pre-integration complex into the nucleus, while the WPRF (woodchuck hepatitis virus posttranscriptional regulatory element) sequence enhances the expression of the transgene via a higher efficiency of the transduction and translation processes. An additional mutation of the 3‘-LTRs results in self- inactivation (SIN), thus reducing the risk of a recombination of infectious HIV particles. In order to improve safety further, efficient vectors have been developed from lentiviruses that are not pathogenic to humans, but also have the ability to transduce stationary cells. The basic structure comes from, e.g., the monkey-specific simian immunodeficiency virus (SIV), the cat-specific feline immunodeficiency virus (FIV), or the horse- specific equine infectious anemia virus (EIAV). So far, most lentiviral vectors have been produced through transient transfection of packaging and vector plasmids. The cells used are the easily transfectable 293T cells, which yield titers between 1 x 10⁹ and 1 x 10¹⁰ infectious units per mL. The virus particles are further concentrated through ultracentrifugation. However, it is not easy to standardize virus production in transient infections. It would be an advantage to be able to develop stable production cells, especially in view of the use of HIV-based vectors in clinical trials, but the toxicity of the VSV-G envelope protein and of other lentiviral proteins such as Gag, and Tat is a major obstacle in the production of lentiviral packaging cell lines. It would be useful if these toxic proteins could be expressed in tetracyline-regulated systems, a strategy currently under investigation. The potential risk for the application of lentiviral vectors lies in the possibility of insertion mutagenesis and a strong tendency in retroviruses to recombine with infectious foreign retroviruses either within the transfected or the target cells. It is also possible that new viruses emerge through recombination with endogenous sequences. Thus, new infectious viruses with hitherto unknown properties could be spread by the use of retroviral vectors. These could not only affect other organs, but also the germ cells.
Figure 3.10. Figure 3.10. Retroviral gene therapy
Figure 3.11. Figure 3.11. Lentiviral vector
Adenoviral Vectors
Until recently, adenoviral viruses were very popular because they can be easily produced on an industrial scale, the virus titers are high and they can transfect stationary as well as dividing cells. The linear double-stranded DNA of adenoviruses codes for 11 proteins. The genome is packed into an icosahedral protein capsule, which is not surrounded by an envelope, but contains fiber envelope proteins. The fiber proteins combine with the surface receptors of the host cell to form a high-affinity complex. The endosomes are lysed by the adenoviral enzymes, but the genome is not inserted into the cell DNA and remains episomal. This results in a serial dilution of the adenoviral genome over several cell divisions. Unlike retroviruses, adenoviruses cannot be passed on via the germ line. Their high expression rate on a short-term basis makes them suitable for tumor treatment. Due to their wide host tropism adenoviral viruses are not restricted to one compartment but spread into surrounding tissue. This leads to toxic side effects particularly on the liver. Furthermore most patients have already been exposed to adenoviruses during their lifetime and thus developed antibodies, which makes therapeutically relevant target tissues such as the epithelium of the respiratory tract as well as various tumors refractory to an adenoviral infection. This could reduce the efficacy of adenoviral gene therapy. What is more, conventional
adenoviral vectors could elicit a strong immune reaction in the host mainly caused by the adenoviral E2 protein.
While such an inflammatory reaction might well have an antitumor effect, there is also a high safety risk as the death of a patient has demonstrated. The replication defect in first generation adenoviral vectors was the result of a deletion of the E1A and E1B genes. In some of these vectors, the E3 gene was also deleted in order to improve their uptake capacity. However, they retain the other early and late viral genes that are expressed in small quantities after infection. In second generation adenoviral viruses where the E2 and E4 regions have also been deleted, and only the late genes are retained. Viral gene products induce an immune response against the transduced cells, resulting in a reduced expression of the transgene. New strategies aim to completely avoid the immune response and to achieve a higher uptake capacity for foreign DNA in adenoviral viruses. This led to the development of adenoviral vectors in which all viral reading frames have been deleted. These are known as gutless vectors and contain only those viral DNA sequences that are active in cis and are essential for the replication and packaging of viral DNA, such as inverse terminal repeats (ITRs), which contain the polymerase binding sequence for the start of DNA replication and the DNA packaging signal pis. The original adenoviral gene region between the two ITRs has been replaced by foreign non-coding DNA. In recombinant vectors derived from gutless vectors, this space is partially taken by the transgene. Gutless vectors can only be produced with the assistance of a helper virus, which provides the proteins required for viral replication and packaging.
Figure 3.12. Figure 3.12. Adenoviruses
Figure 3.13. Figure 3.13. Evolution and adenoviral vectors
Figure 3.14. Figure 3.14. Adenoviral gene therapy
Adeno-Associated Virus (AAV)
The adeno-associated virus (AAV), member of the parvovirus family, is a new promising candidate for the transfer of genes. AAV has an icosahedral structure and contains a single-stranded DNA genome of only 4.7 kb.
It can only be replicated with the assistance of helper viruses such as adenoviruses or herpes viruses. Although a large proportion of the population is AAV-seropositive, so far no pathogenicity has been observed. In contrast to adenoviruses, AAV are only weakly immunogenic. They can infect dividing as well as stationary cells and integrate into the host genome, which is advantageous far long term expression. Wild type AAV contains no more than two genes, rep for replication and cap for encapsulation. The coding sequences are flanked by ITRs, which are needed for packaging DNA into capsids. In AAV vectors, the genes rep and cap have been replaced by a therapeutic gene. In order to produce a recombinant virus, the AAV genes and adenoviral helper genes are expressed in a packaging cell in trans. The major advantage of AAV-derived vectors is the ability to stably integrate into the target cell genome at a defined location in the chromosome. Location-specific insertion is mediated by a usually inactive 100 bp long region in the REP protein. However, since AAV vectors no longer contain the rep gene, targeted integration could only be detected using wild type AAV. Furthermore, since AAV is widespread among the human population, the question arises if the AAV-specific insertion location has been occupied by other genetic material. This would have to be removed first before an AAV vector could be used efficiently. It is also unclear what would happen if the insertion location of an AAV-derived vector were not available - whether sequence-independent insertion or even chromosomal relocation would take place. Another interesting property in AAV vectors derives from their specific chromosomal insertion: the capacity of homologous recombination. It was also possible to correct point mutations and deletions using an AAV vector, albeit at a very low frequency. This approach might also hold promising therapeutic possibilities.
Figure 3.15. Figure 3.15. Adeno-associated viruses
At this stage, the production of AAV vectors is still a major problem, being very difficult and time-consuming.
The rep gene and some of the adenoviral helper genes are cytotoxic to packaging cells, and there are no cell lines available for the large-scale production of pure recombinant viruses. Despite many limitations, AAV vectors are quite useful gene transfer systems, since they achieve excellent expression in muscle, brain, hematopoietic precursor cells, neurons, photoreceptor cells, and hepatocytes.
3. 3.3. General gene therapy strategies
Gene augmentation therapy (GAT). For diseases caused by loss of function of a gene, introducing extra copies of the normal gene may increase the amount of normal gene product to a level where the normal phenotype is restored. As a result GAT is targeted at clinical disorders where the pathogenesis is reversible. It also helps to have no precise requirement for expression levels of the introduced gene and a clinical response at low expression levels. GAT has been particularly applied to autosomal recessive disorders where even modest expression levels of an introduced gene may make a substantial difference. Dominantly inherited disorders are much less amenable to treatment: gain-of-function mutations are not treatable by this approach and, even if there is a loss-of-function mutation, high expression efficiency of the introduced gene is required: individuals with 50% of normal gene product are normally affected, and so the challenge is to increase the amount of gene product towards normal levels.
Figure 3.16. Figure 3.16. Gene therapy strategies I.
Figure 3.17. Figure 3.17. Gene therapy strategie II.
Figure 3.18. Figure 3.18. Gene therapy strategie III.
Targeted killing of specific cells. This general approach is popular in cancer gene therapies. Genes are directed to the target cells and then expressed so as to cause cell killing. Direct cell killing is possible if the inserted genes are expressed to produce a lethal toxin (suicide genes), or a gene encoding a prodrug is inserted, conferring susceptibility to killing by a subsequently administered drug. Alternatively, selectively lytic viruses can be used. Indirect cell killing uses immune-stimulatory genes to provoke or enhance an immune response against the target cell.
Targeted inhibition of gene expression. If disease cells display a novel gene product or inappropriate expression of a gene (as in the case of many cancers, infectious diseases, etc.), a variety of different systems can be used specifically to block the expression of a single gene at the DNA, RNA or protein levels. Allele-specific inhibition of expression may be possible in some cases, permitting therapies for some disorders resulting from dominant negative effects. (The example shows correction of a mutation in a mutant gene by homologous recombination, but mutation correction may also be possible at the RNA level. ODN, oligodeoxynucleotide;
TFO, triplex-forming oligonucleotide.)
Targeted mutation correction. If an inherited mutation produces a dominant-negative effect, gene augmentation is unlikely to help. Instead the resident mutation must be corrected. Because of practical difficulties, this approach has yet to be applied but, in principle, it can be done at different levels: at the gene level (e.g. by gene targeting methods based on homologous recombination); or at the RNA transcript level (e.g. by using particular types of therapeutic ribozymes or therapeutic RNA editing).
4. 3.4. Human gene therapy
Human gene therapy is a complex, multiphase process involving the identification of genes causing or related to disease, development, in vitro testing and manufacturing of the gene transfer vectors, preclinical testing and toxicology studies in animal models, and clinical development of gene therapy products through the three phases of clinical trials. Many metabolic diseases are potential candidates for treatment with gene therapy.
Candidate diseases include those caused by a single gene defect such as severe combined immunodeficiency (SCID) and familial hypercholesterolemia (FH), more complex multifactorial diseases, including diabetes mellitus and atherosclerosis, and acquired diseases like AIDS.
Figure 3.19. Figure 3.19. Severe combined immunodeficiency (SCID); lack of adenosine
deaminase (ADA)
Figure 3.20. Figure 3.20. Gene therapy for severe immunodeficiency synfrom I.
Figure 3.21. Figure 3.21. Gene therapy for severe immunodeficiency synfrom I.
The first phase 1 gene therapy clinical trial, which aimed to provide detailed information on the safety and feasibility of the gene therapy procedure, began in 1990 when a 4-year-old girl with SCID was injected with autologous T cells transduced ex vivo with a retroviral vector containing the human adenosine deaminase (ADA) cDNA. A 12-year follow-up study reported about that ten years after the last ex vivo transduced cell infusion, approximately 20 % of the patients lymphocytes still carry and express the retroviral gene; however, the expression was not considered sufficient to allow withdrawal of the supplementary PEG-ADA treatment.
Two other patients, treated with the same transduction protocol, developed precipitating antibodies against fetal bovine serum, present in the infused cell suspension. Antibodies to MMLV p30 core protein were also detected from the patients following the cell infusions. Subsequently, successful gene therapy after retroviral ex vivo gene transfer to the autologous hematopoietic stem cells of nine out of eleven infants with sustained (up to over four years) correction of SCID phenotype has been reported. Unfortunately, almost three years after completing therapy, two children developed T cell leukemia, possibly owing to insertional mutagenesis associated with retrovirally mediated gene transfer. Another adverse event, systemic inflammatory response syndrome, leading to the death of an 18-year old male who participated in a safety study of E1, E4 deleted Adenovirus-mediated gene transfer of human ornithine transcarbamoylase (OTC) into the right hepatic artery at high dose, has been reported in 2003.
Figure 3.22. Figure 3.22. Ornithine transcarbamoilase (OTC) deficiency
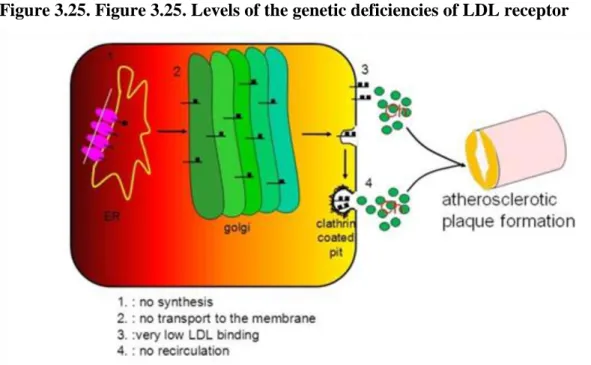
Genetic defects in the LDL receptor
Four classes of mutations that disrupt the structure and function of the LDL receptor and cause FH. Each class of mutation affects a different region in the gene and thus interferes with a different step in the process by which the receptor is synthesized, processed in the Golgi complex, and transported to coated pits. Class I Mutations: no receptors synthesized; Class II Mutations: receptor synthesized, but transported slowly from ER to Golgi; Class III Mutations: receptors processed and reach cell surface, but fail to bind LDL normally; Class IV Mutations:
receptors reach cell surface and bind LDL, but fail to cluster in coated pits.
Figure 3.23. Figure 3.23. Transports of lipids with plasma lipoproteins
Figure 3.24. Figure 3.24. Regulation of the mevalonate pathway
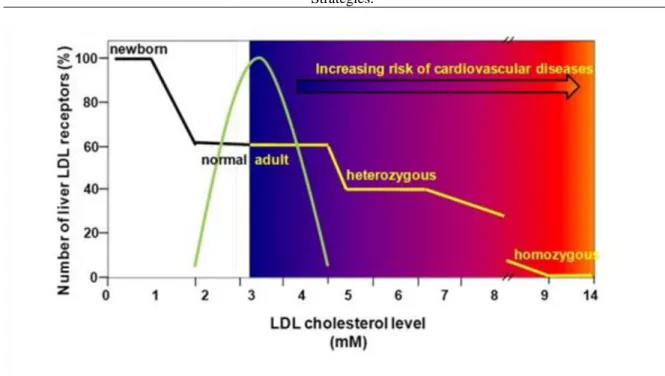
The therapeutic implications of the LDL receptor studies center on strategies for increasing the production of LDL receptors in the liver, thereby lowering plasma LDL-cholesterol levels. In FH heterozygotes this goal can be attained by stimulating the normal gene to produce more than its usual number of LDL receptors, thus
compensating for the defective allele. Inasmuch as the liver is the major site of expression of LDL receptors, the therapeutic problem is reduced to the development of methods to increase hepatic demands for cholesterol. This can be achieved by two techniques: 1) inhibition of the intestinal reabsorption of bile acids; and 2) inhibition of cholesterol synthesis. These techniques can be used alone or in combination. The liver requires cholesterol for conversion into bile acids, which constitute the major route by which cholesterol is excreted from the body.
However, only a fraction of the bile acids secreted by the liver actually leaves the body. The vast bulk of bile acids are reabsorbed in the terminal ileum and returned to the liver for reutilization. As a result, the liver converts only a minimal amount of cholesterol into bile acids. The liver‘s demand for cholesterol can be enhanced by the ingestion of resins that bind bile acids in the intestine and prevent their reabsorption. Since the liver can no longer re-use old bile acids, it must continually make new bile acids and the liver‘s demand for cholesterol increases. In order to obtain this cholesterol, the liver makes a dual response: 1) it synthesizes increased amounts of cholesterol through an increase in the activity of HMG-CoA reductase; and 2) it attempts to take up additional plasma cholesterol by increasing the production of LDL receptors. The increased LDL receptor activity causes plasma LDL levels to fall.