György Iván Neszmélyi
Taiwan’s New Southbound Policy and the Cross-Strait
Relations
Summary
Taiwan still faces the problem of identifying its relationship and developing its atti- tude within the Cross-Strait Relations, not only due to the well-known political consid- erations and diplomatic isolation, but also because it is widely perceptible that Taiwan- ese investors and the Taiwanese government are scared of the possible implications of a trade war between the USA and the People’s Republic of China (PRC, herein- after: Mainland China). Besides other reasons, this is the main motivation behind the sudden Taiwanese FDI divestment from Mainland China. This huge amount of capital, however, does not return to Taiwan to create new jobs and develop new, high value-added industries, rather it flows to Southeast Asia, an area still focusing on the low-cost labour-intensive manufacturing sector. Besides other, non-industrial fields, the present NPP-based Tsai administration fosters its New Southbound Policy (NSP), which is partially implemented under the umbrella of a special NGO, the Taiwan– Asia Exchange Foundation (TAEF). The 18 target countries of NSP comprise the complete ASEAN plus South Asia, Australia and New Zealand. However, among Taiwan’s target countries, the most intensive investment and trade relations are maintained with the ASEAN region (mostly Vietnam, Philippines, Thailand, Malaysia and Indonesia). The future might, however, bring about significant changes, as Mainland China has still been by far the biggest export market of Taiwan.
Journal of Economic Literature (JEL) codes: F16, R11, O53
Keywords: Taiwan, economy, New Southbound Policy, Cross-Strait Relations
György Iván Neszmélyi PhD, Professor, Budapest Business School – Uni- versity of Applied Sciences, Faculty of Commerce, Hospitality and Tourism (Neszmelyi.Gyorgy@uni-bge.hu).
Introduction – The antecedents and the objectives of the research
In 2017 the author spent two months with the research mobility fellowship of OBIC and made a thorough assessment of Taiwan’s developmental model, compared to South Korea, and discussed the constraints and endeavours to maintain Taiwan’s com- petitiveness, including its external economic activities, with focus on Cross-Strait Rela- tions and on the Taiwan–EU business and investment relations.
This research can be considered to directly follow from the above-mentioned pro- ject. The author also gives a brief insight into the current state of affairs and into the most recent developments of the Taiwanese economy in general, and then Taiwan’s external economic relations are discussed with special focus on regional endeavours, primarily the New Southbound Policy (NSP), proclaimed by the incumbent Taiwanese President, Tsai Ing-wen in 2016 and targeting the South and Southeast Asian regions, including Australia and New Zealand, with a view to providing Taiwan a regional alter- native against (or besides) Cross-Strait Relations. Tsai and the Democratic Progressive Party (DPP) focus on Taiwan’s identity (and avoid the use of the term “independ- ence”), and consider Taiwan’s overdependence on the excessive trade and investment relations with Mainland China as damaging, and consequently, the NSP-driven diver- sification as a security issue. It is different question that in the future further impetus might be given to NSP or eventually drop it, turn back to Taiwan’s “Chinese identity”
and further strengthen the Cross-Strait Relations.
Material and methods
This paper is based on both secondary and primary research. Secondary research principally includes a literature review (literature available in Taiwanese libraries, mainly at the National Taiwan University and at the Shih Chien University). The statis- tical data were collected from Taiwan, e.g. the Central Bank of the Republic of China, Taiwan (CBC), DGBAS (Treasury Department of the Ministry of Finance of Taiwan, Bureau of Trade, Statistical Office), the Directorate General of Customs, and the Fi- nance Ministry of Taiwan), from the Mainland Affairs Council (MAC) of the Republic of China and from international databases (CIA World Factbook, IMF). Mention must be made of the author’s previous fellowship in Taiwan, his monograph (Neszmélyi, 2017) and other publications of his, which also served as starting points for the cur- rent research.
The author spent another month in Taiwan in 2019, as a fellow of the Oriental Business and Innovation Centre (OBIC) of the Budapest Business School, and this gave him a very good opportunity to re-establish and enlarge his personal contacts and carry out discussions, like in-depth interviews with a number of academic profes- sionals and experts form the fields of business and administration (from Academia Sinica, Taiwan Institute of Economic Research, Shih Chien University, National Taipei University of Business, National Formosa University, CTBC Financial Holding and the
Hungarian Trade Office in Taipei). Hence, first-hand information and experiences contributed to the outcomes of this paper.
Taiwan’s current economic state and challenges General overview on Taiwan’s economy
Taiwan has a modern and developed economy with gradually shrinking government guidance of investment and foreign trade. Exports, led by electronics, machinery and petrochemicals provide the primary impetus to its economic development. This entails strong dependence on exports, which exposes the economy to fluctuations in world demand. Taiwan’s diplomatic isolation, low birth rate and rapidly ageing population are other major long-term challenges. In the period of the author’s fel- lowship (between 12 April and 12 May 2019), data for 2018 were still unavailable at the Central Bank of the Republic of China Taiwan (CBC), as the Annual Report for 2018 was foreseen in June, 2019. Chin-Long Yang, Governor of CBC pointed out, that 2017 had been a period of a steady global economic recovery and upswings in com- modity prices, and these combined to drive Taiwan’s export expansion, as domestic consumer spending continued to moderately grow. Against this backdrop, Taiwan’s economy grew at a faster pace at 2.86 per cent, the highest annual growth rate in three years. Meanwhile, inflation was mild as NT dollar appreciation helped alleviate imported inflationary pressures, and a weather-induced higher base effect held down food prices. Compared to the previous year, the consumer price index (CPI) rose by 0.62 per cent and the core CPI (excluding vegetable, fruit and energy prices) was up by 1.04 per cent (CBC, 2018).
According to the estimated data of The World Factbook of CIA (2019), Taiwan’s PPP-based GDP (purchasing power parity) was USD 1.189 trillion, GDP (at the official exchange rate) was USD 572.6 billion (2017), while real growth in GDP was 2.9 per cent (2017). The per capita GDP (PPP) was USD 50,500 (2017), while the ratio of gross national savings was 34.9 per cent of GDP (2017). In 2017, the contribution of sectors to GDP was as follows: agriculture (1.8 per cent), industry (36.0 per cent) and services (62.1 per cent). The main industries are: electronics, communications technological and information technological products, petroleum refining, chemicals, textiles, iron and steel, machinery, cement, food processing, vehicles, consumer products, and phar- maceuticals. In 2017, the labour force was estimated at 11.78 million, in the following breakdown per sector: agriculture (4.9 per cent), industry (35.9 per cent) and services (59.2 per cent). The unemployment rate was 3.8 per cent in 2017, 0.1 per cent lower than in 2016 and identical to the data recorded in 2015. In 2016, the Taiwanese public debt was 35.7 per cent of GDP (0.5 per cent lower than a year earlier), while in 2017 the budget had a 0.1 per cent deficit (as against 0.6 per cent in 2016). In 2017, the inflation rate (consumer price index) was 1.1 per cent (CIA, 2019).
Growth was steady, with external demand acting as the main driver. As the global economic expansion continued, the annual GDP growth rate rose to 2.86 per cent.
The overall balance of payments recorded a surplus of USD 12.467 billion, with a cur- rent account surplus and a net asset increase in the financial account. In terms of inflation, fuel and gas cost hikes in response to international energy price rises were partially offset by food price declines; the annual growth rate of the CPI averaged 0.62 per cent for the year as whole. Meanwhile, the unemployment rate went further down to 3.76 per cent, the lowest in 17 years. While domestic demand kept steady, stronger external demand drove the economic growth rate to climb from 1.41 per cent in 2016 to 2.86 per cent in 2017, the fastest pace in three years. In terms of GDP components by expenditure, exports registered faster growth on thriving trade activity, and imports increased along with greater domestic demand as well as export-driven demand; the net external demand contributed 2.02 percentage points to GDP growth, serving as the mainstay for economic growth in 2017. On the other hand, private consumption grew steadily amid improved employment conditions. However, this was partially offset by negative growth in private investment, as machinery equipment investment slowed in the second half of the year owing to a higher base effect. As a result, domestic demand contributed only 0.83 percentage points to GDP growth. The labour produc- tivity indices of the industrial sector and of manufacturing also grew, an in the average non-agricultural (industrial and services) sectors, monthly earnings per employee in- creased by 2.46 per cent year on year, reaching TWD 49,989. (The abbreviation TWD or NT$ means New Taiwanese Dollar, which is Taiwan’s official currency. In April and May 2019, USD 1 was equal to about TWD 30-31, and EUR 1 was around TWD 34).
For the year 2017, the unemployment rate in general exhibited a downward trend, except in February (due to a typical wave of post-Lunar New Year job switching) and in June to August (as new graduates enter the job market) when seasonal factors resulted in higher unemployment. For the year as a whole, the unemployment rate was 3.76 per cent, the lowest in 17 years. As labour market conditions improved, un- employment duration decreased by 0.85 weeks to 24.22 weeks. In terms of age, the unemployment duration of the age groups between 15-24 and 45-64 increased by 0.01 and 0.24 weeks to 19.92 and 26.32 weeks, respectively, while that in the age group of 25-44 decreased by 1.54 weeks to 25.47 weeks. The average number of the long-term unemployed (those who had been unemployed for 53 weeks or more) was 63 thou- sand persons, a decrease by six thousand persons on a year earlier. In terms of causes of unemployment, total unemployment in year 2017 was 443 thousand persons, a de- crease of 17 thousand persons or 3.52 per cent on the previous year, mainly because unemployment of experienced job seekers decreased by 12 thousand persons or 3.31 per cent (CBC, 2018).
The unity of the rapid and inductive interrelationship of the sciences and educa- tion and implementation (best practice) triangle will gain increasing importance in the future (Zéman, 2016). It must be emphasized that 60 per cent of college graduates in Taiwan are engineers, many of whom establish ventures and most of them become successful in the course of a few years (Chou, 2017). However, another study points out that in the labour market the young generation (20-24 years old people) nowa- days face even bigger difficulties than before (Hsu, 2015). In the course of the recent
decades, the labour market has undergone a thorough transformation, resulting new demand for both the demand and supply side (Erdeiné Késmárki-Gally, 2018). In Tai- wan one of the main problems in the labour market is the stagnation of salaries, which is an obstacle to Taiwan’s economic growth (Wang, 2015).
The main reasons of unemployment are shown in Chart 1.
Chart 1: The main reasons of unemployment in Taiwan (2016–2017)
% 2017 2016
Business Shrunk or Establishment
Closed
Not Satisfied with the Original Job
Seasonal or Temporary Work
Completed First-time
Job seekers 40
10 15 20 25 30 35
5
Source: CBC, 2018:26, based on data by DGBAS, Executive Yuan
It can be seen that both in 2016 and in 2017 the main cause was dissatisfaction with the original job, which further increased by 2017 relative to other factors calculated in the comparison.
Foreign trade and investment
In 2017, Taiwan’s external trade gathered steam amid a robust recovery in the global economy, while domestic demand witnessed a mild expansion. Private consumption rose at a steady pace, and despite a slight contraction seen in private investment, investments by the government and by public enterprises both exhibited positive growth. For the year as a whole, real GDP expanded at an annual growth rate of 2.86 per cent, higher than the 1.41 per cent in the previous year (CBC, 2018).
In 2017, the total exports of Taiwan amounted to USD 349.8 (in 2016: USD 310.4 billion), while the total amount of imports was USD 269 billion in 2017 (USD 239.3 billion in 2016) (CIA, 2019).
The main export commodities are: semiconductors, petrochemicals, automobile/
auto parts, ships, wireless communication equipment, flat displays, steel, electronics, plastics, computers, while the main items of imports: oil/petroleum, semiconductors, natural gas, coal, steel, computers, wireless communication equipment, automobiles, fine chemicals, textiles. Taiwan has the sixth biggest reserves of foreign exchange and gold the total amount of which was estimated USD 456.7 billion (on December 31, 2017), while a year earlier it was USD 439 billion. Taiwan’s total amount of external debt was estimated at USD 181.9 billion (on 31 December, 2017) while one year be- fore it was USD 172.2 billion (CIA, 2019).
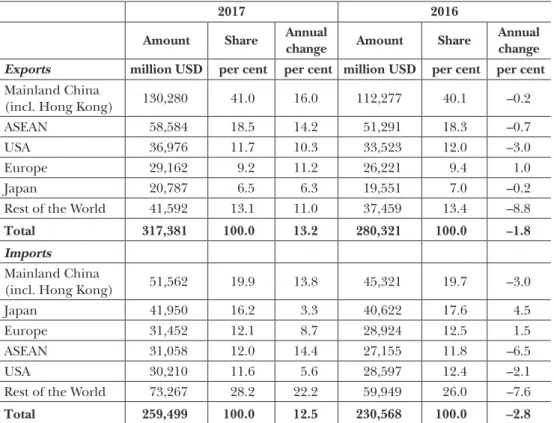
According to customs statistics, the value of exports increased by 13.2 per cent to USD 317,381 million on free on board (FOB) parity, and the value of imports in- creased by 12.5 per cent to USD 259,499 million on CIF (cost, insurance, and freight) basis. The biggest trading partners of Taiwan in 2017 were Mainland China including Hong Kong, ASEAN, the USA, Europe and Japan. In terms of Taiwan’s trade with Mainland China, the value of exports amounted to USD 130,280 million in 2017, 16.0 per cent higher than in 2016. As a manufacturing hub of the world, Mainland China remained Taiwan’s biggest export market, with the share of total exports increased to 41.0 per cent in 2017. Of all major export products, parts of electronic products (especially integrated circuits) maintained their leading roles, contributing 7.8 per- centage points to the growth in Taiwan’s exports to Mainland China. Imports from Mainland China increased by 13.8 per cent to USD 51,562 million in 2017. With a ra- tio of 19.9 per cent, Mainland China continued to be Taiwan’s largest import partner.
The trade surplus with Mainland China increased to USD 78,718 million in 2017. As a result, Mainland China remained the largest source of Taiwan’s trade surplus. Exports to the ASEAN economies increased by 14.2 per cent to USD 58,584 million in 2017, with a combined share of 18.5 per cent. Import from these countries increased by 14.4 per cent to USD 31,058 million, representing a share of 12.0 per cent of total imports.
The bilateral trade between Taiwan and the ASEAN heated up, and the exports and imports of parts of electronic products increased greatly. In sum, the trade surplus with the ASEAN increased to USD 27,526 million, with Singapore, Vietnam, and the Philippines being the second, third, and fourth largest sources of Taiwan’s trade sur- plus, respectively. Exports to the US grew by 10.3 per cent to USD 36,976 million, though comprising a smaller share of 11.7 per cent in Taiwan’s total exports on a year earlier. Encouraged by bigger consumer demand for newer models of gaming laptops and commercial computers, information, communication and audio-video products exported to the US increased by 16.8 per cent over the previous year. Imports from the US rose by 5.6 per cent to USD 30,210 million, but its share in total imports fell to 11.6 per cent. The trade surplus with the US, Taiwan’s fifth largest surplus source, increased to USD 6,766 million. Europe’s gradual recovery combined with a stronger euro, allowed Taiwanese exports to Europe to increase by 11.2 per cent to USD 29,162 million, yet its share of total exports declined to 9.2 per cent. Taiwanese exports of machinery and base metals soared especially well among major products, growing by 22.5 per cent and 16.1 per cent from a year earlier, respectively. Taiwan’s import
from Europe increased by 8.7 per cent to USD 31,452 million, though its share of total imports decreased to 12.1 per cent. Consequently, Taiwan’s trade deficit with Europe shrank to USD 2,290 million in 2017. Taiwan’s exports to Japan increased by 6.3 per cent to USD 20,787 million, with its share declining to 6.5 per cent (exports of machinery and base metals made the biggest contribution to total exports). Taiwan’s import from Japan increased by 3.3 per cent to USD 41,950 million, and its share dropped to 16.2 per cent of the total imports. Japan remained Taiwan’s second largest source of imports in 2017. In sum, the trade deficit to Japan increased to USD 21,163 million per year (CBC, 2018). The main trading partners of Taiwan in 2017 and 2016 can be seen in Table 1.
Table 1: Taiwan’s trade of goods by country in 2016 and 2017
2017 2016
Amount Share Annual
change Amount Share Annual change Exports million USD per cent per cent million USD per cent per cent Mainland China
(incl. Hong Kong) 130,280 41.0 16.0 112,277 40.1 –0.2
ASEAN 58,584 18.5 14.2 51,291 18.3 –0.7
USA 36,976 11.7 10.3 33,523 12.0 –3.0
Europe 29,162 9.2 11.2 26,221 9.4 1.0
Japan 20,787 6.5 6.3 19,551 7.0 –0.2
Rest of the World 41,592 13.1 11.0 37,459 13.4 –8.8
Total 317,381 100.0 13.2 280,321 100.0 –1.8
Imports
Mainland China
(incl. Hong Kong) 51,562 19.9 13.8 45,321 19.7 –3.0
Japan 41,950 16.2 3.3 40,622 17.6 4.5
Europe 31,452 12.1 8.7 28,924 12.5 1.5
ASEAN 31,058 12.0 14.4 27,155 11.8 –6.5
USA 30,210 11.6 5.6 28,597 12.4 –2.1
Rest of the World 73,267 28.2 22.2 59,949 26.0 –7.6
Total 259,499 100.0 12.5 230,568 100.0 –2.8
Source: The author’s editing from CBC, 2018:16 (on the basis of Monthly Statistics of Exports and Im- ports, Ministry of Finance of Taiwan)
The most recent traits in the Taiwanese economy
According to the recent survey and forecast of the Taiwan Institute of Economic Re- search (TIER), published in April 2019, global demand has turned weaker, therefore the major central banks in the world simultaneously conduct looser monetary opera-
tions. Both of the most recently published composite indicators for manufacturing and service go up due to more promising domestic investment activities despite of de- teriorating global economic conditions. As a result, it is predicted that Taiwan’s GDP will grow by 2.12 per cent in 2019 (the same as it was stated in its previous forecast). In March 2019, Taiwan’s exports decreased by 4.36 per cent on a year earlier, represent- ing a decrease for 5 consecutive months. In March 2019, Taiwan’s imports increased by 6.62 per cent on a year earlier. On a cumulated basis, between January and the end of March this year exports and imports yielded a trade surplus of USD 8.96 billion or decreased by 23.75 per cent year on year. The CPI increased by 0.58 per cent in March 2019 relative to the same month of the previous year. The core inflation rate, excluding energy prices and food grew by 0.47 per cent in March 2019. In addition, the wholesale price index (WPI) moved up by 1.19 per cent in March 2019 year on year. As for the exchange rate, similarly to all other major currencies in the world, the NTD became slightly weaker due to the strengthening of the USD. The NTD/USD rate stood at 30.825 in late March 2019, indicating 0.16 per cent depreciation. The interest rate remained low and steady in March 2019 due to the continued loose mon- etary operations by the CBC with respect to the most recent CPI reading and potential global uncertainties; the lowest and highest over-night call rate in March 2019 stood at 0.174 per cent and 0.186 per cent, respectively (TIER, 2019).
The ratio of manufacturing firms which considered business to be better than expected in March 2019 was 46.5 per cent, representing an increase by 35.0 percent- age points compared to respondents who perceived better business in the previous month. The ratio of those who perceived business getting worse in March 2019 was 11.6 per cent, down 38.5 per cent on the 50.1 per cent expecting worse business in the previous month (February 2019). The ratio of manufacturing companies that thought business had remained unchanged in March 2019 was 41.9 per cent or in- creased by 3.5 percentage points compared to 38.4 per cent perceiving constant busi- ness in the previous month. Altogether, manufacturing firms were more optimistic about business in March 2019 than in the previous month. However, the actual reason was the higher number of working days in March than in February due to the lunar New Year holiday. In addition, the ratio of manufacturers who were of the opinion that business would be better in the following six months (between April and Sep- tember, 2019) was 32.8 per cent in the target month or decreased by 12.8 percentage points on the 45.6 per cent who felt more optimistic about the future in the previous month. The ratio of firms that perceived the economic outlook would be worsening was 15.5 per cent, representing an increase by 6.2 percentage points compared to the 9.3 per cent feeling rather pessimistic about the future in the previous month.
The ratio of manufacturing companies which perceived that business would remain unchanged in the next six months (between April and September 2019) stood at 51.7 per cent, an increase by 6.6 percentage points compared to the 45.1 per cent who felt neutral about the business outlook one month earlier. After all, manufacturing firms were more pessimistic about business in the near future than in the preceding month (i.e. February, 2019) (TIER, 2019).
The Manufacturing Composite Index for March 2019, adjusted for seasonal fac- tors on a moving average, saw an upward correction: from a revision of 91.23 points in February 2019 it increased to 95.93 points. Chart 1 shows an increase by 4.70 points, which is an increase for the fourth month in a row. The TIER Service Sector Com- posite Index for March 2019 adjusted for seasonal factors on a moving average, also saw an upward correction from a revision of 91.25 points in February 2019 to 96.76 points. Chart 2 shows an increase of 5.51 points, the first increase after a one-month drop. In addition, the TIER construction sector composite indicator for March 2019, adjusted for seasonal factors on a moving average, saw a downward correction: from a revision of 94.13 points in February 2019 to 91.18 points. Chart 2 shows a decrease of 2.95 points, the first decrease after a one-month rise (TIER, 2019).
Chart 2: TIER Business Composite Index of the Taiwanese economy
Manufacturing 95.93(2019/03) +4.70 Service 96.76(2019/03) +5.51 Construction 91.78(2019/03) –2.95 2006=100
2014 15 16 17 18
Source: TIER, 2019:6, (March)
The TIER economic survey forecasts lower economic growth for the first half of 2019, and a more rapid GDP growth for 2019 Q3 and Q4, reaching 2.51 per cent by the end of the year (see Table 2).
Lin1 highlighted that as the Taiwanese capital returning from Mainland China seeks fast and high return, it goes either to the real estate market or abroad again.
Two factors contribute to this phenomenon. In Taiwan, real estate prices are extreme- ly high while the property tax is low compared to the United States and to several European countries, where it is around 1 per cent against Taiwan, where it is only around 0.1 percent. (It cannot enter the real estate market in Mainland China, as there is no property there, people may only obtain the right of using a property for 70 years). The other factor is that in other countries, like in Southeast Asia, economic
growth is faster, while the wage level remains considerably lower than in Taiwan: Viet- nam, the Philippines and other states provide Taiwanese investors with higher profits.
Moreover, the government supports this under the auspices of the New Southbound Policy. For this reason, it is not surprising that the Taiwanese capital does not flow into Taiwanese manufacturing or into services, which results in the scarcity of jobs and preserves the relatively high but permanently stable wage level. Stringent wages tend to freeze domestic savings as well (Sági–Sóvágó, 2002), which may, in turn, influence market agents in their investments (Sági, 2007). Taiwan’s domestic financial market is very strictly regulated, and this is one more reason why capital still flows out, rather to or through Hong Kong or Singapore (Lin, 2019).
Chung2 underlined the fact that that Taiwan is in scarcity of most production fac- tors (land, energy, raw materials, labour, etc.), this is the reason why Taiwanese capital – returning from Mainland China – goes rather to Southeast Asia, then to the domes- tic industry. This looks to be a general phenomenon that capital has no “national emotions” and goes where the return/profit is the highest, but the situation is more complex. The labour-intensive manufacturing industry, which is principally based on low-cost labour, has no way and reason to be further developed in Taiwan, where wages are significantly higher than in most of the Southeast Asian countries. Taiwan’s government offers special incentives to develop Taiwan’s knowledge-intensive sectors, like the “green industries”. There are projects for sustainable power generation (like coastal powerhouses using the wave-energy of the ocean, projects many foreign com- panies seek to join (Chung, 2019).
The New Southbound Policy and its implications The global and domestic circumstances of Taiwan’s economy have undergone rapid changes in recent years. Mainland China faces a number of difficulties after three decades of rapid and uninterrupted economic development, such as industrial structural transformation, adjustments in laws and institutions, a sharp increase in production costs, and a slowdown in economic growth. At the same time the most prominent Southeast and South Asian economies have still continued to grow, and their consumers’ purchasing power has also been increasing. These countries also actively participate in regional economic integrations with a view to improving their companies’ competitiveness and to achieving even better business opportunities. This region has emerged as one of the present – and future – locomotives of the global economy. The aggregate GDP of the 10 members of the Association of Southeast Asian Nations (ASEAN), having a population of approximately 620 million, is USD 2.4 trillion. Moreover, the six South Asian countries (India, Pakistan, Bangladesh, Sri Lanka, Nepal, and Bhutan) have a total population of nearly 1.7 billion and their GDP amounted to USD 2.7 trillion. According to Global Insight forecasts, the average annual economic growth rates for the ASEAN and South Asian countries would reach 4.9 per cent and 7.4 per cent, respectively, between 2017 and 2021. This is consider- ably higher than the 3.1 per cent global economic average growth rate. As a result of
Table 2: Taiwan’s economic forecast for 2019 (TWD 100 million, Chained [2011], USD)
2019 2019
Q1 Q2 Q3 Q4 Total
GDP 40,961 42,034 43,722 44,971 171,688
Real GDP (%) 1.80 1.85 2.30 2.51 2.12
Private Consumption 23,559 23,353 23,820 23,798 94,530
Private Consumption (%) 2.15 2.20 2.40 2.43 2.30
Gov’t Consumption 5,452 5,864 6,186 6,736 24,238
Gov’t Consumption (%) –2.55 –3.32 3.40 2.03 –0.03
Fixed Capital Formation 9,153 9,486 10,308 10,206 39,153
Fixed Capital Formation (%) 3.78 6.15 4.09 7.40 5.36
Gov’t Investment 922 1,230 1,343 1,928 5,422
Gov’t Investment (%) 8.59 11.92 12.02 13.62 11.96
Public Enter. Invest. 353 566 545 965 2,429
Public Enter. Invest. (%) 7.24 17.42 7.92 4.92 8.63
Private Investment 7,878 7,690 8,422 7,313 31,304
Private Investment (%) 3.20 4.60 2.80 6.10 4.10
Exports, goods + services
(USD 0.1 billion) 30,480 31,697 34,415 35,725 132,318
Exports, goods +services (%) 0.30 1.70 2.95 3.15 2.08
Imports, goods +services
(USD 0.1 billion) 28,229 28,615 31,300 31,865 120,009
Imports, goods +services (%) 1.45 2.40 3.25 3.75 2.75
Exports, goods (USD 0.1 billion) 764 832 883 892 3,371
Exports, % Growth, yoy –4.19 –1.05 2.40 3.90 0.36
Imports, goods (USD 0.1 billion) 674 708 759 754 2,895
Imports, % Growth, yoy –0.81 0.80 1.20 3.06 1.10
Trade surplus (USD 0.1 billion) 90 124 125 138 476
CPI 101.85 102.34 103.35 103.63 102.79
CPI (%) 0.33 0.45 0.85 1.55 0.80
WPI 102.67 104.49 106.53 105.80 104.87
WPI (%) 0.72 0.20 –0.30 0.60 0.30
Exchange rate (TWD/USD) 30.83 30.85 30.83 30.70 30.80
Source: TIER, 2019
this spectacular growth, in these countries a new middle class will emerge with higher purchasing power, which means excellent business opportunities even for Taiwanese companies. Taiwan is entering a critical period of industrial transformation and struc- tural adjustment, with the wage growth still remaining stable. Although Taiwan previ- ously maintained trade and economic relations with many emerging markets in Asia, most of them were based on export processing and related investment, not on the
local markets. Furthermore, the majority of the exported manufactured goods had little value added. As Taiwan faces difficulties in participating in regional economic integrations, its export items are only affected by tariffs and trade barriers, all these problems mean a significant constraint for Taiwan to foster its exports and economic growth. Another problem is that Taiwan also has a high concentration of trade and outbound investment in mainland China, which means potential risks to Taiwan’s economy and security (An Introductory Guide, 2017).
Lőrincz (2019) underlines that Taiwan has nearly reached a stalemate in the Cross- Strait Relations, and therefore breaking out of diplomatic isolation clearly seems to be an abortive attempt. In the recent years additional 2-3 countries have left the “pri- vate club” of countries which still recognize Taiwan as an independent country. The tiny state of Eswatini (Swaziland) remained the only one in the African continent and not a single significant economic and political power can be found among the other ones (the Holy See, Kiribati, Marshall Islands, Nauru, Palau, Solomon Islands, Tuvalu, Haiti, Saint Kitts and Nevis, Saint Lucia, Saint Vincent and the Grenadines, Belize, Guatemala, Honduras, Nicaragua, Paraguay). Other attempts to get admitted into international organizations, like the World Health Organization (WHO) of the United Nations, have also failed. But, on the other hand, based on the robust exports, the Taiwanese economy works well, and as from the perspective of the Southeast Asian countries, Taiwan seems to be a success story, a developed and rich economy, it is a promising partner for co-operation. For many ASEAN citizens, Taiwan provides livelihood, as they were allowed to enter and stay as guest workers (several hundred thousand people from the ASEAN region, mainly from the Philippines, Indonesia and Vietnam). The Taiwanese environment is friendly to them, there is no discrimi- nation against foreigners, against Muslims, and there are no anti-migrant rallies etc.
(Lőrincz, 2019).
Under these circumstances, it is not surprising that Taiwan needed a firm diver- sification in its strategy for economic and foreign relations. The most logical choice was to diversify these relations by intensifying co-operation in the Asia-Pacific region, which is in the direct geographical proximity of Taiwan. In her inaugural speech made in 2016, the Taiwanese President Tsai Ing-wen emphasized the significance of the New Southbound Policy to improve Taiwan’s stance and versatility in the interna- tional economy, pointing out that Taiwan should give up reliance on a single market (Mainland China), and should re-establish and intensify ties with other Asian econo- mies. Taiwan’s trade ties with the ASEAN countries have gained rapid traction in re- cent years. Exports to the region reached USD 32.90 billion in the first seven months of 2017, an increase of 14.73 percent from the same period last year. Outbound ship- ments to South Asia totalled above USD 2.9 billion in the first 7 months, risen by 10.29 percent on a year earlier and having reversed a decline by 3.87 percent for the entire year of 2016. Taiwanese firms have made hefty investments in the region, with Taiwan- ese direct investments adding up to USD 97 billion, according to official government tallies. Taiwan’s key economic strengths include advanced technology, talented peo- ple and a diversified culture, and the New Southbound Policy consequently intends
to promote co-operation with the target countries in fields such as medical care, edu- cation, technology, agriculture, and tourism. With a high degree of complementarity between Taiwan and the partner countries, the government has encouraged supply chain integration in such sectors as information and communications technology (ICT), industries driven by domestic demand, energy and petrochemicals, agricul- ture, and financial services. An example is MediaTek Inc, the world’s top contract chip designer, with its headquarters in Hsinchu, Taiwan. In December 2019, MediaTek in- vited 42 executives and senior engineers from Indian smartphone vendors, including Micromax Informatics Ltd, to take part in a six-week handset hardware design devel- opment program in Taiwan. The program made a substantial contribution to helping India (An Introductory Guide, 2017).
Main targets: the emerging South and Southeast Asian countries
Despite the recent financial crisis in the Far East, the ASEAN region has managed to hold its position as one of the most rapidly developing regions in the world economy.
The member states express keen interest in broadening the forms of co-operation with one another. In January, 1992 ASEAN announced the future development of AFTA (ASEAN Free Trade Area) for the period between 1993 and 2008, with the gradual phasing out of customs restrictions within the Association. In 1995 the dead- line for the completion of AFTA was brought forward to 2003. In the course of the half-century history of the Association, ASEAN members have been among the most spectacularly developing countries in the world. According to competent analysts, the economy has been continuing to grow rapidly in the forthcoming years (see Table 3).
The member countries in total represent a population of 622 million people, which – in case of the continuation of the economic growth and increasing incomes – may expect considerable growth in their consumption for the coming decades. In terms of population, ASEAN is bigger than the European Union or the United States; it is the 3rd largest market in the world, behind only India and China. ASEAN is a fast growing and promising region. Its total trade increased by nearly USD 1 trillion between 2007 and 2014, with intra-ASEAN trade comprising the largest share of ASEAN’s total trade by partner. ASEAN attracted USD 136 billion in FDI in 2014, accounting for 11 per cent of global FDI inflows, up from only 5 per cent in 2007 (Neszmélyi–Kozár, 2018).
The most recent milestone in the economic integration process of Southeast Asia was formal establishment of the ASEAN Economic Community (AEC) on 31st Decem- ber 2015 which was built on four interrelated and mutually-reinforcing characteristics:
(a) a single market and production base, (b) a highly competitive economic region, (c) a region of equitable economic development, and (d) a region fully integrated into the global economy. ASEAN is nowadays is a highly competitive economic region in the world with a combined GDP of USD 2.6 trillion in 2014, ASEAN economy was 7th largest in the world and the 3rd largest in Asia. The formal establishment of the AEC in 2015 is not a static end goal, but a dynamic process that requires continuous reinvention of the region to maintain its relevance in an evolving global economy.
The agenda “AEC Blueprint 2025” has therefore been adopted in order to guide ASEAN economic integration between 2016 and 2025 (AEC, 2015).
Bagla3 underlined, that India is the world largest recipient of foreign investments and has the world’s highest rate of economic growth. India has a huge and young population. In the future these young India and will provide the momentum for in- novation. This offers great opportunity and a huge market for IT business, which will continue to carry out innovation. In this respect, it can be predicted that Taiwanese investment in India will continue to grow (TAEF, 2019).
Table 3: Real GDP Growth in Southeast Asia, China and India. Annual percentage change
2017 2018 2019 2019–23
(average) 2012–16 (average)
Indonesia 5.1 5.2 5.2 5.3 5.3
Malaysia 5.9 4.9 4.8 4.6 5.1
Philippines 6.7 6.4 6.5 6.6 6.6
Thailand 3.9 4.5 4.1 3.7 3.4
Vietnam 6.8 6.9 6.7 6.5 5.9
Brunei 1.3 2.0 2.3 2.0 –1.3
Singapore 3.6 3.5 2.9 2.7 3.5
Cambodia 7.0 7.0 6.9 6.9 7.1
Laos 6.9 6.6 6.8 7.0 7.6
Myanmar 6.8 6.6 6.9 7.0 7.3
China 6.9 6.6 6.3 5.9 7.3
India 6.7 7.5 7.3 7.3 6.9
Average of ASEAN-10 5.3 5.3 5.2 5.2 5.1
Average of Emerging Asia 6.5 6.6 6.3 6.1 6.8
Source: OECD, 2018:1
Taiwan and the Southeast-Asian countries
Taiwan has developed close ties with Southeast Asian countries over the past three decades. The interconnected trade and investment flows have formed deep economic interdependence and de facto integration in the region. The trend of Taiwanese en- terprises relocating from China to Southeast Asia has been observed since the late 2000s. This explains the economic considerations and rationale behind the New Southbound Policy (Hsu, 2017).
Yang (2017) reiterated that the relationship between Taiwan and Asian countries has been is undergoing structural change that derives from the continuous bilateral interaction since the 1970s. The internal driving force behind these relationships on Taiwanese side is the Taiwan government’s foreign policies and their impact on the private sector’s capacity to expand the global and regional industrial chain and invest-
ment network. The Taiwanese government has launched a number of regional initia- tives with the view of fostering the regional strategic, economic, and trade relations in the Asia-Pacific area, which would bring about constructive partnerships for Taiwan while creating mutual understanding with its neighbours as well. In the 1990s, Presi- dent Lee Teng-hui announced his Go South Policy which led to Taiwanese state-owned enterprises (SOE) investing in Southeast Asia and encouraged domestic small and medium-sized enterprises (SMEs) to look for business opportunities in the region.
Its continuation was the No. 2 phase of Go South supported by President Chen Shui- bian, during the 2000s when Taiwan adopted a “balanced westward” approach to regional investment and trade strategy (Yang, 2017).
Hsiao4 (2019) confirmed that Taiwan’s government proclaimed its original South- bound Policy (Go South) in 1994, since then the above-mentioned two phases were implemented before 2016 when the Tsai-administration launched its third Step, the New Southbound Policy with the view of expanding relations with Southeast Asian countries, Australia and New Zealand. While many countries in the region have start- ed similar programmes (South Korea has its own NSP, India has a Go East policy, etc.), in case of Taiwan it is unique that the program is implemented like a PPP (Public-Pri- vate Partnership). Due to the diplomatic isolation the Taiwanese government has very limited possibilities to act directly abroad, however its role is in rendering financial instruments to the investment projects. The second “P” means a non-governmental organization (NGO) – the Taiwan-Asia Exchange Foundation (TAEF) – that acts as an umbrella organization that takes care of projects in various fields, like co-operation in health, agricultural, education and cultural and youth exchanges. An additional – and important – field of co-operation is resilience and post-disaster resilience (like earthquakes) (Hsiao, 2019).
The Taiwan-Asia Exchange Foundation (TAEF) was established in 2018 as the first policy-oriented think tank in Taiwan with a focus on Southeast Asian and South Asian region. Under the auspices of the New Southbound Policy (NSP), the goal of the TAEF is to promote comprehensive ties between Taiwan and the 10 ASEAN coun- tries, 6 South Asian states, as well as Australia and New Zealand through co-operation and exchanges in three major fields – including think tanks, non-governmental or- ganizations (NGOs) and young leaders – to consolidate a sense of regional com- munity in Asia and establish long-term co-operative partnerships. TAEF is devoted to building new mechanisms for regional co-operation among Asian societies. It is our goal to cultivate common policy blueprints for Taiwan, ASEAN and South Asian countries through frequent regional dialogue, while also highlighting Taiwan’s com- mitment and contributions towards Asia’s development through concrete initiatives for co-operation. In addition, the TAEF hosts various international conferences – in- cluding the Yushan Forum: Asian Dialogue for Innovation and Progress – with the aim of strengthening ties with New Southbound Policy partner states and societies, while also inviting other like-minded countries to participate in regional dialogue.
TAEF has a three-bounded mission in terms of expanding Taiwan’s regional relation- ships as follows:
– Fostering think tank co-operation by building domestic and international think tank networks to increase capabilities on academic co-operation, encourage interna- tional exchange, and promote the New Southbound Policy.
– Supporting civil society partnerships by launching the “Asian Double Helix Ini- tiative” on regional youth leadership; encouraging diverse ties between Asian NGOs and civil societies, and promoting public diplomacy and social participation.
– In addition, it has the role as a pilot think tank by engaging in in-depth policy research to strengthen Taiwan’s contributions to Asian studies, and develop joint task forces on international policy co-operation (TAEF, 2018).
The NSP comprises 16 partner countries (10 ASEAN members, India, Pakistan, Sri Lanka, Nepal, Bhutan, Bangladesh, Australia, New Zealand) from among them 8 ones are considered priority-partners, like Vietnam, Philippines, Thailand, Malaysia, Singa- pore, Australia, Indonesia and India. The NSP is a possible way for Taiwan to diversify its business and investment activities in the Southeast Asian region as now it is visible that Taiwan became too much focused on – and became dependent on – Mainland China. Even though during the recent two decades ten billions of USD Taiwanese capi- tal flew into Mainland China, now the Cross-Strait Relations tending to be in a stale- mate, so the Taiwanese government has been preparing to receive and re-direct the re- turning capital from Mainland China. The majority of this capital would, nevertheless, not remain in Taiwan, it goes abroad into the various “southbound” partners, e.g. to Vietnam. He added that the Cross-Strait Relations are “frozen” in the recent two years, from Taiwan’s point of view there is no remarkable development, so Taiwan needs new partners and in parallel needs to gradually withdrew from the unilateral-sound dependence on Mainland China in terms of trade and investment (Hsiao, 2019).
Lin underlined that the New Southbound Policy would ease Taiwan’s isolation at least in terms of business. The previous phases of Southward policies in the 1990’s could still not be really successful, but in the ASEAN region many positive changes happened since then. The ASEAN region is one of the most rapidly growing regions in the world, with gradually increasing purchasing power, consumer demands and increasing openness to the e-commerce as well. So, the New Southbound Policy is the
“new hope” for Taiwan. Contrary to South Asia, in most ASEAN members the cultural background has many similarities. (The common background is the Chinese cultural roots and the Chinese communities living there.) Another interesting and common point he added is that Taiwanese men brought a high number of wives from Southeast Asia to Taiwan. Nowadays one fifth, or 20 per cent, of the new-born babies in Taiwan have Southeast Asian roots (Lin, 2019).
The following diagrams (Chart 3 and Chart 4) illustrate the Cross-Strait trade and in- vestment data of the NSP partner countries. It is clearly visible that since the early 2010’s Taiwanese FDI investment to Mainland China has been decreasing, but despitethe de- clining trend, up to early 2017 it still remained higher than investments in the NSP tar- get countries. The Taiwanese exports show an increasing trend both to Mainland China and to the NDP target countries, and since 2003, in absolute terms, exports to Mainland China had still been higher than to the NSP target countries until 2017.
Chart 3: Taiwan’s outbound investment into Mainland China and into NSP target countries, USD billion
0 2 4 6 8 10 12 14 16
2000 2001 2002 2003 2004 2005 2006 2007 2008 2009 2010 2011 2012 2013 2014 2015 20162017H1 Mainland China NSP target countries
Source: Glaser et al., 2018:17
Chart 4: Taiwan’s exports to Mainland China and to NSP target countries, USD billion
0 20 40 60 80 100
2000 2001 2002 2003 2004 2005 2006 2007 2008 2009 2010 2011 2012 2013 2014 2015 2016 2017e Mainland China NSP target countries
Source: Glaser et al., 2018:17
With the announcement of its New Southbound Policy in 2016, the Taiwanese gov- ernment signalled its commitment to help businesses expand abroad. Whether they were already moving southward or making efforts at doing so, companies could also start to see the benefits of this policy. The data evidence the success of this policy, be- tween January and August 2018: trade with the 18 partner nations grew by 5.5 percent on the previous year, according to the Office of Trade Negotiations of the Executive Yuan (Taiwan’s Government). The successes go beyond the bottom line – a major
feature of the policy is its focus on long-term development and efforts to forge a sense of economic community, and government agencies have responded with an array of resources to achieve these goals (Progress and Prospects, 2018).
Among the NSP target countries Taiwan transacts the largest volume of exports to the ASEAN countries, compared to the ASEAN 10, hence so far South Asia, Australia and New Zealand has seemed to be relatively smaller export markets for Taiwan as it can be seen in Chart 5.
Chart 5: Regional distribution of Taiwan’s exports among the NSP target countries
0 20 40 60 80
2000 2001 2002 2003 2004 2005 2006 2007 2008 2009 2010 2011 2012 2013 2014 2015 2016 2017e NSP target countries ASEAN South Asia Australia and New Zealand Source: Glaser et al., 2018:16
Chart 6: The rationale of the New Southbound Policy of Taiwan
Reinvigorating Taiwan’s partnerships with regional stakeholders
Reforming Taiwan New
Southbound Policy Reinventing
regional community
awareness Relocating
Taiwan in ASEAN-led networks
Source: Yang, 2017:8
Taiwan is open towards Southeast Asia including countries with Muslim popula- tions. The citizens of Southeast Asian countries are allowed to come to Taiwan to work, and there are probably about 170,000 Southeast Asian wives who have moved and married Taiwanese men. Taiwan prepares to even more efficiently co-operate with Muslim-oriented markets in the region, for example by developing and selling slaughtering and processing technologies for Halal food (Hsiao, 2019). Yang (2017) also emphasizes that in parallel with the government’s commitment to the New South- bound Policy, a reform process was initiated in the Taiwanese tourism industry, men- tioning as an example that halal certifications were awarded to more than a hundred restaurants and hotels to symbolize that Taiwan is becoming a Muslim-friendly envi- ronment. A new Taiwan Halal Centre, opened in Taipei in April 2017, would improve understanding Muslim norms and markets in Taiwan (Yang, 2017).
Glaser5 et al. (2018) warned about the “China factor” that could be an obstacle to the New Southbound Policy. Southeast Asian countries may be hesitant to co-operate with Taiwan, as they are worried about China’s retaliation, despite the fact that the New Southbound Policy could be a good start and suggests that Taiwan should co- ordinate its efforts with the Indo-Pacific strategy of the USA (TAEF, 2019).
Contrary to the above, Hsiao ruled out this scenario emphasizing, that the ASEAN countries can freely do business with Mainland China. Taiwan does not want to hin- der it, through the NSP, the government only wants these countries to do business with Taiwan as well. After all, the growing foreign trade and investment data justify the success of the New Southbound Policy of Taiwan. By diversification, by a techno- logical upgrade and by developing new industries, Taiwan might prevent the loss of its advanced position and maintain its competitiveness. It is now very clearly visible that closer co-operation with Mainland China will not help this process, rather, it will further shrink Taiwan’s space of mobility in the international markets (Hsiao, 2019).
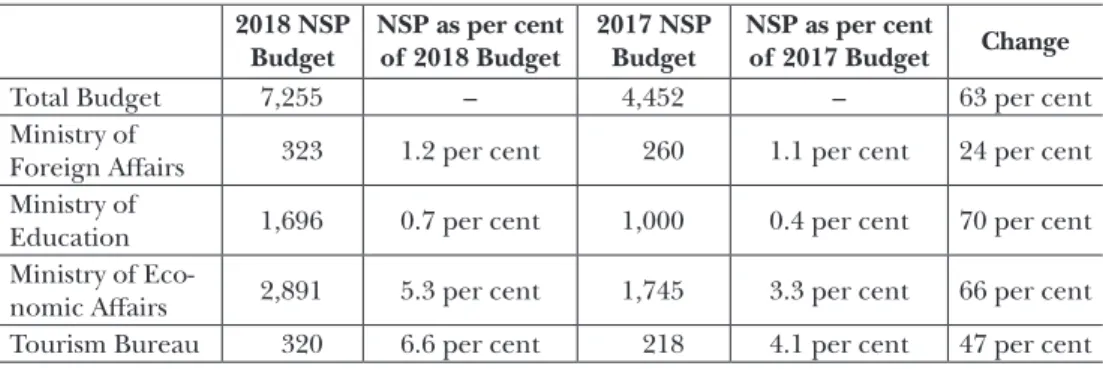
By distributing tasks among the governmental organizations, the Taiwanese govern- ment provided significantly increased financial instruments in support of the goals of the NSP. The budgetary allocation of the New Southbound Policy is shown in Table 4.
Table 4: The budget allocations for the New Southbound Policy for the financial years 2017 and 2018 (in million TWD)
2018 NSP Budget
NSP as per cent of 2018 Budget
2017 NSP Budget
NSP as per cent
of 2017 Budget Change
Total Budget 7,255 – 4,452 – 63 per cent
Ministry of
Foreign Affairs 323 1.2 per cent 260 1.1 per cent 24 per cent Ministry of
Education 1,696 0.7 per cent 1,000 0.4 per cent 70 per cent Ministry of Eco-
nomic Affairs 2,891 5.3 per cent 1,745 3.3 per cent 66 per cent Tourism Bureau 320 6.6 per cent 218 4.1 per cent 47 per cent Source: Glaser et al., 2018:5
Hsiao (2019) emphasises that the NSP is not competing and not against Mainland China’s international business and investment endeavours. NSP partner countries may freely do business with Mainland China, and in addition (but not instead) they should also co-operate and do business with Taiwan. It is clearly visible in Chart 7 that since the early 2000’s Mainland China has had higher exports to the NSP partner countries and Chart 8 also shows that since 2007 Mainland China has invested more capital in the mentioned partner countries than Taiwan. Mainland China does not really care about the NSP, as it does not extend to the field of international political relations (even the partner countries would refrain from having this field engaged in the co-operation). Nevertheless, China’s geostrategic ambitions are changing and extending beyond the South and Southeast Asian regions, as it is clearly perceptible in the New Silk Road Initiative (Engelberth–Sági, 2017).
Chart 7: Mainland China and Taiwan’s exports to NSP target countries (USD billion)
0 100 200 300 400 500
Mainland China Taiwan
2000 2001 2002 2003 2004 2005 2006 2007 2008 2009 2010 2011 2012 2013 2014 2015 2016 2017e
Source: Glaser et al., 2018:23
Chart 8: Mainland China and Taiwan’s outbound investment into NSP target countries (USD billion)
0 2 4 6 8 10 12 14 16 18
Mainland China Taiwan
2003 2004 2005 2006 2007 2008 2009 2010 2011 2012 2013 2014 2015 2016 2017H1
Source: Glaser et al., 2018:24
The current situation in the Cross-Strait Relations The NPP-based Tsai-administration has good relations with the USA and Japan, while the Cross-Strait Relations have become chilly. Tsai does not recognize the 1992 Con- sensus, in other words, the One-China Policy, while Kuomintang (KMT) has accepted it (Lin, 2019). Hence, it is not surprising that the stance of Mainland China is reserved and negative towards the Tsai-cabinet and the NPP. Ma Xiaoguang6 points out that the 1992 Consensus is the common political foundation for development of the Cross- Strait Relations. It reflects adherence to the One China principle by both sides in their efforts to seek national reunification, so it clearly defines the characteristics of the relationship. He warns against moving further along this “separatist stance” and attempts at seeking personal benefits by hyping confrontation and hostility between the two sides of the Taiwan Strait, which undermines Cross-Strait ties. The One Coun- try – Two Systems principle is an institutional arrangement after national reunification is achieved, and by purposefully confusing the 1992 Consensus and the mentioned principle, the leader of the Democratic Progressive Party is deliberately misleading the people of Taiwan (Xinhuanet, 2019).
Wang et al. (2018) emphasize that the content of the 1992 Consensus is, in fact, quite complex. First, both sides have different definitions and interpretations of the term. The incumbent Chinese Communist Party evokes the term to indicate that both the Mainland and Taiwan belong to “one China”, and both sides have a prospective of an ultimate unification in the One Country – Two Systems framework. The Consensus in Taiwan is interpreted differently. The Kuomintang (KMT) that signed and adopted the Consensus argues that it simply indicates that both the Mainland and Taiwan belong to one China; however, the interpretations of “China” are different on both sides. For (Mainland) China, the “One China” term refers to the People’s Republic of China (PRC), but for Taiwan, “One China” refers to “the Republic of China (ROC)”
(Wang et al., 2018).
Lin adds that investment activities of companies from Mainland China in Taiwan are also very strictly regulated. Furthermore, Taiwan still faces structural problems in its economy, as the services sector’s contribution to GDP is still low, around 60 per cent, and the ratio of employment is similar, which means the value added content of the Taiwanese economy is still low compared to developed economies like the USA, the UK, etc., where the services sector contributes over 75 per cent to GDP. He adds that although under the Tsai administration Cross-Strait Relations worsened, business still goes on. The main reason for Taiwanese capital flowing back of Mainland China is not the security risk, but the fact that the investors who invested into the manufac- turing industry in Mainland China during the 1980-1990’s are getting old now, and their children, the upcoming generation, do not want to take over the business, as it is usually labour-intensive, low value-added manufacturing. Another reason for Tai- wanese divestment in Mainland China is the trade war between China and the United States. If Taiwanese firms remained, they would also be hit by the high, 10 or even 25 per cent American tariffs imposed on goods made in Mainland China. Back in Taiwan
or anywhere else, Taiwanese investors and goods, especially semi-conductors and HD drives, are safe from these punitive tariffs. This is also the reason for the 2019 Q1 and Q2 macroeconomic indicators, which seem to be weaker than the data forecast for Q3 and Q4 (see Table 2). Having fears of a possible trade war, the companies performed orders before the end of 2018, so the fall-back in 2019 Q1 and Q2 is more a virtual than a real economic phenomenon (Lin, 2019).
Before 2016, Tsai’s predecessor opened Taiwan to Mainland China to a great ex- tent, and implemented reforms the institutional system and the population had not been prepared for. For example, under the implementation of the ECFA, the former Taiwanese government wanted to abolish the limitation on Chinese investments in Taiwan (they must have a Taiwanese partner and they cannot have more than 50 per cent of the shares in a company). This was the reason why the Sunflower Movement (the forerunner of the current governing party) could be successful among people.
If KMT wins again it might revert from the New Southbound Policy back to Mainland China (Chung, 2019).
Yeh7 adds that the Cross-Strait trade still works, and 30 per cent of Taiwan’s direct export goes to Mainland China, and if we add the indirect export (e.g. via Hong Kong), then nearly 50 per cent of the Taiwanese export goods are forwarded to Main- land China. He explains that in 2019 Q1 alone, Taiwanese capital returned from Mainland China in the amount of USD 1 billion, and moreover, USD 11 million capi- tal from Mainland China’s companies flew to Taiwan (in order to rescue it from the China-USA trade war). In 2019 Q1, USD 830 million worth Taiwanese capital was invested in the 18 target countries of the New Southbound Policy (Yeh, 2019).
In spite of some hostile voices in political rhetoric, serious conflicts cannot be ex- pected between Mainland and Taiwan. Interactions and business relations are normal.
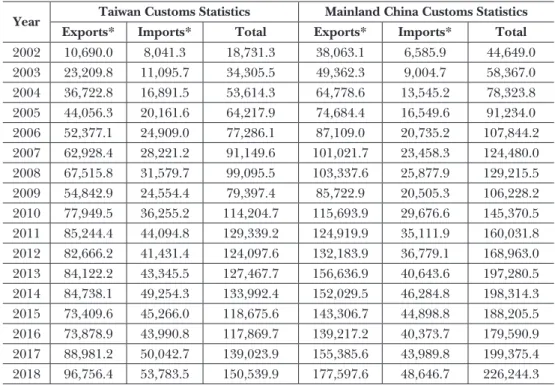
According to the Taiwan Customs statistics, the estimated value of total Cross-Strait bilateral trade was USD 20.7 billion in January and February 2019, representing a de- crease of 5.3 per cent year-on-year. The value for Taiwan’s exports to Mainland China has decreased by 7.3 per cent year-on-year to USD 12.5 billion, while the value of im- ports from Mainland China has decreased by 2.0 per cent year-on-year to USD 8.2 bil- lion. In January and February 2019, Taiwan’s trade with Mainland China accounted for 23.1 per cent of Taiwan’s total foreign trade, representing a decrease of 1.1 percentage points from 24.2 per cent in 2018. Exports to Mainland China accounted for 26.1 per cent of Taiwan’s total exports, down 2.7 percentage points from 28.8 per cent in 2018, while imports from Mainland China accounted for 19.6 per cent of Taiwan’s total im- ports, up 0.8 percentage points from 18.8 per cent in 2018 (MAC, 2019).
Taiwanese investment in Mainland China
According to the Investment Commission MOEA, in Taiwan, in January and February 2019, the number of approved foreign investment totalled 190 cases representing a value of USD 2.5 billion, of which USD 1.0 billion was approved to invest in Mainland China. Mainland China attracted 40.8 per cent of Taiwan’s total foreign investment,
thus it became the primary destination for Taiwan’s foreign investment. The invest- ment approved to Mainland China amounted to 43,401 cases between 1991 and the end of February 2019, with a value of USD 183.4 billion, or 57.2 per cent of Taiwan’s total foreign investment. A total of 86 cases for the investment in Mainland China covering post-registration were approved in January and February 2019, represent- ing a decrease by 18.1 per cent year-on-year (post-registration included), while the total value of approved investment in Mainland China including post-registration was USD 1.0 billion, up 64.7 per cent year-on-year (post-registration included). Taiwan’s investments mainly located in Jiangsu, Zhejiang, Fujian, Tianjin and other areas in Mainland China, and the investment values amounted to USD 321.5 million (31.5%
of the total investment), USD 160.7 million (15.7%), USD 148.1 million (14.5%) and USD 105.6 million (10.3%) respectively. Investments were distributed between whole- sale and retail trade with USD 216.1 million (21.1% of the total direct investment), transportation and storage with USD 135.4 million (13.2%), chemical material manu- facturing with USD 134.2 million (13.1%) and rubber products manufacturing with USD 106.6 million (10.4%, MAC, 2019).
Mainland China’s investment in Taiwan
According to the Investment Commission MOEA, Taiwan, the number of approved Mainland China investments in Taiwan totalled 18 cases with the amount of USD 7,405,000 in January and February 2019. The number of approved Mainland China investments in Taiwan totalled 1,246 cases with the amount of USD 2.2 billion be- tween June 2009 and February 2019. They were mainly made into wholesale and retail trade, electronics parts and components manufacturing, banking services, and har- bour services. The amounts invested above industries are USD 601.9 million (27.4%
of total amount), USD 283.0 million (12.9%), USD 201.4 million (9.2%), and USD 139.1 million (6.3%), respectively (MAC, 2019).
Cross-Strait visits
According to the China Ministry of Culture and Tourism, the number of Taiwanese tourists to Mainland China in 2018 totalled 6.1 million visitors with an increase of 4.5 per cent year-on-year. The number of Taiwanese tourists to Mainland China between 1987 and the end of 2018 totalled 105.4 million visitors. The residents of Mainland China who visit Taiwan for tourism purposes has been more than those who visit Tai- wan for economic and trade activities since 2003. According to Taiwan National Im- migration Agency statistics, there have been 517,790 visitors from Mainland China in January and February 2019 with an increase of 2.9 per cent. Among these, 26,797 visitors to Taiwan for economic and trade related activities representing a decrease by 6.8 per cent, and 382,003 tourists to Taiwan, representing a decrease by 0.6 per cent.
In total, 29.3 million Chinese tourists visited Taiwan between 1987 and the end of February 2019 (MAC, 2019).
![Table 2: Taiwan’s economic forecast for 2019 (TWD 100 million, Chained [2011], USD) 2019 2019 Q1 Q2 Q3 Q4 Total GDP 40,961 42,034 43,722 44,971 171,688 Real GDP (%) 1.80 1.85 2.30 2.51 2.12 Private Consumption 23,559 23,353 23,820 23,798 94,530 Private Con](https://thumb-eu.123doks.com/thumbv2/9dokorg/973433.58355/11.810.130.682.165.815/taiwan-economic-forecast-million-chained-private-consumption-private.webp)