DEVELOPMENT ECONOMICS
Sponsored by a Grant TÁMOP-4.1.2-08/2/A/KMR-2009-0041 Course Material Developed by Department of Economics,
Faculty of Social Sciences, Eötvös Loránd University Budapest (ELTE) Department of Economics, Eötvös Loránd University Budapest
Institute of Economics, Hungarian Academy of Sciences Balassi Kiadó, Budapest
2
Author: Katalin Szilágyi Supervised by Katalin Szilágyi
January 2011
Week 1
Introduction, measurement and basic characteristics
Development economics
• Developing / underdeveloped countries
• Development: increase in income, welfare, economic opportunities (”quality of life”)
• Starting point: measurement
• GDP/GNP vs. multidimensional measures
• Stylized facts on income / growth / convergence
Outline
1. Measurement issues
• Comparability
3
• Different measures 2. Stylized facts
• Growth in the world economy
• Convergence?
3. Structural features of developing countries
1. Measurement
1. Measurement issues: comparability
• Developing / underdeveloped = low income
• Comparing income
• Per capita
• Common currency
• Conversion on market exchange rate is biased
• Poor countries are cheaper
• Balassa–Samuelson
• Penn World Table (Summers–Heston database)
• GDP in real terms (relative to USA)
• Real GDP: PPP-adjusted
• Other issues:
• Unofficial / grey economy (hidden income)
• Production for self-provision
4
• No market prices
• Can cause systematic bias, beware!
1. Measures
• GDP/GNP a natural starting point
• Other measures: life expectancy, literacy, food consumption (undernourishment), infant mortality etc.
• Index from United Nations Development Programme: Human Development Report (HDI)
• Human Development Indicator (HDI)
• Life expectancy
• Literacy (2/3) and school attendance (1/3)
• Corrected income per capita (PPP, below $5000 threshold)
• Between 0 and 1
• Countries ranked in annual reports
1. Which measure?
• GDP: narrow concept of well-being, but a good proxy
• Correlations with broader measures are high
5
6
2. Stylized facts 2. Stylized facts
• The world economy is growing.
• Even in per capita terms.
• Growth is volatile but steady.
• Significant cross-sectional heterogenity.
7
2. Stylized fact: GDP
2. Stylized fact: population
World GDP
$0
$5,000,000,000
$10,000,000,000
$15,000,000,000
$20,000,000,000
$25,000,000,000
$30,000,000,000
$35,000,000,000
$40,000,000,000
$45,000,000,000
1970 1972 1974 1976 1978 1980 1982 1984 1986 1988 1990 1992 1994 1996 1998 2000
World Population
0 1,000,000 2,000,000 3,000,000 4,000,000 5,000,000 6,000,000
1970 1972 1974 1976 1978 1980 1982 1984 1986 1988 1990 1992 1994 1996 1998 2000
8
2. Stylized fact: per capita GDP
2. Stylized fact: growth
World GDP Per Capita
$0
$1,000
$2,000
$3,000
$4,000
$5,000
$6,000
$7,000
$8,000
1970 1972 1974 1976 1978 1980 1982 1984 1986 1988 1990 1992 1994 1996 1998 2000
World Growth Rate
-2%
-1%
0%
1%
2%
3%
4%
5%
1970 1971 1972 1973 1974 1975 1976 1977 1978 1979 1980 1981 1982 1983 1984 1985 1986 1987 1988 1989 1990 1991 1992 1993 1994 1995 1996 1997 1998 1999
9
2. Stylized facts on growth
Average annual growth in per capita GDP (1970–2000)1
• Low Income: 0.17% (1.05)
• Low-Middle: 1.01% (1.35)
• Upper-Middle: 0.99% (1.34)
• New Tigers: 3.79% (3.05)
• Old Tigers: 4.89% (4.4)
• High Income: 1.95% (1.8)
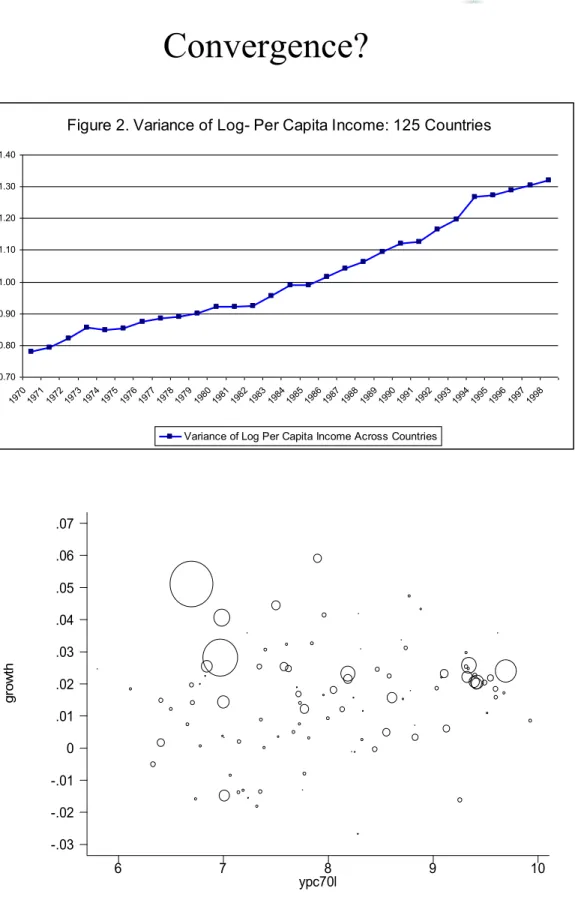
2. Stylized facts: convergence
• Convergence in income
• Questions:
• Do poor countries grow faster?
• Do cross-country income inequalities decline over time?
• Does income inequality among individuals in the world decline?
1 Hulten–Isaksson: Why development levels differ
10
2. Convergence within a country
2. Convergence between countries
growth
ypc70l
5.8041 9.93357
-.027063 .05886
11
Convergence?
Figure 2. Variance of Log- Per Capita Income: 125 Countries
0.70 0.80 0.90 1.00 1.10 1.20 1.30 1.40
1970 1971 1972 1973 1974 1975 1976 1977 1978 1979 1980 1981 1982 1983 1984 1985 1986 1987 1988 1989 1990 1991 1992 1993 1994 1995 1996 1997 1998
Variance of Log Per Capita Income Across Countries
growth
ypc70l
6 7 8 9 10
-.03 -.02 -.01 0 .01 .02 .03 .04 .05 .06 .07
12
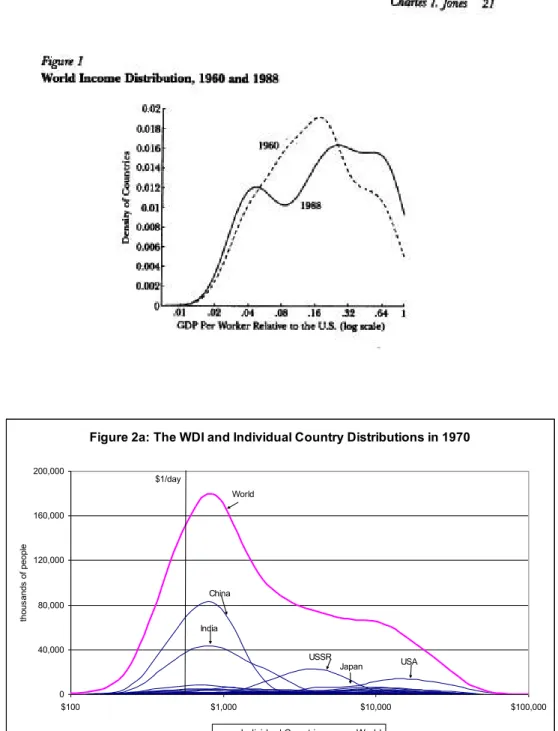
World income distribution
Figure 2a: The WDI and Individual Country Distributions in 1970
0 40,000 80,000 120,000 160,000 200,000
$100 $1,000 $10,000 $100,000
thousands of people
Individual Countries World World
China
India
USSR
Japan USA
$1/day
13
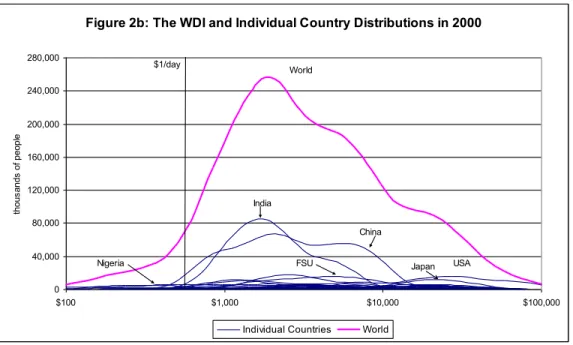
Figure 2b: The WDI and Individual Country Distributions in 2000
0 40,000 80,000 120,000 160,000 200,000 240,000 280,000
$100 $1,000 $10,000 $100,000
thousands of people
Individual Countries World World
China India
FSU
Nigeria Japan USA
$1/day
WDI-Various Years
0 50,000 100,000 150,000 200,000 250,000 300,000
$100 $1,000 $10,000 $100,000
thousands of people
1970 1980 1990 2000
14
Mobility matrix
3. Structural features of developing countries 3. Structural features
• Demographic features
• Young population
• Infant mortality
• School enrollment
• Hinders per capita growth
• Agriculture is predominant
15
• Migration
• Higher population growth in cities
• Huge grey service sector
• International trade
• No clear pattern in openness
• Higher share of primary products
• Terms-of-trade volatility