1 23
Radiation and Environmental Biophysics
ISSN 0301-634X Radiat Environ Biophys
DOI 10.1007/s00411-020-00868-5
Simulation of the effect of mucociliary clearance on the bronchial distribution of inhaled radon progenies and related
cellular damage using a new deposition and clearance model for the lung
Árpád Farkas
1 23
Commons Attribution license which allows
users to read, copy, distribute and make
derivative works, as long as the author of
the original work is cited. You may self-
archive this article on your own website, an
institutional repository or funder’s repository
and make it publicly available immediately.
Vol.:(0123456789)
1 3
Radiation and Environmental Biophysics https://doi.org/10.1007/s00411-020-00868-5
ORIGINAL ARTICLE
Simulation of the effect of mucociliary clearance on the bronchial distribution of inhaled radon progenies and related cellular damage using a new deposition and clearance model for the lung
Árpád Farkas1
Received: 20 April 2020 / Accepted: 17 August 2020
© The Author(s) 2020
Abstract
Most of the current dosimetry models of inhaled short-lived radon decay products assume uniform activity distributions along the bronchial airways. In reality, however, both deposition and clearance patterns of inhaled radon progenies are highly inhomogeneous. Consequently, a new deposition-clearance model has been developed that accounts for such inhomogeneities and applied together with biophysical models of cell death and cell transformation. The scope of this study was to apply this model which is based on computational fluid and particle dynamics methods, in an effort to reveal the effect of mucociliary clearance on the bronchial distribution of deposited radon progenies. Furthermore, the influence of mucociliary clearance on the spatial distribution of biological damage due to alpha-decay of the deposited radon progenies was also studied. The results obtained demonstrate that both deposition and clearance of inhaled radon progenies are highly non-uniform within a human airway bifurcation unit. Due to the topology of the carinal ridge, a slow clearance zone emerged in this region, which is the location where most of the radio-aerosols deposit. In spite of the slow mucus movement in this zone, the initial degree of inhomogeneity of the activity due to the nonuniform deposition decreased by a factor of about 3 by considering the effect of mucociliary clearance. In the peak of the airway bifurcation, the computed cell death and cell transformation probabilities were lower when considering deposition and clearance simultaneously, compared to the case when only deposi- tion was considered. However, cellular damage remained clustered.
Keywords Radon inhalation · Fast clearance · Cell death · Cell transformation
Introduction
Even if the macroscopic exposure level of an individual (e.g.
due to radon in air) is known (ICRP 103 2007), the resulting dose distribution within the human body is difficult to quan- tify because technical and ethical barriers hamper its meas- urement. In contrast, numerical modelling can be an effec- tive method to quantify the radiation dose at various levels of biological organization (whole body, organs, tissues, cells, subcellular entities). This kind of approach may be feasi- ble especially when the distribution of the energy deposi- tion due to ionising radiation is uneven, like in the case of
alpha-particles originating from the decay of inhaled radon and radon progenies. In such a case, the spatial distribution of the induced biological damage may also be non-uniform.
Earlier simulations confirmed indeed that, due to the special features of airway morphology and particle aerodynamics, the deposition distribution of inhaled radio-aerosols within the human bronchial airways is highly inhomogeneous (Far- kas et al. 2011). Specifically, the number of deposited parti- cles per unit surface (deposition density) can be two or three orders of magnitude higher than the average deposition den- sity, depending on particle size and breathing parameters, among others. In another study (Farkas and Szőke 2013) using inactive insoluble particles, it was demonstrated that the primary deposition patterns of such particles in the lung can be significantly modified by mucociliary clearance. This fast clearance mechanism includes the transport of parti- cles deposited in the lung towards the larynx/pharynx by a thin (a few micrometers thick) mucus layer. This highly viscous mucus layer lines the large bronchial airways and it
* Árpád Farkas
farkas.arpad@energia.mta.hu
1 Environmental Physics Department, Centre for Energy Research, Konkoly-Thege M. út 29-33, 1121 Budapest, Hungary
is propelled by co-ordinated beating of cilia. If the physical half-life of any deposited radioisotope is long enough that it is removed from their initial location of deposition but shorter than the time needed for the mucus to remove them from the airways, then the resulting activity distribution in the airways is different from the primary activity distribution due to deposition alone. In such situations, besides model- ling the deposition of radio-aerosols, it is also important to simulate their clearance. Based on current knowledge, short- lived radon progenies are transported by the mucus upward a few centimetres which means that the location of their decay will be different from the location of their deposition (Sturm and Hofmann 2007). In this context it is an important question to what extent mucociliary clearance can modify the highly non-uniform primary activity distribution due to deposition. In addition, it is important to clarify the role of mucociliary clearance in the cellular processes follow- ing the inhalation and decay of radon progenies. To reveal any effects of mucociliary clearance, a complex deposition- clearance-decay model has been developed and applied in the present study, allowing for a continuous activity size distribution of radon progeny, and for a dynamic, i.e., time- dependent, lung deposition and clearance. Specifically, the current standard model was refined in that it accounts for a realistic measured size distribution of radon progenies instead of assuming a simplified bimodal distribution, simi- lar to the approach followed by (James et al. 2004).
Methods
Airway and mucus geometry
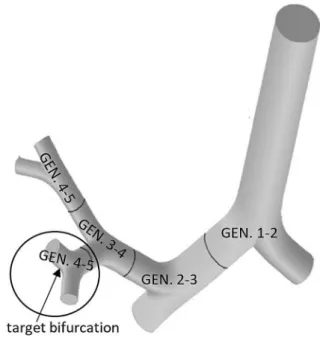
To study the effects associated with deposition, clearance and decay of inhaled short-lived radon progenies, a repre- sentative bronchial airway bifurcation has been used. The morphometric data of this symmetric airway segment cor- responding to the 4th and 5th airway generations (trachea is the first generation) are summarized in Table 1. The method used to construct this geometry is described in detail in Hegedűs et al. (2004). As depicted in Fig. 1, the modelled single airway bifurcation is located in the right upper lobe of the lung. Its parent branch is a segmental bronchus, while its daughter branches are sub-segmental bronchi (anterior and posterior). This central airway geometry has been chosen
because the maximum of the deposition density is in this region of the lungs (Füri et al. 2020) and according to earlier histopathological studies (Veeze 1968; Garland 1962) malig- nancies due to radon inhalation were most frequent in this area. Though the modelled airway bifurcation is only a small part of the central airways, similar tendencies are expected to occur in all the other bifurcation units of the lung. The mod- elled bifurcation will be referred to as “target bifurcation” or
“model bifurcation” throughout the manuscript.
The modelled airway bifurcation was covered by a mucus layer. Actually, this layer is composed of two sublayers, namely the preciliary layer (sol layer) and the gel layer that resides atop the sol layer. The composition and movement of the two layers is different (Craster and Matar 2000; Button et al. 2012). In the present work, only the movement of the gel layer was modelled, since this layer transports any radio- active particles. The thickness of the gel layer was assumed to be 5 µm. Although the movement of the sol layer was not modelled, this layer was considered when the interaction of particles with the epithelium was simulated, because this layer can absorb a part of the energy of emitted alpha-parti- cles. The thickness of the sol layer was assumed to be 4 µm.
Table 1 Geometric data of the model airway bifurcation Length of parent
branch (cm) Length of daughter
branch (cm) Diameter of parent
branch (cm) Diameter of daughter branch (cm)
Bifurcation angle
(°) Curvature radius
of daughter branch (cm)
Carinal curvature radius (cm)
0.72 1.20 0.56 0.45 35.0 1.43 0.1
Fig. 1 Location of the modelled airway bifurcation within the trache- obronchial tree
Radiation and Environmental Biophysics
1 3
Whole airway deposition and clearance modelling It should be noted that, although the distribution of particles and the related biological endpoints were modelled in a sin- gle airway bifurcation, a part of the particles originated from deeper airways. To simulate the realistic number and type of particles entering the model bifurcation per unit time for different exposition scenarios, deposition and clearance of these particles must be known at the level of the whole lung.
For the modelling of the number of particles deposited in the upper airways and in each airway generation, the Sto- chastic Lung Model was used. This model requires as main input the lung capacity and some breathing parameters, and parameters characterizing the aerodynamics of the inhaled
generational deposition fractions, the length of the airway tube, the velocity of the mucus in the corresponding airway generations (Hofmann and Sturm 2004), and the activity of the deposited radon progenies. Denoting the number of
218Po, 214Pb and 214Bi/214Po isotopes at the beginning of simulations by N0
1 , N0
2 and N0
3 , respectively, the number of these isotopes after time t can be calculated by Eqs. 1–3:
and
where 𝜆1 , 𝜆2 and 𝜆3 are the physical decay constants of the three isotopes. In Eqs. 1–3, t represents the time needed for an isotope to reach the model bifurcation after its deposition in one of the airway generations with a generation number higher than 5. Daughter isotopes reaching the end of the decay chain (210Pb) were discounted. The number and type of the radon progenies reaching the 5th generation airways per unit time were stored.
Local deposition and clearance modelling
The deposition of radon progenies in the target bifurcation was simulated by CFPD (computational fluid and particle dynamics) techniques. For this purpose, the ANSYS FLU- ENT code was used in conjunction with user-defined subrou- tines (written in C++ language and attached to the original code) to tailor the code to the special needs of the present tasks. Details of this technique are described for example in Farkas and Balásházy 2008. Briefly, the 3D airway geometry was spatially discretized by the application of an unstruc- tured numerical mesh. The inhaled air was treated as a con- tinuum (Euler method), its pressure, velocity and turbulence parameters were computed in each computational cell by solving the equations of mass and momentum conservation and the turbulence equations. The inhaled particles were discrete entities (Lagrange method). There was a one-way coupling between the two phases (air-particle). Particle tra- jectories were allowed to be influenced by airflow, but the particles had no influence on the airflow.
Clearance of particles within the target bifurca- tion was modelled also by CFPD techniques using the Euler–Lagrange approach. Meshing of the mucus layer is quite a challenging task due to its low thickness (see Farkas (1) N1(t) =N0
1e−𝜆1t,
(2) N2(t) = 𝜆1
𝜆2−𝜆1
N0
1(e−𝜆1t−e−𝜆2t) +N0
2
e−𝜆2t
(3) N3(t) = 𝜆1𝜆2
𝜆2−𝜆1N0
1
(e−𝜆1t−e−𝜆3t
𝜆3−𝜆1 − e−𝜆2t−e−𝜆3t 𝜆3−𝜆2
) + 𝜆2
𝜆3−𝜆2N0
2
(e−𝜆2t−e−𝜆3t) +N0
3e−𝜆3t,
particles. The output of the model includes the fractions of particles deposited in different anatomical regions of the lung. In addition, the model provides the deposition fractions specific to each airway generation. In the model the lengths, diameters and branching angles of the airways are selected by Monte Carlo techniques from statistical distributions established based on morphometric data measured at the Lovelace Inhalation Toxicology Research Institute (Raabe et al. 1976). The evaluation of these data is described in Koblinger and Hofmann (1985). In the same publication, criteria for the simulation of particle pathways are described (typically, trajectories of 100,000 particles should be simu- lated). It is worth noting that in the model the particles are tracked only in the bronchial and acinar airways, but not in the extrathoracic airways. Instead, the model applies empiri- cal deposition formulae, to quantify the particle deposition in the upper airways. In the present work, Cheng’s diffusional deposition formula was used (Cheng 2003) in conjunction with Yu’s deposition formula (Yu et al. 1981) providing the deposition as a function of the impaction parameter. In the bronchial and acinar regions, particles deposit by inertial impaction, gravitational sedimentation and Brownian dif- fusion. Due to their small size, unattached radon progenies deposit by thermal diffusion. Radon progenies attached to the environmental particles deposit by all the three mecha- nisms, though deposition by diffusion is predominant. The equations describing the deposition by these three mecha- nisms are provided in Koblinger and Hofmann (1990), and were adopted from the work of Yeh and Schum (Yeh and Schum 1980).
Clearance of particles deposited in the acinar airways was not considered in the present study. Clearance of par- ticles deposited in the tubular airways was modelled by a simple algorithm which considered the computed airway
and Szőke 2013). The movement of the mucus layer was modelled assuming a density of 100 kg/m3, a viscosity of 1 Pa s (Podgórski and Sosnowski 2000), and a mucus veloc- ity of 1 mm/min (Asgharian et al. 2001) at the entrance of fifth generation branches. This value was derived from a mucus velocity of 5.5 mm/min measured in the trachea (Cuddihy and Yeh 1988). Due to the high viscosity of the mucus, the trajectories of the particles mostly follow the streamlines of the mucus flow field. More details about the CFPD clearance model can be found in Farkas and Szőke (2013).
Dynamic model of deposition, clearance and decay As shown in the left panel of Fig. 2, particles can enter into the mucus layer directly by deposition during inhalation or exhalation, and by clearing-up from the higher generation airways (deeper airways). In the last case, the particles enter the model at the end of one of the daughter branches. At the same time, some radioactive particles can leave the bifur- cation at the beginning of the parent branch clearing up to lower airway generations. Besides the airway and mucus geometries, Fig. 2 also demonstrates a scheme of the main steps of the simulations. Deposition of attached and unat- tached radon progenies in the whole respiratory system was modelled by the Stochastic Lung Model, as described above.
Upward movement of the deposited particles (carrying radon progenies) was also modelled, to find out the fraction of particles that enter the target bifurcation per unit time (see above). Deposition in the target bifurcation was simulated in advance by CFDP techniques (see above) and the co- ordinates of the deposition sites were stored. Two thousand clearance trajectories were also calculated in advance by CFPD techniques. A particle tracking code (written in PERL programming language) was developed for the simultane- ous modelling of deposition, clearance and decay in the target bifurcation geometry. The simulated particles were tracked with a time resolution of 0.1 s. At each time step, a
certain number of depositing particles carrying 218Po, 214Pb and 214Bi isotopes were included. Their number depended on the exposure conditions (radon concentration and equi- librium factor) and their deposition efficiency. The deposi- tion locations were randomly selected from the database of deposition co-ordinates, which were calculated in advance (see above). Radioisotopes were released at each time step from the inlets of daughter branches. Their entrance coordinates were randomly selected, while their number depended on the exposure conditions and the results of the whole lung deposition and clearance modelling (see above).
Each tracked isotope could decay at each time step with a probability proportional to its activity. The location of every alpha-decay was stored. In the case of a decay, the tracked isotope changed its ID (218Po became 214Pb, 214Pb became
214Bi/214Po, 214Bi/214Po became 210Pb). Both the particles depositing in the target bifurcation and those clearing up from the deeper airways moved in the model bifurcation along one of the pre-calculated 2,000 clearance trajecto- ries (which was the closest at the moment of deposition or entrance at the daughter branch inlet).
Alpha‑tracks and cell nucleus doses
For the modelling of the alpha energy absorbed by cell nuclei (and the related cell nucleus doses), alpha-tracks were generated and the epithelial cell nucleus structure was recon- structed. The energy absorbed by the cell nuclei was calcu- lated from the intersection of alpha tracks with the nuclei.
The starting point of the alpha-tracks were the locations of the decays, which were determined as described above. The direction of the alpha tracks was randomly selected. Near- wall (penetrating directly into the epithelial tissue) and far- wall alpha-tracks (penetrating the tissue after traversing the lumen) were distinguished. Near-wall alpha tracks resulted in an energy deposition in the mucus and tissue, while far- wall tracks caused energy deposition in the air, then in the mucus and finally in the tissue. Far-wall tracks were longer
Fig. 2 Representation of particle transport by clearance along the model airway (left) and schematic of the numerical models used (right)
Radiation and Environmental Biophysics
1 3
because the stopping power of alpha particles is much lower in air than in tissue. The alpha-tracks associated with the decay of 214Po were also longer than those assigned to 218Po decay, due to the higher initial kinetic energy of the alpha- particles emitted by 214Po. Elliptical objects represented the sensitive cell nuclei of the lung epithelium. Their size and location was derived from Mercer et al (1991, 1994).
Cell nuclei of the two most radiosensitive cell types, basal and secretory cells (ICRP66), were considered. However, it should be recognized that the bronchial sections described in Mercer et al. (1991) were oblique, thus the depths of the cells in the epithelium may be overestimated. This may lead to some underestimation of doses to basal cell nuclei.
Cell death and cell transformation modelling
To analyse the effect of the combined action of deposition and clearance in the context of cellular damage, cell death and cell transformation probabilities caused by the decaying alpha- emitting radioisotopes were calculated. These probabilities are based on the results of in vitro experiments of cell irradiations with high LET (linear energy transfer) radiation. These experi- ments revealed that the probability of cell survival decreases exponentially with dose to the cell nucleus. This observation can be expressed by Eq. 4
where S is the cell survival probability, D is the dose absorbed by the cell nucleus and γ is a parameter which can be determined experimentally. In this work, the value of γ = 1.3 Gy−1 derived by Poncy et al (2002) on rat tracheal (4) S(D) =e−𝛾D,
epithelial cells was used. Based on Eq. 4 the probability of cell death was calculated (Eq. 5).
By the same token, based on irradiation experiments, the probability of cell transformation is proportional to the dose.
In addition, a cell must survive to be able to transform, thus the transformation probability (T) can be described as in Eq. 6.
where α is an empirical parameter. In this work the value of α = 5 × 10⁻⁴ Gy−1 was calculated from the experiments of Miller et al. (1999) performed on CH310T1/2 cells.
It is worth noting that the experiment described in Miller et al. (1999) were performed on a mouse fibro-blast model system. In the past, this model system turned out to be quite reliable in predicting trends relevant for the estimation of health consequences in humans after radon inhalation (e.g.
Brenner et al. 1995) The LET of the charged particles used in the experiment by Miller and co-workers corresponds to the LET spectrum of radon progeny alpha particles in bron- chial epithelium. In Miller et al. (1999) the cell transforma- tion probability is provided as a function of the number of alpha-hits. In the present work, the transformation probabil- ity was first plotted as a function of cellular dose and then fitted by a linear function (αD) to obtain the value of α.
Radiation exposure conditions
The numerical models described in the previous sections were applied for the case of radon progenies assuming (5) I(D) =1−S(D) =1−e−𝛾D.
(6) T(D) =𝛼De−𝛾D.
Table 2 Model inputs characterizing the radiation level, breathing pattern and the inhaled particles
Quantity Value Source or explanation
Radiation exposure
Equilibrium radon concentration (Bq/m3) 46 UNSCEAR (2000)
Radioisotope concentration ratio (–) 0.58/0.44/0.29 (218Po:214Pb:214Bi/214Po)
Equilibrium factor (–) 0.4 BEIR VI, (1999)
Breathing parameters
Breathing mode Nasal ICRP 66, (1994)
Flow rate (L/min) 18 ICRP 66, (1994)
Breathing frequency (min−1) 12 ICRP 66, (1994)
Tidal volume (L) 0.75 ICRP 66, (1994)
Functional residual capacity (L) 3.3 ICRP 66, (1994)
Aerosol parameters
Particle number concentration in the inhaled air (m−3) 7,820/51,270/25,090 (218Po:214Pb:214Bi/214Po) Based on activity con- centrations and decay half-lives
Particle diameter See the size distribution in Fig. 3 BEIR VI
radiation exposure conditions characteristic of homes.
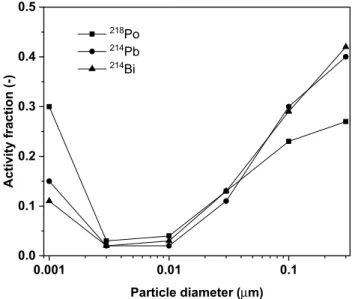
The main parameters of radon exposure are summarised in Table 2. This table also includes the parameters characteris- ing the assumed breathing mode (tidal breathing of a Cauca- sian adult male when sitting awake) and the properties of the inhaled aerosols. The sources of the model input values are also indicated in the table. The activity-weighted size dis- tributions of 218Po, 214Pb and 214Bi/214Po were adopted from BEIR VI (1999). The activity size distributions derived from this source can be seen in Fig. 3.
As the figure demonstrates, 218Po shows the highest frac- tion of particles around 1 nm. This is due to the lower frac- tion of 218Po attached to environmental particles, which is a consequence of the short half-life of 218Po. The activity size distributions were transformed into number size distribu- tions, which were used throughout the calculations instead of the classical method of using one size for the unattached and one characteristic size for the attached progenies. The number size distribution of the particles at the entrance of the parent branch of the target bifurcation during inhalation was calculated based on the number size distribution in the surrounding air and the calculated filtration efficiency of the upper airways and the bronchial segments upstream to the selected target bifurcation. Similarly, the number size distri- bution of the particles entering the 5th generation branches during exhalation was determined from the number size distribution in the air, the deposition fraction during inhala- tion and the filtration efficiency of the downstream airways
during exhalation. It is worth noting that the size distribu- tion in Fig. 3 refers to dry particles, and hygroscopic growth inside the airways may modify the size of the particles. In radon dosimetry calculations, usually it is considered that unattached radon progenies have a growth factor of 1 while attached progenies have a growth factor of 1.5–2. However, in the present study not only two particle sizes (one for unat- tached and one for attached) were considered, but a size distribution. Considering that below 10 nm the growth fac- tor is close to one and the deposition fraction in the target bifurcation is very low between 10 and 500 nm and hardly changes between 100 and 500 nm, the effect of hygroscopic growth on deposition is very limited. Therefore, hygrosco- picity was neglected in the present study.
Parameters characterizing the deposition and clearance of radon progenies
The deposition and clearance of radioactive particles was characterized by different indicators. The overall deposition in a certain region/section/unit of the airways can be char- acterised by deposition fraction and deposition efficiency.
Deposition fraction is the ratio of the number of particles deposited in a target region to the number of particles enter- ing the whole respiratory system. By the same token, deposi- tion efficiency is the ratio of the number of particles depos- ited in the target region to the number of particles entering that region. For the characterisation of the degree of inho- mogeneity of the particles, particle enhancement factors can be defined. By definition, the particle enhancement factor is the ratio of the deposition density on a pre-defined surface to the average deposition density for the whole surface of the airway section considered (one bifurcation in this study).
Deposition density is the number of particles on an airway surface divided by the area of that surface. To compute the distribution of local enhancement factors, the whole surface of the target bifurcations was scanned by a pre-specified sur- face element. Naturally, the local enhancement factor values are sensitive to the surface area of the scanning element (patch). Because in the present study the length scales of interest (alpha-track length, epithelial cell size) were of the order of tens or hundreds of micro-meters, it was plausible to choose 100 µm × 100 µm as the size of the patch (surface area = 10–8 m2).
Finally, to demonstrate the effect of the non-uniform deposition and mucociliary clearance all the calculations were performed by considering three different scenarios: (i) uniform deposition without clearance; (ii) inhomogeneous deposition without clearance and (iii) inhomogeneous depo- sition with clearance.
0.001 0.01 0.1
0.0 0.1 0.2 0.3 0.4 0.5
Activity fraction (-)
Particle diameter (µm)
218Po
214Pb
214Bi
Fig. 3 Activity size distribution of 218Po, 214Pb and 214Bi/214Po char- acteristic of homes, derived from data in BEIR VI (1999) publication
Radiation and Environmental Biophysics
1 3
Results and discussion
Regional and local airway deposition of the short‑lived radon progenies
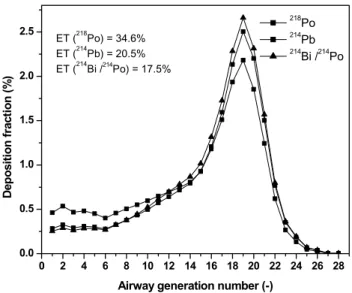
As described in the Methods section, extrathoracic and air- way generational deposition fractions were calculated by the Stochastic Lung Model. The results of these computa- tions are shown in Fig. 4 separately for 218Po, 214Pb and
214Bi/214Po. It is worth noting that the deposition fraction values are provided for the whole size distribution shown in Fig. 3; thus they represent combined values of unattached and attached progenies. Taken separately, the extrathoracic deposition fraction of the unattached fraction (1 nm sized
particles) would be 90%, while that of the attached fraction 5.8%. Also note that deposition fraction values of 214Pb and
214Bi are different because of different unattached fractions of these isotopes.
The deposition in the extrathoracic region is the highest in the case of 218Po, due to the largest fraction of this isotope in the nanometre size range. It can be calculated from these deposition fraction values that 8% of the activity represented by all the inhaled particles enter the target airway bifurcation during inhalation (through the parent branch) and 5.7% dur- ing exhalation (through the two daughter branches). These values can be used as input for the modelling of local depo- sition in the airway bifurcation shown in Fig. 2. The appli- cation of the CFPD deposition model using the breathing parameters in Table 2 and the specific size distribution of
218Po, 214Pb and 214Bi/214Po when these radioisotopes enter the target bifurcation resulted in a 0.8% deposition efficiency for inhalation and 0.3% for exhalation.
Figure 5 depicts an example of the computed deposition patterns for inhalation and exhalation for a breathing period of 16 h (all the three radioisotopes shown together). As the figure demonstrates, the deposition patterns are inhomoge- neous (especially at) inhalation with a deposition hot spot at the peak of the bifurcation. The maximum value of the local enhancement factor is 423.1 indicating that the activ- ity deposited over the most exposed groups of cells is two orders of magnitude higher than the average activity over the whole airway bifurcation. Combining the results of the whole airway computations (by the Stochastic Lung Model) and local deposition calculations (by CFPD techniques) shows that only 0.06% of the total inhaled activity deposits in the target bifurcation during inhalation and about 0.02%
during exhalation, resulting in less than 0.1% combined (inhalation and exhalation) deposition.
0 2 4 6 8 10 12 14 16 18 20 22 24 26 28 0.0
0.5 1.0 1.5 2.0 2.5
Deposition fraction (%)
Airway generation number (-)
218Po
214Pb
214Bi /214Po ET (218Po) = 34.6%
ET (214Pb) = 20.5%
ET (214Bi /214Po) = 17.5%
Fig. 4 Calculated airway-generation-specific deposition fractions of
218Po, 214Pb and 214Bi/214Po. Their extrathoracic deposition fractions (ET) are also provided
Fig. 5 Inhalation (left), exhalation (middle) and combined (right) deposition patterns of short-lived radon progenies after 16 h of exposure in homes. DE deposition efficiency, DF deposition fraction
Regional and local clearance of the short‑lived radon progenies
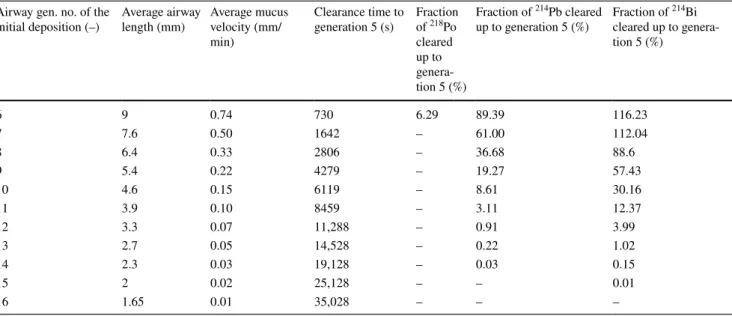
To compute the fraction of the isotopes deposited in airway generations higher than 5 and entering the model bifurca- tion, the regional clearance model was applied for the case of particle deposition presented in Fig. 4. The results of the simulations are presented in Table 3. In this table, the val- ues of average airway lengths and mucus velocities are also provided. It is worth noting that a part of 214Pb entering the inlets of the 5th airway generation deposited originally in higher airway generations as 214Pb and cleared up with- out decaying, while another part of 214Pb entering the inlets of the 5th airway generation deposited originally in higher airway generations as 218Pb, but decayed into 214Pb while clearing up. By the same token, a fraction of 214Bi entering the inlets of the 5th airway generation deposited originally in higher airway generations as 214Bi and cleared up with- out decaying, while a second fraction of 214Bi entering the inlets of the 5th airway generation deposited originally in higher airway generations as 214Pb and decayed into 214Bi while clearing up. Likewise, a third fraction of 214Bi isotopes entering the inlets of the 5th airway generation deposited originally in higher airway generations as 218Pb and decayed twice (first into 214Pb, then into 214Bi) before reaching the model bifurcation.
The fact that some isotopes decay during clearance while others of the same type do not decay may seem a contradic- tion for those who are familiar with the standard approach where constant decay rates are assumed. Obviously, aver- age decay rates are constant; however, decay is a stochas- tic process. Modelling time dependence and stochasticity was possible in the present work by applying Monte Carlo
techniques, which meant that while tracking the individual radioisotopes a random value from a probability distribution function wa selected. For the same time step this resulted in radioactive decay for some radioisotopes while others of the same type remained stable (e.g., 218Po). If the considered time period is much longer than the physical half-life of the considered radioisotope, then the probability of decay is high, but still some isotopes may not decay. In Table 3 the values exceeding 100% are a consequence of the radioactive decay law (Eqs. 1–3) and the fact that about twice as many
214Pb as 214Bi nuclei are deposited in airway generation 6.
At the same time, the physical half-life of 214Pb is only 37%
larger than that of 214Bi. As a result, the number of 214Bi nuclei will increase shortly after deposition. Naturally, after some time the number of 214Pb nuclei becomes so low that the number of 214Bi nuclei does not increase further and even starts decreasing. If the clearance time is short (as is for example the case for the clearance from airway generation 6 to airway generation 5), then the number of 214Bi nuclei increases, so the up-cleared fraction will be > 100% (first two values of the last column in Table 3). In contrast, if the clearance time is longer (as is for example the case for the clearance from airway generations > 7), then the up-cleared fraction will be < 100%, decreasing to zero in the case of
214Bi clearance from airway generation 16 to airway gen- eration 5. Fractions of less than 0.01% were neglected, thus cleared-up 218Po nuclei could originate only from airway generation 6, 214Pb nuclei from airway generations 6–14, and 214Bi nuclei from airway generations 6–15.
Simulations of the local clearance pattern within the target bifurcation revealed that the mucus velocity is not uniform. While the mucus accelerated in the parent branch, there was a slow clearance zone evident at the carinal ridge
Table 3 Fractions of 218Po, 214Pb and 214Bi nuclei originally deposited in airway generations 6–15 and cleared up to airway generation 5 Airway gen. no. of the
initial deposition (–) Average airway
length (mm) Average mucus velocity (mm/
min)
Clearance time to
generation 5 (s) Fraction of 218Po cleared up to genera- tion 5 (%)
Fraction of 214Pb cleared
up to generation 5 (%) Fraction of 214Bi cleared up to genera- tion 5 (%)
6 9 0.74 730 6.29 89.39 116.23
7 7.6 0.50 1642 – 61.00 112.04
8 6.4 0.33 2806 – 36.68 88.6
9 5.4 0.22 4279 – 19.27 57.43
10 4.6 0.15 6119 – 8.61 30.16
11 3.9 0.10 8459 – 3.11 12.37
12 3.3 0.07 11,288 – 0.91 3.99
13 2.7 0.05 14,528 – 0.22 1.02
14 2.3 0.03 19,128 – 0.03 0.15
15 2 0.02 25,128 – – 0.01
16 1.65 0.01 35,028 – – –
Radiation and Environmental Biophysics
1 3
of the target bifurcation, exactly where the deposition was the most intense. The inhomogeneous mucus velocity resulted in a distribution of particle residence times, defined as the time a particle spends in the target bifurcation from the entrance at one of the daughter branches to the end of the parent branch. The mean residence time turned out to be 20 min with a standard deviation of 1.7 min; however, particles entering the slow clearance zone spent up to 29 min in the target bifurcation. It is worth noting that unlike depo- sition, clearance is not dependent on particle diameter, thus all the radon progenies are clearing up along the same tra- jectories. Due to the high mucus viscosity, the particles are moving with the velocity of the mucus and their trajectories coincide with the mucus flow streamlines.
Simultaneous deposition, clearance and decay of the short‑lived radon progenies
Deposition patterns shown in Fig. 5 represent cumulative values, that is, the particles are supposed immobile and inac- tive. In reality, however, during the exposure period a frac- tion of the deposited particles can leave the airway bifurca- tion by clearance, some particles may enter the bifurcation from the deeper airways and the activity of the radioisotopes is also changing. To account for all these phenomena, the dynamic deposition-clearance-decay model developed in the present study was applied for the exposure conditions presented in Table 2. Starting from “empty airways” (i.e., zero activity), as a result of the combined action of deposi- tion, clearance and decay, the activity inside the target bifur- cation increased gradually in the first roughly 30 min, and then oscillated around an equilibrium value. These results of the calculations can be seen in the left panel of Fig. 6.
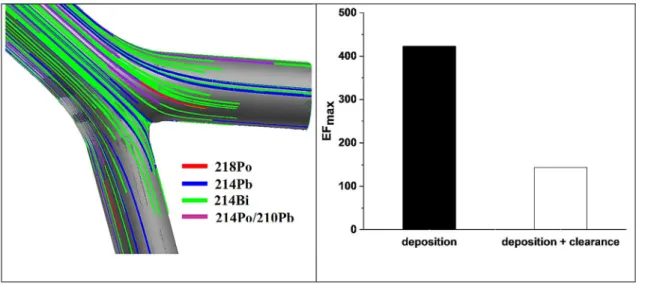
The trajectories starting at the end of the daughter branches represent nuclei originating from the deeper airways, while those starting inside the target bifurcation correspond to nuclei deposited locally (in the target bifurcation). Differ- ent colours correspond to the different nuclei. If a nucleus decayed, the colour of the trajectory changed. The location of alpha-decays and the corresponding alpha-energies (7.69 or 6 MeV) were stored. The right panel of Fig. 6 reveals that clearance leads to a decrease in the inhomogeneity of the activity distribution. The maximum value of the local enhancement factor computed solely based on deposition (423.1) decreased by a factor of about 3 due to clearance (to 143.9). This result indicates that in spite of the existence of a slow clearance area exactly at the location of deposition hot spot, mucociliary clearance decreases the radiation burden of the cells in the carinal region. Therefore, cellular doses in this region would be underestimated if uniform deposition was supposed, but overestimated, if only a realistic deposi- tion without clearance was assumed.
The effect of clearance on cell death and cell transformation
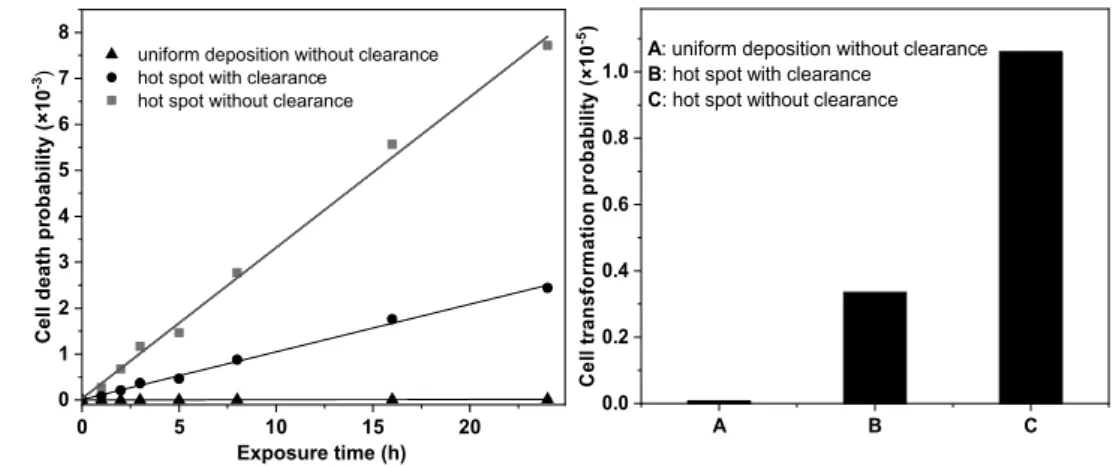
The results of the dynamic deposition-clearance-decay model for cell death and cell transformation are depicted in Fig. 7.
The assumption of a uniform deposition (as it is currently assumed in standard dosimetry and risk models) leads to low cell death and very low cell transformation probabili- ties for the modelled exposure times. Considering a realistic inhomogeneous deposition did not change the average val- ues of cell death and cell transformation much, but in the deposition hot spot the likelihood of these events was two
Fig. 6 Trajectories of 218Po, 214Pb and 214Po inside a central airway bifurcation (left) and maximum enhancement factors assuming deposition alone or deposition and clearance
to three orders of magnitude higher than the average values.
Mucociliary clearance appears to reduce the frequency of cell death and cell transformation by factors of 2–4 high- lighting the importance of modelling this effect together with deposition. The present results demonstrate that the site-specificity of deposition and inhomogeneous clearance can lead to relatively high and localized cell damage prob- abilities even at low levels of radiation.
The standard model including uniform deposition and clearance was not used in the present calculations because it was already published recently (Füri et al. 2020). However, comparing the results obtained with the standard model with those obtained with the present models leads to the conclu- sion that cell death and cell transformation probabilities for uniform deposition including clearance would fall between the cell death and transformation probabilities for uniform deposition without clearance and for the deposition hot spot with clearance (see Fig. 7).
It is worth mentioning that mucus clearance CFD simu- lations presented here were based on the assumption of a continuous mucus flow. The inclusion of the experimentally observed reduced clearance in a restricted zone (peak of the bifurcation) or even lack of mucus may further increase the degree of inhomogeneity of particle distribution and the related spatial heterogeneity of the biological endpoints induced by radiation exposure. Because this effect increases the degree of inhomogeneity of particle distribution and the related spatial heterogeneity of the biological endpoints, it does not compromise but further strengthen the conclusions of the present study.
It should also be noted that the dosimetric computations in this study are restricted to a single central airway bifur- cation and, consequently, the results obtained may not be representative for all the airway bifurcations. As the airway generation number increases, the number of particles depos- ited in a single bifurcation decreases (please note that Fig. 5 sums up the deposition in all the bifurcations belonging to
the same generation, thus it can be misleading from this point of view). This decrease is partly due to the decreasing airflow rate and the increasing number of airway bifurca- tions, but also due to the fact that fewer and fewer particles are available for deposition as one goes deeper into the air- ways (i.e., part of the particles have already deposited). On the other hand, clearance in the higher airway generations is less efficient, partly due to the lower mucus velocity and partly due to discontinuities of the mucus layer in the deeper airways. These are two competing effects which will cancel each other to some extent. The combined effect of deposition and clearance will depend on airway generation number, but the qualitative results obtained for generation 4–5 and the main conclusions remain unchanged.
Conclusions
Simultaneous modelling of deposition, mucociliary clear- ance and radioactive decay of inhaled radon progeny allowed to simulate the airway dynamics of the short-lived radon progenies and the cellular consequences of radon prog- eny inhalation in a more realistic way. The accuracy of the results was improved also by considering a realistic size distribution and a time dependent approach instead of the standard method, which included only two particle sizes and a steady approach to account for clearance. The present study revealed that in the large bronchial airways not only the deposition but also the clearance patterns can be non- uniform. Clearance decreased the activity in the areas with the highest deposition density, but the activity distribution remained heterogeneously distributed. Restricted areas of the airways may receive high doses even at low macroscopic radiation levels. As a consequence, damaged cell clusters can occur at the peak of the individual airway bifurcations.
Health consequences of the highly localized damage remain to be clarified.
Fig. 7 Cell death probability for different exposure times assum- ing uniform deposition without clearance, in the deposition hot spot neglecting clearance, and in the hot spot accounting for the effect of clearance (left);
cell transformation probability assuming the same three sce- narios and 24 h exposure (right)
0 5 10 15 20
0 1 2 3 4 5 6 7
8 uniform deposition without clearance hot spot with clearance
hot spot without clearance
Cell death probability (×10-3)
Exposure time (h) 0.0 A B C
0.2 0.4 0.6 0.8 1.0
Cell transformation probability (×10-5)
A: uniform deposition without clearance B: hot spot with clearance
C: hot spot without clearance
Radiation and Environmental Biophysics
1 3
Acknowledgement This work was supported by the Bolyai János Fel- lowship of the Hungarian Academy of Sciences.
Funding Open access funding provided by ELKH Wigner Research Centre for Physics.
Compliance with ethical standards
Conflict of interest The author declares no conflict of interest.
Open Access This article is licensed under a Creative Commons Attri- bution 4.0 International License, which permits use, sharing, adapta- tion, distribution and reproduction in any medium or format, as long as you give appropriate credit to the original author(s) and the source, provide a link to the Creative Commons licence, and indicate if changes were made. The images or other third party material in this article are included in the article’s Creative Commons licence, unless indicated otherwise in a credit line to the material. If material is not included in the article’s Creative Commons licence and your intended use is not permitted by statutory regulation or exceeds the permitted use, you will need to obtain permission directly from the copyright holder. To view a copy of this licence, visit http://creat iveco mmons .org/licen ses/by/4.0/.
References
Asgharian B, Hofmann W, Miller FJ (2001) Mucociliary clearance of insoluble particles from the tracheobronchial airways of the human lung. J Aerosol Sci 32:817–832
BEIR Vi Report (1999) Health effects of exposure to radon. National Academy Press, Washington
Brenner DJ, Miller RC, Huang Y, Hall EJ (1995) The biological effec- tiveness ofrdon-progeny alpha particles. III. Quality factors.
Radiat Res 142:61–69
Button B, Cai LH, Ehre C, Kesimer M, Hill DB, Sheehan JK, Boucher RC, Rubinstein M (2012) A periciliary brush promotes the lung health by separating the mucus layer from airway epithelia. Sci- ence 337:937–941
Cheng YS (2003) Aerosol deposition in the extrathoracic region. Aer Sci Tech 37(659–671):2003
Craster RV, Matar OK (2000) Surfactant transport on mucus films. J Fluid Mech 425:235–258
Cuddihy RG, Yeh HC (1988) Respiratory tract clearance of particles and substances dissociated from particles. In: Dungworth D, Kimmerle G, Lewkowski J, et al. (eds) Inhalation toxicology: the design and interpretation of inhalation studies and their use in risk assessment. Springer-Verlag, New York, pp 169–193
Farkas Á, Balásházy I (2008) Quantification of particle deposition in asymmetrical tracheobronchial model geometry. Comp Biol Med 38:508–518
Farkas Á, Szőke I (2013) Simulation of bronchial mucociliary clear- ance of insoluble particles by computational fluid and particle dynamics methods. Inhal Toxic 25:593–605
Farkas Á, Hofmann W, Balásházy I, Szőke I, Madas BG, Moustafa M (2011) Effect of site-specific bronchial radon progeny deposition on the spatial and temporal distributions of cellular responses.
Radiat Environ Biophys 50:281–297
Füri P, Farkas Á, Madas BG, Werner H, Winkler-Heil R, Kudela G, Balásházy I (2020) The degree of inhomogeneity of the absorbed
cell nucleus doses in the bronchial region of the human respiratory tract. Radiat Environ Biophys 59:173–183
Garland LH, Beier RL, Coulson W, Heald JH, Stein RL (1962) The apparent sites of origin of carcinomas of the lung. Radiology 78:1–11
Hegedűs Cs J, Balásházy I, Farkas Á (2004) Detailed mathematical description of the geometry of airway bifurcations. Resp Phys Neurobiol 141:99–114
Hofmann W, Sturm R (2004) Stochastic model of particle clearance in human bronchial airways. J Aer Med 17:73–89
ICRP Publication 103 (2007) The 2007 Recommendations of the Inter- national Commission on Radiological Protection. In: Valentin J (ed) Annals of the ICRP 37 (2–4). Elsevier
ICRP Publication 66 (1994) Human respiratory tract model for radio- logical protection. In: Annals of the ICRP, Vol 24, Pergamon, London
James AC, Birchall A, Akabani G (2004) Comparative dosimetry of BEIR VI revisited. Radiat Prot Dosim 108:3–26
Koblinger L, Hofmann W (1985) Analysis of human lung morphomet- ric data for stochastic aerosol deposition calculations. Phys Med Biol 30:541–556
Koblinger L, Hofmann W (1990) Monte Carlo modelling of aerosol deposition in human lungs. Part I: simulation of particle transport in a stochastic lung structure. J Aer Sci 21:661–674
Mercer RR, Michael LR, James DC (1991) Radon dosimetry based on the depth distribution of nuclei in human and rat lungs. Health Phys 61:117–130
Mercer RR, Michael LR, Roggoli VL, James DC (1994) Cell number and distribution in human and rat airway. Am J Resp Cell Mol Biol 10:613–624
Miller RC, Randers-Pehrson G, Geard CR, Hall EJ, Brenner DJ (1999) The oncogenic transforming potential of the passage of single a particles through mammalian cell nuclei. Proc Natl Acad Sci USA 96:19–22
Podgórski A, Sosnowski TR (2000) dynamic analysis of the process of an aerosol particle deposition onto an extracellular lining layer in the human lung. J Aer Sci 31:S500–S501
Poncy J-L, Kugel C, Tourdes F, Bailly I (2002) In vitro radiation- induced effects on rat tracheal epithelial cells. II. Different pre- neoplastic cell transformation after α and γ radiations. J Radiat Res 43:35–42
Raabe OG, Yeh HC, Schum GM, Phalen RF (1976) Tracheobronchial geometry human, dog, rat, hamster, LF-53 Lovelace Foundation Report. Albuquerque, New Mexico
Sturm R, Hofmann W (2007) Stochastic modelling predictions for the clearance of insoluble particles from the tracheobronchial tree of the human lung. Bull Math Biol 69:395–415
United Nations Scientific Committee on the Effects of Atomic Radia- tion. Sources and effects of ionizing radiation (2000). UNSCEAR 2000 Report to the General Assembly, New York
Veeze P (1968) Rationale and methods of early detection in lung can- cer. Van Gorcum, Assen
Yeh HC, Schum GM (1980) Models of human lung airways and their application to inhaled particle deposition. Bull Math Biol 42:461–480
Yu CP, Diu CK, Soong TT (1981) Statistical analysis of aerosol deposi- tion in nose and mouth. Am Ind Hygiene Ass J 42:726–733 Publisher’s Note Springer Nature remains neutral with regard to jurisdictional claims in published maps and institutional affiliations.