materials
Article
Facile Green Synthesis of BiOBr Nanostructures with Superior Visible-Light-Driven Photocatalytic Activity
Seema Garg1,*ID, Mohit Yadav1,2, Amrish Chandra3, Sameer Sapra4, Soniya Gahlawat4, Pravin P. Ingole4ID, Milica Todea5,6, Eniko Bardos7, Zsolt Pap5,8 ID and Klara Hernadi7ID
1 Department of Chemistry, Amity Institute of Applied Sciences, Amity University, Sector-125, Noida 201313, Uttar Pradesh, India; yadavmohit27@gmail.com
2 Amity Institute of Nanotechnology, Amity University, Sector-125, Noida 201313, Uttar Pradesh, India
3 Amity Institute of Pharmacy, Amity University, Sector-125, Noida 201313, Uttar Pradesh, India;
chandra.amrish@gmail.com
4 Department of Chemistry, Indian Institute of Technology, Delhi, Hauz Khas, New Delhi 110016, India;
sapra@chemistry.iitd.ac.in (S.S.); soniyagh.iitd@gmail.com (S.G.); ppingole@chemistry.iitd.ac.in (P.P.I.)
5 Nanostructured Materials and Bio-Nano-Interfaces Center, Interdisciplinary Research Institute on Bio-Nano-Sciences, Babes,-Bolyai University, Cluj-Napoca 400271, Romania; militodea@yahoo.com (M.T.);
k.pap.zsolt@gmail.com (Z.P.)
6 Department of Molecular Sciences, Faculty of Medicine, Iuliu Ha¸tieganu University of Medicine and Pharmacy, Cluj-Napoca 400012, Romania
7 Department of Applied and Environmental Chemistry, University of Szeged, Rerrich tér 1, H-6720 Szeged, Hungary; bardosenci@gmail.com (E.B.); hernadi@chem.u-szeged.hu (K.H.)
8 Institute of Environmental Science and Technology, University of Szeged, Tisza Lajos krt. 103, H-6720 Szeged, Hungary
* Correspondence: sgarg2@amity.edu
Received: 2 July 2018; Accepted: 20 July 2018; Published: 24 July 2018 Abstract:Novel green bismuth oxybromide (BiOBr-G) nanoflowers were successfully synthesized via facile hydrolysis route using anAzadirachta indica(Neem plant) leaf extract and concurrently, without the leaf extract (BiOBr-C). TheAzadirachta indicaleaf extract was employed as a sensitizer and stabilizer for BiOBr-G, which significantly expanded the optical window and boosted the formation of photogenerated charge carriers and transfer over the BiOBr-G surface. The photocatalytic performance of both samples was investigated for the degradation of methyl orange (MO) and phenol (Ph) under the irradiation of visible light. The leaf extract mediated BiOBr-G photocatalyst displayed significantly higher photocatalytic activity when compared to BiOBr-C for the degradation of both pollutants. The degradation rate of MO and Ph by BiOBr-G was found to be nearly 23% and 16% more when compared to BiOBr-C under visible light irradiation, respectively. The substantial increase in the photocatalytic performance of BiOBr-G was ascribed to the multiple synergistic effects between the efficient solar energy harvesting, narrower band gap, high specific surface area, porosity, and effective charge separation. Furthermore, BiOBr-G displayed high stability for five cycles of photocatalytic activity, which endows its practical application as a green photocatalyst in the long run.
Keywords:bismuth oxybromide; phenol; methyl orange; photocatalysis; hydrolysis
1. Introduction
Over the years, visible light-driven semiconductors have gained a lot of interest because of their efficient photocatalytic performance and higher stability for the photodegradation of organic pollutants. In the recent past, titanium dioxide was the best-known photocatalyst for the degradation of organic pollutants. However, due to its wide band gap (3.2 eV), its photocatalytic performance is
Materials2018,11, 1273; doi:10.3390/ma11081273 www.mdpi.com/journal/materials
Materials2018,11, 1273 2 of 17
confined under natural sunlight [1–4]. Until now, various approaches have been employed to enhance the photocatalytic performance of TiO2under visible light such as doping with the transition metal or non-metals [5–7], coupling with narrow band gap semiconductors [8,9], dye-sensitization [10,11], etc. However, in certain cases, the functionalization of TiO2has resulted in self photodegradation, instability under visible light, and residual toxicity [12].
To make optimum use of the visible light, bismuth oxyhalides [13,14] BiOX (X = Cl, Br, I), a new class of visible light active semiconductors have been extensively investigated for environmental remediation and photocatalytic energy conversion. They are non-toxic, chemically stable and possess a unique optical property. Among the BiOX, BiOBr is profoundly utilized due to its high photocatalytic activity, suitable band gap, and stability under visible light illumination. The intrinsic crystalline layer and lamellar structure of BiOBr makes it a suitable photocatalyst [15–17]. Regardless of these superior advantages, the application of bismuth oxybromide is practically limited because of the high recombination of the photogenerated e−-h+pairs and inadequate light absorption efficiency [18].
To overcome these limitations, various approaches have been adopted to modulate and tailor BiOBr such as the exposure of different crystal faces [19,20], morphological control [21,22], and heterogeneous hybridization [23,24]. However, most of these techniques are not eco-friendly, and some of the methods involve the use of various surfactants and solvents such as CTAB [25], ethanol [26], ethylene glycol [27], and EDTA [28], etc., which could result in residual toxicity and secondary pollution.
Therefore, to eliminate the use of harmful chemicals, a massive increase in the usage of plant extracts has been seen in the synthesis process of various nanostructures. The green method serves as an economical and eco-friendly approach, and eliminates the consumption of expensive and toxic chemicals. Nowadays, different parts of plant extracts have been utilized in the synthesis process such asSolanum xanthocarpumBerry [29], tea leaf [30],Ocimum sanctum[31],Aloe vera[32],Memecylon edule[33],Terminalia chebula[34],Arnebia nobilis[35], etc. One of the most common and important plants, i.e.,Azadirachta indica(Neem) has several phytochemicals present in the leaf extract such as flavones, ketones, terpenoids, organic acids, aldehydes, amino acids, etc., which mediates the reduction and stabilization of the metal ions into their corresponding nanostructures [36,37]. Benefitting from these properties, various nanostructures usingAzadirachta indicaleaf extract have been synthesized so far such as Ag nanoparticles [38], Fe nanoparticles [39], ZnO nanoparticles [40], titanium nanoparticles [41], etc.
To the best of our knowledge, the synthesis of BiOBr using anAzadirachta indicaleaf extract or any other leaf extract has not been reported yet. Hence, in our proposed work, we synthesized BiOBr-G using aqueous leaf extract for the first time by the hydrolysis route with minor modifications [42]. The method involves the use ofAzadirachta indicaleaf extract acting as a natural stabilizer and template to reduce the size of nanoplates, enhance the surface area, and inhibition of e−-h+pairs recombination under visible light irradiation to enhance the photocatalytic performance of BiOBr-G.
2. Materials and Methods
2.1. Chemicals
Analytical grade chemicals like potassium bromide, phenol, methyl orange and bismuth nitrate [Bi(NO3)3·5H2O] were procured from Merck India.
2.2. Synthesis of Plant Extract
FreshAzadirachta indicaleaves were collected from the Amity University campus, Noida, India.
The leaves were cleaned thoroughly with running tap water followed by double distilled water to remove debris and other impurities and dried at room temperature. A total of 10 g of chopped leaves was added to 100 mL double distilled water in a 250 mL beaker and allowed to boil on a hotplate for 30 min. The extract was cooled down, filtered ,and utilized for the synthesis process.
Materials2018,11, 1273 3 of 17
2.3. Synthesis of BiOBr-G and BiOBr-C
In a typical experimental procedure, 2.425 g of bismuth nitrate was dissolved in 100 mL ouble distilled water containing 10 mL glacial acetic acid, and the resulting solution was added to 8 mL plant extract (Supporting Information, Section S1) under magnetic stirring. Then, the obtained solution was added dropwise to a 100 mL KBr solution (0.595 g of KBr dissolved in 100 mL water) under vigorous stirring. At room temperature, it was stirred for 1 h and kept in an oven for 1 h at 60◦C. The resulting suspension was centrifuged to separate the product and then washed three times with ethanol and double distilled water to remove the impurities. Finally, it was dried in an oven at 60◦C. BiOBr-C was synthesized through the same procedure; however, the use of plant extract was avoided. (Supporting Information, Figure S2).
2.4. Characterization
The X-ray diffraction (XRD) patterns using a Bruker D2-Phaser Diffractometer (Coventry, UK) with a Cu Kαradiation source (λ= 1.5418 Å) were recorded. The surface morphology and elemental analysis of BiOBr-G and BiOBr-C were examined by Zeiss-Sigma VP FESEM, Ostalbkreis, Germay (field emission scanning electron microscope), FEI Technai G2 X-Twin TEM, Malaga, Spain (transmission electron microscope), 200 kV and EDS (energy dispersive X-ray spectroscopy), Bruker, Coventry, UK.
Surface area was estimated by the BET method for which nitrogen adsorption–desorption studies were carried out at 77 K using a Quanta Chrome NOVA 1000, Graz, Austria. XPS (X-ray photoelectron spectroscopy) data were obtained on a PHOIBOS (150 MCD) device (Berlin, Germany) with 1486.69 eV, Al Kαmonochromatic radiation at 20 mA and 14 kV, and the pressure <10−9mbar. The functional groups on the as-prepared samples were determined using FTIR (Agilent, Cary 630, NC, USA). The optical characteristics were analyzed by both UV-vis diffuse reflectance spectra (Shimadzu UV-1800, Columbia, SC, USA) and photoluminescence spectra (Shimadzu RF-5301, Columbia, SC, USA).
2.5. Photocatalytic Experiment
The photocatalytic experiment was conducted in a photoreactor equipped with four compact fluorescent lamps 28 W each to provide visible light illumination to the photocatalyst. A 50 g L−1 NaNO2solution was used as a UV cut off filter [43]. Initially, 50 mg of the photocatalyst was added to a 100 mL aqueous solution of phenol and methyl orange with an initial concentration of 50 mg L−1and 20 mg L−1, respectively. For the control experiment, 10 mL leaf extract was added to 90 mL aqueous solution of 20 mg L−1MO. Before illumination, the slurry was agitated in the dark for 60 min to ensure adequate adsorption–desorption equilibrium (Supporting Information, Section S3, Figure S3).
The slurry was then subjected to visible light illumination under constant stirring. At certain time periods, a 3 mL sample was taken from the reactor and separated via centrifugation. The absorbance of the supernatant was measured by UV-vis spectrophotometer at 465 nm for MO and 270 nm for Ph. The concentration of the photocatalyst varied from 50–125 mg for MO and 50–150 mg for Ph, respectively. The intermediates generated by photolysis of phenol were detected by high-performance liquid chromatography (HPLC, Shimadzu, Kyoto, Japan). Reversed phase column (Enable C18G, 25×0.46 cm with an internal diameter of 5µm) and a mobile phase consisting of a mixture of methanol (60%v/v) and water (40%v/v) was used and a 1.0 mL/min flow rate was set. The intermediates were identified by a 6520 Accurate-Mass Q-TOF LC-MS (liquid chromatography-mass spectroscopy), Agilent Technologies instrument. The range wasm/z50–500, and +ve ions were monitored.
2.6. Radical Trapping Experiment
Individual scavengers (1 mM isoprapanol, 1 mM benzoquinone, and 1 mM sodium oxalate) were added to determine the active species responsible for the photocatalytic activity i.e., hydroxyl radicals (OH), superoxide radicals (O2−), and holes (h+), respectively. The same methodology of the photocatalytic experiment was followed as above-mentioned.
Materials2018,11, 1273 4 of 17
2.7. Electrochemical Measurements
The electrochemical studies were carried out on a CHI 608E potentiostat (CHI Instruments, Austin, TX, USA) equipped with 150 W Xe arc lamp (Optosolar GmbH, Merdingen, Germany) using the standard three electrode system, a working electrode (catalyst ink mounted on ITO substrate), a saturated Hg/HgO electrode (reference electrode), and a platinum wire (counter electrode).
To prepare the working electrode, the drop casting method was adopted: briefly, 2 mg of the material was ultrasonically suspended in a mixture of 100µL ethanol and 10µL nafion, of which 10µL was then drop-casted on a piece of ITO coated glass substrate with a fixed area of 1 cm2. A 0.1 M KOH (pH 12.8) was used as the electrolyte for the photoelectrochemical (PEC) studies. Transient photocurrent response was recorded at 0.0 V vs. Hg/HgO reference electrode. Electrochemical impedance spectroscopy (EIS) measurements were also carried out at 0.0 V versus Hg/HgO within frequency range of 1 MHz to 10 mHz.
3. Results and Discussion
3.1. XRD Analysis
Figure1a shows the X-ray diffraction patterns of the as-prepared BiOBr-G and BiOBr-C. All the identified peaks corresponding to (001), (002), (011), (012), (110), (003), (112), (004), (020), (113), (014), (211), (114), (212), (015), (032) ,and (116) planes are according to the JCPDS Card No. 73-2061 [44] and can be indexed to the tetragonal phase of BiOBr. Interestingly, with the incorporation of the leaf extract in BiOBr-G, the overall intensity of the XRD peaks decreased, suggesting the slight degradation of crystallinity. The most probable reason behind the decrease in crystallinity could be the generation of crystal defects in the BiOBr-G lattice, which resulted in the charge imbalance and changed stoichiometry of the sample [45].
Materials 2018, 11, x FOR PEER REVIEW 4 of 17
2.7. Electrochemical Measurements
The electrochemical studies were carried out on a CHI 608E potentiostat (CHI Instruments, Austin, TX, USA) equipped with 150 W Xe arc lamp (Optosolar GmbH, Merdingen, Germany) using the standard three electrode system, a working electrode (catalyst ink mounted on ITO substrate), a saturated Hg/HgO electrode (reference electrode), and a platinum wire (counter electrode). To prepare the working electrode, the drop casting method was adopted: briefly, 2 mg of the material was ultrasonically suspended in a mixture of 100 μL ethanol and 10 μL nafion, of which 10 μL was then drop‐casted on a piece of ITO coated glass substrate with a fixed area of 1 cm2. A 0.1 M KOH (pH 12.8) was used as the electrolyte for the photoelectrochemical (PEC) studies. Transient photocurrent response was recorded at 0.0 V vs. Hg/HgO reference electrode. Electrochemical impedance spectroscopy (EIS) measurements were also carried out at 0.0 V versus Hg/HgO within frequency range of 1 MHz to 10 mHz.
3. Results and Discussion
3.1. XRD Analysis
Figure 1a shows the x‐ray diffraction patterns of the as‐prepared BiOBr‐G and BiOBr‐C. All the identified peaks corresponding to (001), (002), (011), (012), (110), (003), (112), (004), (020), (113), (014), (211), (114), (212), (015), (032) ,and (116) planes are according to the JCPDS Card No. 73‐2061 [44] and can be indexed to the tetragonal phase of BiOBr. Interestingly, with the incorporation of the leaf extract in BiOBr‐G, the overall intensity of the XRD peaks decreased, suggesting the slight degradation of crystallinity. The most probable reason behind the decrease in crystallinity could be the generation of crystal defects in the BiOBr‐G lattice, which resulted in the charge imbalance and changed stoichiometry of the sample [45].
Figure 1. (a) XRD patterns; (b) FTIR spectra of BiOBr‐C and BiOBr‐G.
In addition, no additional peaks and chemical changes in the crystal structure of BiOBr‐G were observed, indicating a high purity of the sample. Furthermore, in BiOBr‐G, the full width at half maximum (FWHM) of the XRD peaks seemed to be widened, indicating a smaller crystallite size than BiOBr‐C. The crystallite sizes of BiOBr‐G and BiOBr‐C were calculated using Debye Scherer’s Equation (Supporting Information, Section S3) and were found to be 6.9 nm and 17.2 nm, respectively.
3.2. FTIR Analysis
In order to investigate the functional groups present in BiOBr‐C and BiOBr‐G, FTIR spectra were carried out as shown in Figure 1b. The absorption peak originating at 3469 cm−1 was assigned to the
10 20 30 40 50 60 70 80
116 015 032
212
211 014114 113 020 112004 003 110 012
011 002
Intensity (a.u.)
2 (degree)
BiOBr-C BiOBr-G
001
500 1000 1500 2000 2500 3000 3500 4000 3469
3469 1462
465 1342
1626
% Transmittance
Wavenumber (cm-1) BiOBr-C
BiOBr-G
1051
(a) (b)
Figure 1.(a) XRD patterns; (b) FTIR spectra of BiOBr-C and BiOBr-G.
In addition, no additional peaks and chemical changes in the crystal structure of BiOBr-G were observed, indicating a high purity of the sample. Furthermore, in BiOBr-G, the full width at half maximum (FWHM) of the XRD peaks seemed to be widened, indicating a smaller crystallite size than BiOBr-C. The crystallite sizes of BiOBr-G and BiOBr-C were calculated using Debye Scherer’s Equation (Supporting Information, Section S3) and were found to be 6.9 nm and 17.2 nm, respectively.
3.2. FTIR Analysis
In order to investigate the functional groups present in BiOBr-C and BiOBr-G, FTIR spectra were carried out as shown in Figure1b. The absorption peak originating at 3469 cm−1was assigned to the O–H stretching vibration mode of water. The peak at 465 cm−1in the spectra of BiOBr-C and BiOBr-G was attributed to the Bi–O chemical stretching vibration mode in the crystal tetragonal phase
Materials2018,11, 1273 5 of 17
of BiOBr, respectively [46]. Some additional peaks were also observed in the spectra of BiOBr-G, the peaks originated at 1626 cm−1and 1051 cm−1were ascribed to the amide C=O stretching and C–O–C linkages or C–O bonds [40]. The peaks at 1342 cm−1and 1462 cm−1accounted for the C–OH and O=C–H vibrations, respectively. The additional peaks were mainly attributed to the flavonoids and other phytochemicals present markedly in theAzadirachta indicaleaf extract [36,41].
3.3. XPS Analysis
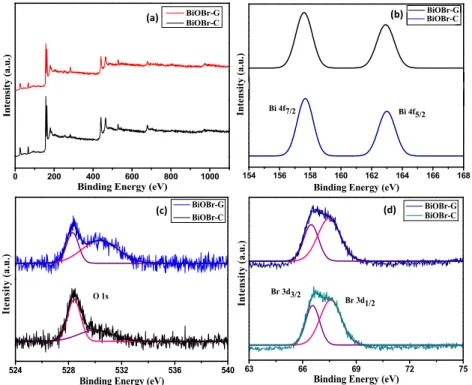
The chemical composition and surface chemical states of the as-prepared BiOBr-G and BiOBr-C were evaluated by XPS as shown in Figure2. As shown in Figure2a, Bi, O, and Br peaks were displayed in the XPS spectra of both materials, which was in accordance with the chemical constituent of the materials. Figure2b shows the Bi 4f high-resolution spectra of both samples; 157.9 eV and 163.3 eV peaks were assigned to Bi 4f7/2and Bi4f5/2, which indicated the existence of Bi3+in both samples [47].
The high-resolution O 1s XPS spectra of the BiOBr-G and BiOBr-C are displayed in Figure2c. For BiOBr-C, the O 1s profile fitted into two symmetrical peaks located at 528.3 eV and 530.1 eV, indicating two different oxygen (O) species in the sample. The O 1s peak at 528.3 eV was ascribed to the O atoms (Bi–O crystal lattice). The peak at 530.1 eV was ascribed to the bismuth–oxygen bonds in the [Bi2O2] slabs of BiOBr. In the high-resolution O 1s spectrum of BiOBr-G, the peak at 530.3 eV was shifted marginally, demonstrating a minor change in the oxygen environment [15,48] due to the incorporation ofAzadirachta indicain the BiOBr-G. The high-resolution XPS Br 3d spectra (Figure2d) shows two distinct peaks at a binding energy of 66.6 eV and 67.5 eV, and were attributed to Br 3d3/2and Br 3d1/2, respectively [49]. The results were consistent with the XRD analysis.
Materials 2018, 11, x FOR PEER REVIEW 5 of 17
O–H stretching vibration mode of water. The peak at 465 cm−1 in the spectra of BiOBr‐C and BiOBr‐
G was attributed to the Bi–O chemical stretching vibration mode in the crystal tetragonal phase of BiOBr, respectively [46]. Some additional peaks were also observed in the spectra of BiOBr‐G, the peaks originated at 1626 cm−1 and 1051 cm−1 were ascribed to the amide C=O stretching and C–O–C linkages or C–O bonds [40]. The peaks at 1342 cm−1 and 1462 cm−1 accounted for the C–OH and O=C–
H vibrations, respectively. The additional peaks were mainly attributed to the flavonoids and other phytochemicals present markedly in the Azadirachta indica leaf extract [36,41].
3.3. XPS Analysis
The chemical composition and surface chemical states of the as‐prepared BiOBr‐G and BiOBr‐C were evaluated by XPS as shown in Figure 2. As shown in Figure 2a, Bi, O, and Br peaks were displayed in the XPS spectra of both materials, which was in accordance with the chemical constituent of the materials. Figure 2b shows the Bi 4f high‐resolution spectra of both samples; 157.9 eV and 163.3 eV peaks were assigned to Bi 4f7/2 and Bi4f5/2, which indicated the existence of Bi3+ in both samples [47]. The high‐resolution O 1s XPS spectra of the BiOBr‐G and BiOBr‐C are displayed in Figure 2c.
For BiOBr‐C, the O 1s profile fitted into two symmetrical peaks located at 528.3 eV and 530.1 eV, indicating two different oxygen (O) species in the sample. The O 1s peak at 528.3 eV was ascribed to the O atoms (Bi–O crystal lattice). The peak at 530.1 eV was ascribed to the bismuth–oxygen bonds in the [Bi2O2] slabs of BiOBr. In the high‐resolution O 1s spectrum of BiOBr‐G, the peak at 530.3 eV was shifted marginally, demonstrating a minor change in the oxygen environment [15,48] due to the incorporation of Azadirachta indica in the BiOBr‐G. The high‐resolution XPS Br 3d spectra (Figure 2d) shows two distinct peaks at a binding energy of 66.6 eV and 67.5 eV, and were attributed to Br 3d3/2 and Br 3d1/2, respectively [49]. The results were consistent with the XRD analysis.
Figure 2. XPS spectra (a) Survey of the samples, (b) Bi 4f, (c) O 1s, and (d) Br 3d, of BiOBr‐C and BiOBr‐G.
3.4. Morphology Study
The morphology studies of BiOBr‐C and BiOBr‐G were examined by FESEM and TEM. It can be evidently seen in Figure 3a,b that there was a larger difference in the size of the BiOBr‐C and BiOBr‐
G nanoplates. BiOBr‐G had smaller nanoplates when compared to BiOBr‐C. This suggests that
0 200 400 600 800 1000
Intensity (a.u.)
Binding Energy (eV)
BiOBr-G BiOBr-C (a)
524 528 532 536 540
BiOBr-C
Itensity (a.u.)
Binding Energy (eV) O 1s
BiOBr-G (c)
63 66 69 72 75
BiOBr-C
Intensity (a.u.)
Binding Energy (eV) Br 3d1/2 Br 3d3/2
BiOBr-G (d)
154 156 158 160 162 164 166 168
Bi 4f5/2 BiOBr-C
Intensity (a.u.)
Binding Energy (eV) Bi 4f7/2
BiOBr-G (b)
Figure 2. XPS spectra (a) Survey of the samples, (b) Bi 4f, (c) O 1s, and (d) Br 3d, of BiOBr-C and BiOBr-G.
3.4. Morphology Study
The morphology studies of BiOBr-C and BiOBr-G were examined by FESEM and TEM. It can be evidently seen in Figure3a,b that there was a larger difference in the size of the BiOBr-C and BiOBr-G nanoplates. BiOBr-G had smaller nanoplates when compared to BiOBr-C. This suggests that
Materials2018,11, 1273 6 of 17
Azadirachta indicaleaves successfully reduced the size of the plates of BiOBr-G and could enhance the specific surface area.
Materials 2018, 11, x FOR PEER REVIEW 6 of 17
Azadirachta indica leaves successfully reduced the size of the plates of BiOBr‐G and could enhance the specific surface area.
Figure 3. (a,b) FESEM images, (c,d) TEM images, (e,f) HR‐TEM images, and (g,h) EDS images of BiOBr‐C (left) and BiOBr‐G (right).
To study the detailed structure of BiOBr‐C and BiOBr‐G, TEM investigations were carried out as shown in Figure 3c,d, respectively. The TEM images further confirmed the smaller size of BiOBr‐
Figure 3. (a,b) FESEM images, (c,d) TEM images, (e,f) HR-TEM images, and (g,h) EDS images of BiOBr-C (left) and BiOBr-G (right).
Materials2018,11, 1273 7 of 17
To study the detailed structure of BiOBr-C and BiOBr-G, TEM investigations were carried out as shown in Figure3c,d, respectively. The TEM images further confirmed the smaller size of BiOBr-G nanoplates with the addition of internal cavities in comparison to the BiOBr-C nanoplates (Supporting Information, Section S5, Figure S5). To obtain a deeper view, the as-prepared samples were further characterized with HR-TEM as shown in Figure3e,f. Clearly, a highly crystalline pattern was observed with clear lattice fringes in both samples. The continuous lattice fringes with an interplanar lattice spacing of 0.405 nm and 0.281 nm matched well with the (002) and (012) atomic planes of BiOBr.
The existence of the smaller nanoplates and internal cavities of BiOBr-G nanostructures could result in multiple reflections of the irradiated light and subsequently increase the photocatalytic activity [50].
In addition, the chemical composition of the BiOBr-C and BiOBr-G samples were also analyzed by EDS as shown in Figure3g,h, respectively. The results indicate that both BiOBr-C and BiOBr-G contained elements of Bi, Br, and O.
3.5. Specific Surface Area Analysis
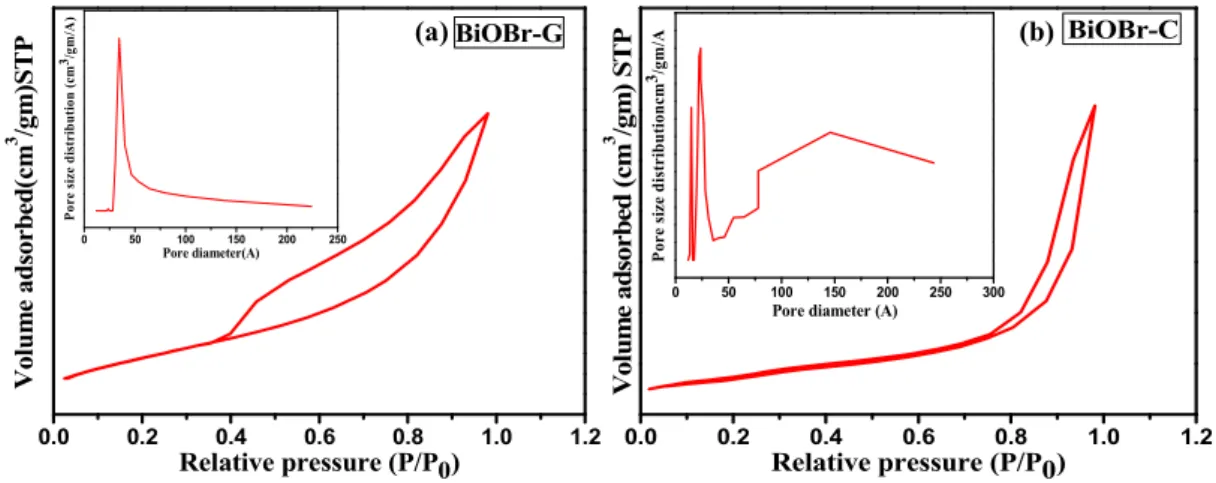
The specific surface area and pore size distribution of the as-prepared BiOBr-G and BiOBr-C samples were calculated by the nitrogen adsorption–desorption study as shown in Figure4a,b. It can be seen that both the photocatalysts exhibited the type IV isotherm with a distinct H3 hysteresis loop at high relative pressure indicating a mesoporous structure according to the IUPAC classification [51,52].
The BET specific surface area and pore volume for BiOBr-C were found to be 13.938 m2/g and 0.039 m3/g, and 79.592 m2/g and 0.116 m3/g for BiOBr-G, respectively. The average Barett–Joyner–Halenda (BJH) pore diameter of the BiOBr-G and BiOBr-C calculated from desorption isotherm study was 2.358 nm and 3.442 nm, respectively. In the case of BiOBr-G, a uniform pore size distribution was observed, in contrast, an abrupt and non-uniform pattern was seen for BiOBr-C.
Clearly,Azadirachta indicaleaves play a key role in enhancing the surface area of BiOBr-G, which was up to six times that of BiOBr-C. The uniform distribution of pore size and higher surface area of BiOBr-G could effectively enhance the area of contact and subsequently, facilitate the reactant species to be transferred, resulting in enhanced photocatalytic activity [53].
Materials 2018, 11, x FOR PEER REVIEW 7 of 17
G nanoplates with the addition of internal cavities in comparison to the BiOBr‐C nanoplates (Supporting Information, Section S5, Figure S5). To obtain a deeper view, the as‐prepared samples were further characterized with HR‐TEM as shown in Figure 3e,f. Clearly, a highly crystalline pattern was observed with clear lattice fringes in both samples. The continuous lattice fringes with an interplanar lattice spacing of 0.405 nm and 0.281 nm matched well with the (002) and (012) atomic planes of BiOBr. The existence of the smaller nanoplates and internal cavities of BiOBr‐G nanostructures could result in multiple reflections of the irradiated light and subsequently increase the photocatalytic activity [50].
In addition, the chemical composition of the BiOBr‐C and BiOBr‐G samples were also analyzed by EDS as shown in Figure 3g,h, respectively. The results indicate that both BiOBr‐C and BiOBr‐G contained elements of Bi, Br, and O.
3.5. Specific Surface Area Analysis
The specific surface area and pore size distribution of the as‐prepared BiOBr‐G and BiOBr‐C samples were calculated by the nitrogen adsorption–desorption study as shown in Figure 4a,b. It can be seen that both the photocatalysts exhibited the type IV isotherm with a distinct H3 hysteresis loop at high relative pressure indicating a mesoporous structure according to the IUPAC classification [51,52]. The BET specific surface area and pore volume for BiOBr‐C were found to be 13.938 m2/g and 0.039 m3/g, and 79.592 m2/g and 0.116 m3/g for BiOBr‐G, respectively. The average Barett–Joyner–
Halenda (BJH) pore diameter of the BiOBr‐G and BiOBr‐C calculated from desorption isotherm study was 2.358 nm and 3.442 nm, respectively. In the case of BiOBr‐G, a uniform pore size distribution was observed, in contrast, an abrupt and non‐uniform pattern was seen for BiOBr‐C. Clearly, Azadirachta indica leaves play a key role in enhancing the surface area of BiOBr‐G, which was up to six times that of BiOBr‐C. The uniform distribution of pore size and higher surface area of BiOBr‐G could effectively enhance the area of contact and subsequently, facilitate the reactant species to be transferred, resulting in enhanced photocatalytic activity [53].
Figure 4. Nitrogen adsorption–desorption isotherms and pore size distribution for (a) BiOBr‐C and (b) BiOBr‐G.
3.6. Optical Absorption Properties
The optical absorption property of a visible light‐driven photocatalyst is a major factor in determining its photocatalytic activity. Figure 5a displays the UV‐vis diffuse reflection spectra (DRS) of BiOBr‐C and BiOBr‐G, respectively. Clearly, the absorption edges of both photocatalysts were positioned in the visible light range (<<410 nm). BiOBr‐G displayed greater absorption and a red shift when compared to BiOBr‐C; this shift could be attributed to the action of the Azadirachta indica leaf extract. The optical absorption region of semiconductors can be evaluated by the energy of band gap (Eg) and analyzed by the following equation:
0.0 0.2 0.4 0.6 0.8 1.0 1.2
Volume adsorbed(cm3 /gm)STP
Relative pressure (P/P0)
BiOBr-G
0 50 100 150 200 250
Pore size distribution (cm
3 /g
m/A)
Pore diameter(A)
0.0 0.2 0.4 0.6 0.8 1.0 1.2
Volume adsorbed (cm3 /gm) STP
Relative pressure (P/P0)
BiOBr-C
0 50 100 150 200 250 300
Pore size distributioncm
3 /g
m/A
Pore diameter (A)
(a) (b)
Figure 4.Nitrogen adsorption–desorption isotherms and pore size distribution for (a) BiOBr-C and (b) BiOBr-G.
3.6. Optical Absorption Properties
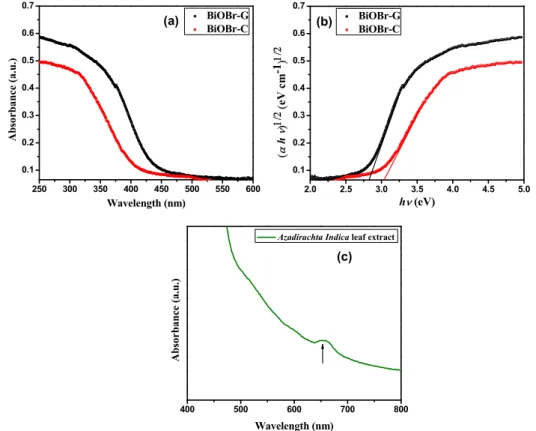
The optical absorption property of a visible light-driven photocatalyst is a major factor in determining its photocatalytic activity. Figure5a displays the UV-vis diffuse reflection spectra (DRS) of BiOBr-C and BiOBr-G, respectively. Clearly, the absorption edges of both photocatalysts were positioned in the visible light range (<<410 nm). BiOBr-G displayed greater absorption and a red shift when compared to BiOBr-C; this shift could be attributed to the action of theAzadirachta indicaleaf
Materials2018,11, 1273 8 of 17
extract. The optical absorption region of semiconductors can be evaluated by the energy of band gap (Eg) and analyzed by the following equation:
αhυ= A(hυ−Eg)n/2 (1)
where Eg,υ, α, and A are the band gap energy, frequency of light, absorption coefficient, and a constant, respectively, for direct transition (n= 1) and for indirect transition (n= 4). The n value was 4 for BiOBr [54]. The Tauc plots of BiOBr-C and BiOBr-G are shown in Figure5b. The Egvalues of BiOBr-C and BiOBr-G were calculated by the extrapolation of these lines to the photon energy axis, and were found to be 3.04 eV and 2.83 eV, respectively. The lower band gap in BiOBr-G facilitated the electronic transitions and visible light response towards the organic pollutants. Furthermore, the UV-visible absorption spectra of the rawAzadirachta indicaleaf extract was evaluated in the wavelength range of 400–800 nm to confirm the presence of phytochemicals in the leaf extract. As shown in Figure5c, the maximum absorbance of the leaf extract was observed in the range of 600–700 nm, which indicated the existence of complex organic molecules carrying different charge centers. Therefore, the phytochemicals in the leaf extract tend to capture more visible light, which can boost the formation of large number of photogenerated electron–hole pairs for higher photocatalytic activity [40,55,56].
Materials 2018, 11, x FOR PEER REVIEW 8 of 17
αhυ = A(hυ − Eg)n/2 (1)
where Eg, υ, α, and A are the band gap energy, frequency of light, absorption coefficient, and a constant, respectively, for direct transition (n = 1) and for indirect transition (n = 4). The n value was 4 for BiOBr [54]. The Tauc plots of BiOBr‐C and BiOBr‐G are shown in Figure 5b. The Eg values of BiOBr‐C and BiOBr‐G were calculated by the extrapolation of these lines to the photon energy axis, and were found to be 3.04 eV and 2.83 eV, respectively. The lower band gap in BiOBr‐G facilitated the electronic transitions and visible light response towards the organic pollutants. Furthermore, the UV‐visible absorption spectra of the raw Azadirachta indica leaf extract was evaluated in the wavelength range of 400–800 nm to confirm the presence of phytochemicals in the leaf extract. As shown in Figure 5c, the maximum absorbance of the leaf extract was observed in the range of 600–
700 nm, which indicated the existence of complex organic molecules carrying different charge centers.
Therefore, the phytochemicals in the leaf extract tend to capture more visible light, which can boost the formation of large number of photogenerated electron–hole pairs for higher photocatalytic activity [40,55,56].
Figure 5. (a) UV‐vis diffuse reflection spectra, (b) Plot of (αhυ)1/2 versus hυ of the BiOBr‐C and BiOBr‐
G, and (c) UV‐vis absorption spectra of the raw Azadirachta indica leaf extract.
3.7. Photocatalytic Performance of BiOBr‐C and BiOBr‐G
To examine the photocatalytic activity of the as‐prepared samples, 100 mL of MO with an initial concentration of 20 mg L−1 was selected as the target dye pollutant. From Figure 6a, it can be observed that no photolysis of MO took place up to 90 min of visible light irradiation in the absence of the photocatalysts, suggesting that MO is chemically stable and has difficulty with self‐photolysis.
However, in the presence of 50 mg of BiOBr‐C and BiOBr‐G, the degradation rate of MO was found to be 62.36% and 80.76% at 90 min, respectively.
Furthermore, to evaluate the maximum degradation of MO, the photocatalytic concentration was varied from 50–125 mg. It can be clearly seen in Figure 6b,c that with an increase in photocatalytic concentration, the degradation of MO was further increased up to 73.45% and 95.91% for BiOBr‐C
250 300 350 400 450 500 550 600
0.1 0.2 0.3 0.4 0.5 0.6 0.7
Absorbance (a.u.)
Wavelength (nm)
BiOBr-G BiOBr-C (a)
2.0 2.5 3.0 3.5 4.0 4.5 5.0
0.1 0.2 0.3 0.4 0.5 0.6 0.7
h eV cm-1
h (eV) BiOBr-G BiOBr-C (b)
400 500 600 700 800
Absorbance (a.u.)
Wavelength (nm)
Azadirachta Indica leaf extract
(c)
Figure 5. (a) UV-vis diffuse reflection spectra, (b) Plot of (αhυ)1/2versus hυof the BiOBr-C and BiOBr-G, and (c) UV-vis absorption spectra of the rawAzadirachta indicaleaf extract.
3.7. Photocatalytic Performance of BiOBr-C and BiOBr-G
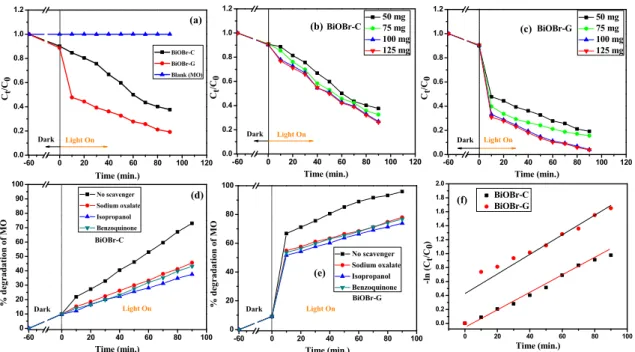
To examine the photocatalytic activity of the as-prepared samples, 100 mL of MO with an initial concentration of 20 mg L−1 was selected as the target dye pollutant. From Figure 6a, it can be observed that no photolysis of MO took place up to 90 min of visible light irradiation in the absence of the photocatalysts, suggesting that MO is chemically stable and has difficulty with self-photolysis.
However, in the presence of 50 mg of BiOBr-C and BiOBr-G, the degradation rate of MO was found to be 62.36% and 80.76% at 90 min, respectively.
Materials2018,11, 1273 9 of 17
Materials 2018, 11, x FOR PEER REVIEW 9 of 17
and BiOBr‐G, respectively. Moreover, the photocatalytic efficiency of BiOBr‐G was found to be nearly 23% more than that of BiOBr‐C.
A batch of experiments was then carried out to examine the active species responsible for MO degradation under light irradiation (>400 nm) by using scavengers (sodium oxalate for h+, isopropanol for ∙OH, and benzoquinone for.O2−). It was observed that the photocatalytic activity was suppressed in all cases as shown in Figure 6d,e, indicating that all three scavengers played a key role in the photo‐oxidation process. Hence, the photocatalytic degradation of MO was expected to occur via oxidation by all the active species‐, which were produced during the following photo‐oxidation process:
BiOBr + hυ
→
BiOBr + h+ + e− (2)O2 + e− → ∙O2− (3)
2H2O + h+ → 2∙OH + 2H+ (4)
MO + h+, .O2− or ∙OH
→
degraded product (5) The photodegradation process of MO was fit with a pseudo‐first order kinetics model as shown in Figure 6f.−ln (Ct/C0) = kt (6)
where Ct is the MO concentration at time t; C0 is the initial concentration of MO; and k is the rate constant. The rate constants for BiOBr‐C and BiOBr‐G were found to be 0.010 min−1 and 0.018 min−1, respectively. The higher rate constant means a lower activation energy (Ea) and higher degradation rate; hence, BiOBr‐G demonstrated much higher photodegradation efficiency towards MO when compared to BiOBr‐C.
Figure 6. Photodegradation efficiency of MO by BiOBr‐C and BiOBr‐G (a) with time, (b) with different concentrations of BiOBr‐C, (c) with different concentrations of BiOBr‐G, (d) Effects of scavengers on MO degradation using BiOBr‐C, (e) Effects of scavengers on MO degradation using BiOBr‐G, and (f) Kinetic linear simulation curves of MO over the samples.
Through the control experiment, it was found that there was no degradation of methyl orange using the leaf extract alone, which suggests that the plant extract alone does not possess any photocatalytic activity (Supporting Information, Section S6).
0 20 40 60 80 100
0.0 0.2 0.4 0.6 0.8 1.0 1.2 1.4 1.6 1.8 2.0
BiOBr-C BiOBr-G
-ln (Ct/C0)
Time (min.) (f)
-60 0 20 40 60 80 100 120
0.0 0.2 0.4 0.6 0.8 1.0 1.2
Light On Ct/C0
Time (min.)
50 mg 75 mg 100 mg 125 mg BiOBr-C
Dark
-60 0 20 40 60 80 100 120
0.0 0.2 0.4 0.6 0.8 1.0 1.2
Light On Dark Ct/C0
Time (min.)
50 mg 75 mg 100 mg 125 mg BiOBr-G
-60 0 20 40 60 80 100
0 10 20 30 40 50 60 70 80 90 100
% degradation of MO Dark
Time (min.)
No scavenger Sodium oxalate Isopropanol Benzoquinone BiOBr-C
Light On
-60 0 20 40 60 80 100
0 20 40 60 80 100
Light On
% degradation of MO
Time (min.) No scavenger Sodium oxalate Isopropanol Benzoquinone
BiOBr-G Dark
(b) (c)
(d)
(e)
-60 0 20 40 60 80 100 120
0.0 0.2 0.4 0.6 0.8 1.0 1.2
Dark Ct/C0
Time (min.)
BiOBr-C BiOBr-G Blank (MO)
Light On
(a)
Figure 6.Photodegradation efficiency of MO by BiOBr-C and BiOBr-G (a) with time, (b) with different concentrations of BiOBr-C, (c) with different concentrations of BiOBr-G, (d) Effects of scavengers on MO degradation using BiOBr-C, (e) Effects of scavengers on MO degradation using BiOBr-G, and (f) Kinetic linear simulation curves of MO over the samples.
Furthermore, to evaluate the maximum degradation of MO, the photocatalytic concentration was varied from 50–125 mg. It can be clearly seen in Figure6b,c that with an increase in photocatalytic concentration, the degradation of MO was further increased up to 73.45% and 95.91% for BiOBr-C and BiOBr-G, respectively. Moreover, the photocatalytic efficiency of BiOBr-G was found to be nearly 23%
more than that of BiOBr-C.
A batch of experiments was then carried out to examine the active species responsible for MO degradation under light irradiation (>400 nm) by using scavengers (sodium oxalate for h+, isopropanol for·OH, and benzoquinone for.O2−). It was observed that the photocatalytic activity was suppressed in all cases as shown in Figure6d,e, indicating that all three scavengers played a key role in the photo-oxidation process. Hence, the photocatalytic degradation of MO was expected to occur via oxidation by all the active species-, which were produced during the following photo-oxidation process:
BiOBr + hυ→BiOBr + h++ e− (2)
O2+ e−→ ·O2−
(3)
2H2O + h+→2·OH + 2H+ (4)
MO + h+,.O2−
or·OH→degraded product (5)
The photodegradation process of MO was fit with a pseudo-first order kinetics model as shown in Figure6f.
−ln (Ct/C0) =kt (6)
whereCtis the MO concentration at timet;C0is the initial concentration of MO; andkis the rate constant. The rate constants for BiOBr-C and BiOBr-G were found to be 0.010 min−1and 0.018 min−1, respectively. The higher rate constant means a lower activation energy (Ea) and higher degradation rate; hence, BiOBr-G demonstrated much higher photodegradation efficiency towards MO when compared to BiOBr-C.
Materials2018,11, 1273 10 of 17
Through the control experiment, it was found that there was no degradation of methyl orange using the leaf extract alone, which suggests that the plant extract alone does not possess any photocatalytic activity (Supporting Information, Section S6).
For the prospect of dye sensitization, a typical colorless pollutant i.e., phenol was also chosen to further assess the photocatalytic performance of BiOBr-C and BiOBr-G (Supporting Information, Section S7).
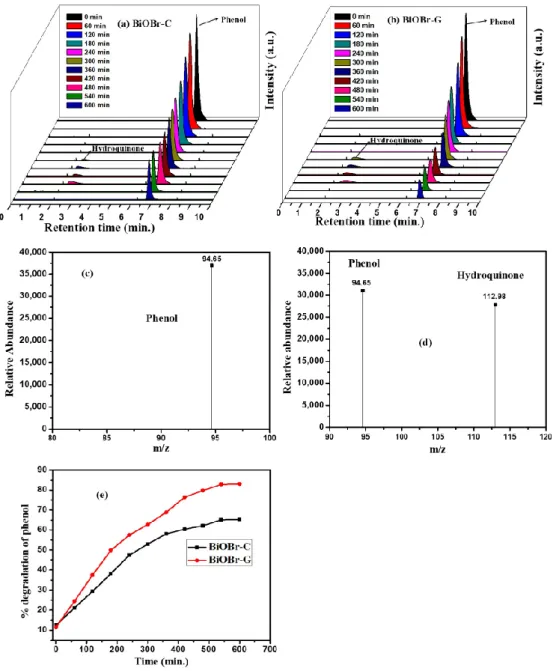
HPLC was used to detect the reaction intermediates throughout the photocatalytic process for the identification of the degraded products that formed during the photocatalytic degradation of phenol. Figure7a,b, display the process of the degradation of Ph, where the decreasing peak of Ph was observed at 6.8 min. A growing peak that originated at 2.5 min appeared from the second Ph sample, which was recorded after 300 min of the irradiation under visible light to the sample. The results reveal the existence of hydroquinone as one of the degraded products of Ph by the as-prepared BiOBr-C and BiOBr-G, which was in accordance with the peak occurring at 2.5 min.
Materials 2018, 11, x FOR PEER REVIEW 10 of 17
For the prospect of dye sensitization, a typical colorless pollutant i.e., phenol was also chosen to further assess the photocatalytic performance of BiOBr-C and BiOBr-G (Supporting Information, Section S7).
Figure 7. HPLC graphs of phenol degradation by (a) BiOBr-C, (b) BiOBr-G. Mass spectra of (c) phenol, (d) phenol and hydroquinone, and (e)% degradation of phenol with time by HPLC data.
3.8. Reusability and Stability of BiOBr-C and BiOBr-G
In order to examine the stability of BiOBr-C and BiOBr-G, the as-prepared samples after photocatalytic activity with MO and Ph were collected via centrifugation. The materials were washed several times with double distilled water and reused in the photocatalytic reactions five times under the same conditions. As shown in Figure 8a,b, both samples displayed high stability during five reaction cycles. In addition, the FESEM images of both samples after the photocatalytic reaction were Figure 7.HPLC graphs of phenol degradation by (a) BiOBr-C, (b) BiOBr-G. Mass spectra of (c) phenol, (d) phenol and hydroquinone, and (e)% degradation of phenol with time by HPLC data.
Materials2018,11, 1273 11 of 17
To gather detailed information about the reaction intermediate, the samples were analyzed under LC-MS/MS. An obvious peak of Ph was exhibited atm/z94.65, while no other peak was observed before irradiation (Figure7c). However, after 300 min of visible light irradiation, a peak atm/z112.98 appeared along with that of phenol as shown in Figure7d. The results confirmed the existence of phenol and hydroquinone, which were consistent with the literature [57,58]. No peak of hydroquinone was evident after 480 min of visible light irradiation, indicating that the carcinogenic and hematotoxic agent related to malignancy in the occupational environments could also be degraded.
Furthermore, Figure7e shows the percent degradation of the phenol by HPLC results, which also matched well with the previous findings under the UV-vis spectrophotometer.
3.8. Reusability and Stability of BiOBr-C and BiOBr-G
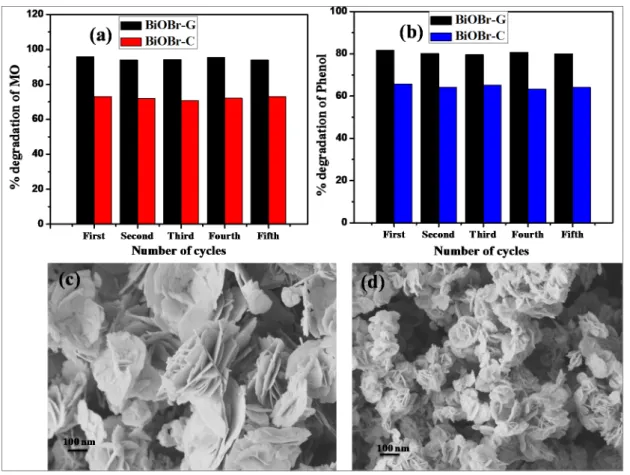
In order to examine the stability of BiOBr-C and BiOBr-G, the as-prepared samples after photocatalytic activity with MO and Ph were collected via centrifugation. The materials were washed several times with double distilled water and reused in the photocatalytic reactions five times under the same conditions. As shown in Figure8a,b, both samples displayed high stability during five reaction cycles. In addition, the FESEM images of both samples after the photocatalytic reaction were examined.
As shown in Figure8c,d, the morphology of the as-prepared BiOBr-C and BiOBr-G remained intact.
Materials 2018, 11, x FOR PEER REVIEW 11 of 17
Figure 7. HPLC graphs of phenol degradation by (a) BiOBr‐C, (b) BiOBr‐G. Mass spectra of (c) phenol, (d) phenol and hydroquinone, and (e)% degradation of phenol with time by HPLC data.
3.8. Reusability and Stability of BiOBr‐C and BiOBr‐G
In order to examine the stability of BiOBr‐C and BiOBr‐G, the as‐prepared samples after photocatalytic activity with MO and Ph were collected via centrifugation. The materials were washed several times with double distilled water and reused in the photocatalytic reactions five times under the same conditions. As shown in Figure 8a,b, both samples displayed high stability during five reaction cycles. In addition, the FESEM images of both samples after the photocatalytic reaction were examined. As shown in Figure 8c,d, the morphology of the as‐prepared BiOBr‐C and BiOBr‐G remained intact.
Figure 8. Recyclability of BiOBr‐C and BiOBr‐G for (a) MO and (b) Ph; FESEM images after five cycles (c) BiOBr‐C, and (d) BiOBr‐G.
Figure 8.Recyclability of BiOBr-C and BiOBr-G for (a) MO and (b) Ph; FESEM images after five cycles (c) BiOBr-C, and (d) BiOBr-G.
3.9. Photocatalytic Degradation Mechanism
Electrochemical studies were conducted to examine the separation of the photogenerated electron-hole pairs. The transient photocurrent response of the as-prepared BiOBr-C and BiOBr-G were recorded for several ON-OFF cycles of light irradiation. As shown in Figure9a, upon UV-visible light irradiation, the photocurrent increased sharply and returned rapidly to its initial state when the
Materials2018,11, 1273 12 of 17
light irradiation was stopped. The photocurrent response was stable, reproducible, and steady during several sporadic ON-OFF cycles. The BiOBr-G displayed a significantly higher photocurrent response compared to the BiOBr-C, indicating that the recombination of the photogenerated electron-hole pairs was efficiently diminished in BiOBr-G.
Materials 2018, 11, x FOR PEER REVIEW 12 of 17
3.9. Photocatalytic Degradation Mechanism
Electrochemical studies were conducted to examine the separation of the photogenerated electron‐hole pairs. The transient photocurrent response of the as‐prepared BiOBr‐C and BiOBr‐G were recorded for several ON‐OFF cycles of light irradiation. As shown in Figure 9a, upon UV‐visible light irradiation, the photocurrent increased sharply and returned rapidly to its initial state when the light irradiation was stopped. The photocurrent response was stable, reproducible, and steady during several sporadic ON‐OFF cycles. The BiOBr‐G displayed a significantly higher photocurrent response compared to the BiOBr‐C, indicating that the recombination of the photogenerated electron‐hole pairs was efficiently diminished in BiOBr‐G.
Electrochemical impedance spectroscopy (EIS) studies were used to examine the characteristics of the charge transfer and recombination processes in the as‐prepared BiOBr‐C and BiOBr‐G materials. As shown in Figure 9b, the diameter of the arc radius on the EIS Nyquist plot of the BiOBr‐
C electrode was larger than BiOBr‐G electrode under the light irradiation, which revealed a lower recombination of photogenerated e−‐h+ pairs in BiOBr‐G compared to BiOBr‐C [59,60].
To further examine the migration, recombination, and charge transfer process in the as‐prepared BiOBr‐C and BiOBr‐G, photoluminescence spectra of both the materials were recorded. It can be seen in Figure 9c that BiOBr‐G exhibited an emission peak at a much lower intensity than BiOBr‐C, which confirmed the successful inhibition of the e−‐h+ pairs recombination in BiOBr‐G. The results of the PL analysis were consistent with the electrochemical studies. Therefore, it can be speculated that the synthesis of BiOBr‐G using Azadirachta indica leaf extract significantly enhanced the photocatalytic activity.
The valence band (VB) and conduction band (CB) of the as‐prepared BiOBr‐C and BiOBr‐G were calculated (Supporting Information, Section S8).
Figure 9. (a) Transient photocurrent response, (b) EIS Nyquist plots, and (c) PL spectra of BiOBr‐C and BiOBr‐G.
0 50 100 150 200 250 300
0.00 0.05 0.10 0.15
Time (s)
Current density (uA/cm
2 )
BiOBr-C BiOBr-G
0 50 100 150 200 250
0 200 400 600 800 1000 1200 1400 1600 1800
-Z'' (Ohm)
Z' (Ohm)
BiOBr-C BiOBr-G (a)
(b)
300 400 500 600
Intensity (a.u.)
Wavelength (nm)
BiOBr-C BiOBr-G
ex= 250 nm
(c)
Figure 9.(a) Transient photocurrent response, (b) EIS Nyquist plots, and (c) PL spectra of BiOBr-C and BiOBr-G.
Electrochemical impedance spectroscopy (EIS) studies were used to examine the characteristics of the charge transfer and recombination processes in the as-prepared BiOBr-C and BiOBr-G materials.
As shown in Figure9b, the diameter of the arc radius on the EIS Nyquist plot of the BiOBr-C electrode was larger than BiOBr-G electrode under the light irradiation, which revealed a lower recombination of photogenerated e−-h+pairs in BiOBr-G compared to BiOBr-C [59,60].
To further examine the migration, recombination, and charge transfer process in the as-prepared BiOBr-C and BiOBr-G, photoluminescence spectra of both the materials were recorded. It can be seen in Figure 9c that BiOBr-G exhibited an emission peak at a much lower intensity than BiOBr-C, which confirmed the successful inhibition of the e−-h+ pairs recombination in BiOBr-G.
The results of the PL analysis were consistent with the electrochemical studies. Therefore, it can be speculated that the synthesis of BiOBr-G usingAzadirachta indicaleaf extract significantly enhanced the photocatalytic activity.
The valence band (VB) and conduction band (CB) of the as-prepared BiOBr-C and BiOBr-G were calculated (Supporting Information, Section S8).
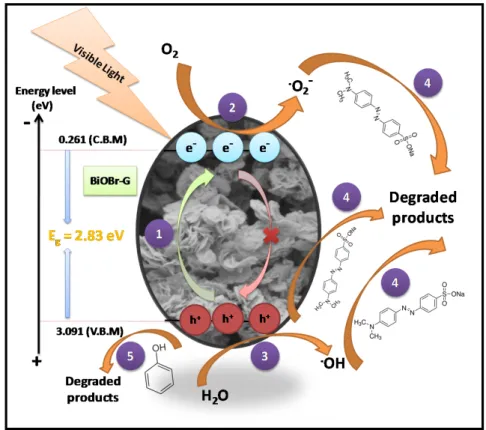
Based on the results obtained from the above discussion and scavenger studies, the photocatalytic degradation mechanism of MO and Ph by BiOBr-G was elucidated as shown in Figure10, respectively.
In step1, the BiOBr-G nanoplates were irradiated by visible light to produce adequate photogenerated