EXPERIMENTAL INVESTIGATION ON OPERATION PARAMETERS OF 3Å MOLECULAR SIEVE DESICCANT COATED TOTAL ENERGY
RECOVERY WHEEL FOR MAXIMUM EFFECTIVENESS
by
Miklos KASSAI * and Laith AL-HYARI
Department of Building Service Engineering and Process Engineering, Budapest University of Technology and Economics, Budapest, Hungary
Original scientific paper https://doi.org/10.2298/TSCI180927012K
The object of this research study was to investigate the maximum effectiveness val- ues of the energy wheel by experimental tests conducted under extreme difference ambient air conditions parameters, different air volume flow rates, and energy wheel rotation speeds. Air temperature and humidity experimental tests were per- formed using a test facility that was developed and installed into the Indoor Air Quality and Thermal Comfort Laboratory of Budapest University of Technology and Economics. Our objective was to get the effectiveness values of sorption coat- ed air-to-air energy recovery wheel for steady-state conditions under different am- bient air (as supply air inlet) conditions. It was found that the sensible effectiveness increases by decreasing the volumetric flow rate through the wheel, and the opti- mum values of the effectiveness were given at the maximum wheel rotation speed based on the tests. As for the latent and total effectivenesses, their characteristics show an increasing trend by decreasing the air volume flow rate, ambient air tem- perature and relative humidity and increasing the wheel rotation speed.
Key words: energy wheel, energy recovery, air handling unit, effectiveness, operation parameters, wheel rotation speed Introduction
The use of energy recovery units incorporated in Air Handling Units in commercial buildings increased significantly in the last 10 years. Rapid enhancement of energy efficiency is essential for a reduction in energy use and promotion of sustainable environment. Accordingly, improving energy performance of the building will significantly reduce the energy consumption [1-3]. Investments in these units are feasible, as it reduces the operating costs and improve more the energy efficiency [4, 5].
Energy recovery units, like the energy wheel, can be implemented in the design to transfer the indoor temperature and humidity (energy) to the incoming outdoor air. Therefore, more outdoor air can be used at a lower energy cost [6-8]. The exchange of indoor air for out- door air represents a considerable wastage of energy, especially places, which need a higher rate of the air change per hour. Total energy recovery wheels transfer both sensible heat and moisture. In cooling mode, the outdoor air is precooled and dehumidified. In heating mode, the transfer of heat and moisture is reversed, as the outdoor air is preheated and pre-humidified [9, 10]. There are many advantages for applying the energy wheel as an energy recovery that
* Corresponding author, e-mail: kas.miklos@gmail.com
includes simultaneous heat and mass transfer, low pressure drop, and available to all ventila- tion system platforms. The disadvantages of the energy wheel application are further cooling/
heating required for supply air, there is possibility of cross-contamination, and it increases maintenance requirements especially under cold climates [11-14].
Previous work by researchers was highlighted in the literature review in order to specify the progress and development on energy recovery wheels.
Simonson and Besant [15] developed a numerical sample in rotating energy wheels and were calculated using the experimental data acquired. The performance of energy wheel was presented for a desiccant coating with a sorption isotherm (molecular sieve) and a linear sorption isotherm (silica gel). The numerical algorithm is changed from sorption to saturation when the air relative humidity exceeds 100% and when the wheel speed reduced the uncon- trolled condensation and frosting reduced.
Experimental investigation had been executed by Sparrow et al. [16] to determine the operating conditions of an energy wheel. The sensible and moisture transfer effectiveness of a wheel device had been measured in a particular experimental facility. They found that the sensible effectiveness decreases by increasing the air volume flow rate and when the flow rates were matchless, higher values of effectiveness were came across. As for the moisture transfer effectiveness, the characteristic trend decreased by increasing flow rate.
Jeong and Mumma [17] developed practical effectiveness correlations for desiccant wheel. During their research linear equations were developed to calculate the desiccant wheel total effectiveness at nominal operating wheel speeds. The silica gel and molecular sieve coated wheel were investigated depending on six factors: outside air and temperature of exhaust air, relative humidity, air velocity, and air volume flow rate. It was found that the air velocity and air volume flow rate contribute highly to sensible and latent effectiveness. The entering outside air and exhaust air showed a small contribution to sensible effectiveness, and higher contribution to latent effectiveness.
Harmati et al. [18] analyzed the annual energy performance of office building located in the center of Belgrade to evaluate the energy recovery units in order to perform the most suitable heating and cooling solution.
Experimental investigations on desiccant wheel material was performed by Angrisani et al. [19] The results obtained by the authors were used to calculate the performance parame- ters as a function of the regenerated temperature, the inlet humidity ratio and the ratio between the regeneration and process air-flow rates. The obtained results indicated that the dehumidifi- cation process has a high influences on desiccant wheel material. It is because of the regener- ation temperature instead of the regeneration air volume flow rate. The difference between the data was lower than 17%. Moreover, the maximum difference was less than about 20%. Low values of the RMSE have been accomplished as well.
In literature, no work was found to investigate the effectiveness of air-to-air energy recovery wheel coated with 3Å molecular sorption sieve under extreme difference ambient air conditions. No research results were found how the different air volume flow rates and different wheel rotation speeds as significant operation parameters influences the value of the sensible, latent and total effectivenesses. In this research work scientific experimental investigation was performed on the effect of different wheel rotation speeds on effectivenesses of sorption wheel under difference ambient air conditions and air volume flow rates. Optimal operating conditions are significantly important to know to reach the highest energy savings during different seasons.
These results can be useful not only for researchers, developers, but also for building service and energy engineers in practice.
Description of the test facility
To achieve or research object an experimental test facility was installed into the Indoor Air Quality and Thermal Comfort Laboratory of Budapest University of Technology and Economics. The schematic diagram of the test facility is shown on fig. 1. A heat plate direct evaporation type exchanger used to generate the desired ambient air by a connected heat pump.
Supply inlet air (as ambient air) was produced from the exhaust air flowing through the direct evaporator which cooled or heated up the air due to a refrigerator. Therefore, more extreme supply input air condition range with less energy demand can be established considering also the available cooling/heating capacity.
Direct evaporator
Sinclair refrigerator
Figure 1. Schematic of the experimental test facility
Humidification of the supply and exhaust air was ensured by mist generators placed inside the air duct for the exhaust air and for the AHU sections for the supply air. The maximum capacity of evaporation unit was 1.8 Lph water for each one. Mist generators were placed into plastic trays. The generated mist adjusted and placed on a floating base while floating on top of the water inside the tray. However, due to their low capacities, the mist humidifiers were incor- porated with ceramic water atomizer nozzles spraying water with rates of 12-20 Lph. This was fed by regulating tap water network pressure placed in points –9 as shown on fig. 1 to reach the desired and extreme relative humidity values.
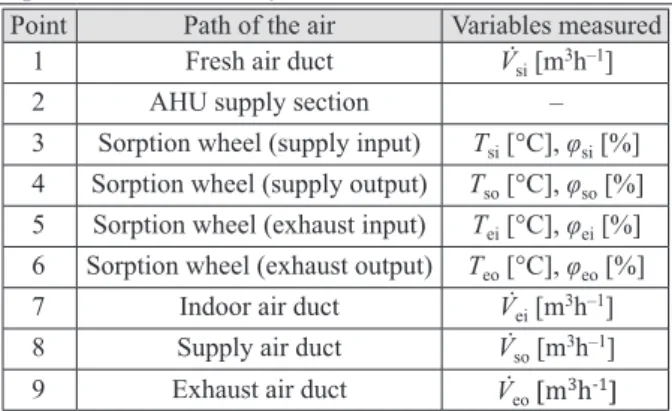
Table 1 represents the path of air depending on to fig. 1 with the variable values measured at each point.
A high-efficiency Enventus [20] energy wheel was installed into the test facility, which transfers sen- sible energy (temperature) and latent energy (humidity) between the two air streams to recover the heat energy and provides proper air quality. The following specifications are given by the wheel producer in tab. 2.
Table 1. Variables measured on the experimental test facility
Point Path of the air Variables measured 1 Fresh air duct V̇si [m3h–1]
2 AHU supply section –
3 Sorption wheel (supply input) Tsi [°C], φsi [%]
4 Sorption wheel (supply output) Tso [°C], φso [%]
5 Sorption wheel (exhaust input) Tei [°C], φei [%]
6 Sorption wheel (exhaust output) Teo [°C], φeo [%]
7 Indoor air duct V̇ei [m3h–1] 8 Supply air duct V̇so [m3h–1] 9 Exhaust air duct V̇eo [m3h-1]
Temperature, Tsi, Tso, and Tei, [°C], and relative humidity, φsi, φso, and φei [%], values were measured with the help of three Testo type humidity and temperature metering instruments, which were placed into the points as indicated on fig. 1. The calibration of these instruments was executed by the producer. These temperature and relative humidity measurements points which were located in the mid-plane of air ducts before and after the energy wheel. The measurements were taken at the same time range to avoid fluctuation of supply side entering air temperature and exhaust side entering air temperature.
A Testo480 data recorder recorded the data measured by the metering devices.
Intervals of 2 seconds were used. The Testo480 data was implemented to the PC through the producer application software. The volumetric flow rate of supply air was measured by another Testo hot-wire anemometer that was placed in the center of the air duct, at point – 8.
Experimental procedure
Experimental tests were conducted under different operating conditions to investigate the sensible, latent and total effectiveness of the sorption rotary wheel. The goal was to main- tain the parameters measured constant as much as possible. Based on test measurements, the exhaust air inlet temperatures range during the test periods was set between Tei = 14-26 °C and relative humidity range of φei = 25-55%.
Regulation of temperature and humidity of fresh air supplied
The supply air temperature, Tsi, was set with the use of Sinclair SCMI-01 type PID controller as indicated in fig. 1 to regulate the power input in DC inverter refrigerator unit, installed to the test facility. The measurements were performed within the widest temperature and relative humidity possible range that the test facility can provide. As it could be regulated between the 10% to 100%, with 10%, intervals, the compressor begins to operate instead of the DC-Inverter compressor. The suitable selection of the P (proportional), I (integral), and D (derivative) parameters of the PID controller provided the minimization of the instability of the system. Therefore the proper PID parameter values were determined under different air condi- tions to obtain the desired temperatures with minimum fluctuations in the PID signals.
Relative humidity of supply input air, φsi [%], was regulated with the help of ultra- sound humidifiers placed into point – 2 as indicated in fig. 1. It was incorporated with two ceramic water atomizer nozzles spraying water that was placed into point – 9 to be able to obtain higher relative humidity range especially for higher volumetric flow rates. The ceramic insert spray nozzles were connected to the tap water network by pipes. The two water nozzles were separately connected to two water outlets. By this way there was no change on the water pressure that would influence the water spray rate.
Regulation of temperature and humidity of exhaust air
The temperature of exhaust air, Tei [°C] was controlled with the use of a portable electrical air heater that was placed in point – 7 in fig. 2. The exhaust air, Tei [°C], could only in- Table 2. Specifications of the investigated sorption wheel
Material of sorption wheel Aluminum
Coating of sorption wheel Molecular sieve 3 Coefficient of thermal
conduction of the wheel 230 W/mK
Geometrical diameter of the wheel 540 mm Geometrical width of the wheel 200 mm Height of corrugated plates in the wheel 1.5 mm Width of corrugated plates in the wheel 3 mm Size of surfaces capable of
heat-, and moisture transfer 170 m2
crease the temperature to the desired range. The humidity of exhaust air, φei [%], was regulated with the help of a two of the mentioned ultrasound humidifiers placed in point – 7 in fig. 1, that helped to increase the humidity to be φei = 2-8% by the turning on every ultrasound humidifier in separate.
Setting the speed of rotation of the wheel
The speed of rotation of the wheel, ω [rpm], was controlled with a potentiometer connected to the control panel. The speed of the wheel deducted from the voltage screen shown on the control panel. The speed-values were obtained through measurement, using a Voltcraft DT30LK type laser tachometer. Based on the results shown in tab. 3. wheel speed could be collected indirectly.
Table 3. Average wheel rotation
speed ω [rpm] – voltage U [V] relation measurement Average rotation
speed [rpm] Voltage
[V] Measurement
duration [min] Average fluctuation of rotation speed [±rpm]
1.998 0.83 10 0.002
6.059 2.87 10 0.002
10.030 4.80 10 0.002
15.088 7.28 10 0.002
20.011 9.69 10 0.002
Test plan
The measurement plan was compiled on the basis of the following aspects:
– The measurement plan was divided into two conditions (Summer and Winter).
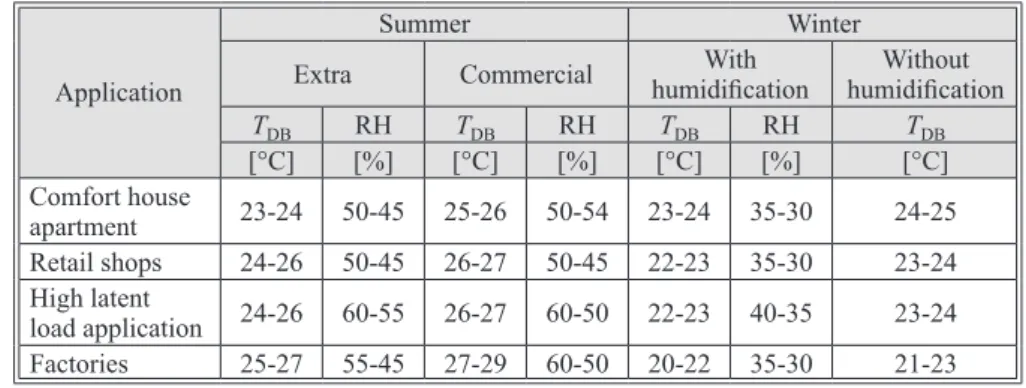
– The indoor ambient conditions was selected as per recommended inside design values in ASHRAE HVAC Application as shown in tab. 4. [21]
Table 4. Recommended inside design conditions for summer and winter operations Application
Summer Winter
Extra Commercial With
humidification Without humidification
TDB RH TDB RH TDB RH TDB
[°C] [%] [°C] [%] [°C] [%] [°C]
Comfort house
apartment 23-24 50-45 25-26 50-54 23-24 35-30 24-25
Retail shops 24-26 50-45 26-27 50-45 22-23 35-30 23-24 High latent
load application 24-26 60-55 26-27 60-50 22-23 40-35 23-24
Factories 25-27 55-45 27-29 60-50 20-22 35-30 21-23
– From the tab. 4 the winter indoor conditions was selected to be as follows:
Tei = 22 °C φei = 35%
While the summer indoor conditions was selected to be as follows:
Tei = 24 °C φei = 45%
– The target values of fresh air temperature were conducted by a step of Tsi = 5 °C in the range of Tsi = –15 to 0 °C measured in winter conditions and Tsi = 5 to 40 °C measured in summer conditions.
– The target values of supply air inlet relative humidity were conducted by a step of φsi = 10%
in the range of φsi = 30 to 100% measured in winter and summer. But the relative humidity of supply inlet air was 100% from Tsi = –15 to 20 °C.
– All target value pairs Tsi [°C] – φsi [%] were measured under different five rotational speeds.
– The input variable parameters for wheel speed was 2, 6, 10, 15, and 20 rpm.
– The input variable parameters for volume flow rate was 400, 600, 800,1000, and 1200 m3/h.
– All measurements were taken under continuous monitoring of the Tei [°C], φei [%], Vso [m3/h] variables, and maintenance these values within the desired range.
– The order of setting wheel speed and fresh air variables shall be the follows:
ω [rpm] → Vso [m3/h] →Tsi [°C] →φei [%].
– The duration of measurements was at least 300 seconds at intervals of 2 seconds.
– The sequence of measurements was determined so that the difference between desired tem- perature and humidity values was minimal. This helped reaching the stationary state of operation faster.
Calculation of the energy wheel effectiveness by using the experimental data
The effectiveness eqs. (1)-(3) proposed by ASHRAE Standard 84 [22] that is used in this work is defined in the equations below as the effectiveness is given as sensible effectiveness (heat transfer process), latent effectiveness (moisture transfer process), and total effectiveness (total energy transfer including heat and moisture transfer).
The methodology is based on air temperature and air humidity measurements on the inlet and outlet parts of the energy wheel under steady-state conditions:
( )
( )
si si so
si ei si ei
Min ,
s m T T
m m T T
ε = −
−
(1)
( )
( )
si si so
si ei si ei
Min ,
L m X X
m m X X
ε = −
−
(2)
( )
( )
si si so
si ei si ei
Min ,
T m h h
m m h h
ε = −
−
(3)
The supply and exhaust mass flow rate are calculated from:
m =ρaV (4)
The sensible effectiveness can be calculated directly as the dry bulb temperature can be substituted in the equation with no need to convert. While the latent and total effectivenesses were calculated after obtaining the values for absolute humidity and specific enthalpy from:
w
a w
0.622 p x= p p
− (5)
,a ( , )
p pZ fg
h C T x C T h= + + (6)
Results and discussion
Using the measured data, the calculated sensible, latent and total effectiveness values of the tested energy wheel at different operation and ambient parameters and correlation be- tween the wheel and different parameters will be presented in this section.
All results were obtained under Tei = 22 °C and φei = 35% constant exhaust air param- eters and in the range of supply air temperature, Tsi, between –15 to 0 °C and at supply relative humidity, RHsi, 100%. In summer condition, the results obtained for Tei = 24 °C and φei = 45%
constant exhaust air parameters and in the range of supply air temperature 5-40 °C and supply air relative humidity varied depending on the experimental process.
Sensible effectiveness vs. dry-bulb temperature
Figure 2 presents the sensible effectiveness vs. dry bulb temperature under different volume flow rates at the maximum wheel speed, ω = 20 rpm. It seems, from trending data, the maximum sensible effectiveness occurs at the lowest air volume flow rate. However, the trend for every volume flow rate shows almost the same values at different temperatures.
60 65 70 75 80 85 90
–20 –15 –10 –5 0
Temperature [°C] Temperature [°C]
(a)
ω = 20 rpm
400 m³/h 600 m³/h 800 m³/h 1000 m³/h 1200 m³/h
70 75 80 85 90
5 10 15 20 25 30 35 40
(b)
εs values at RH = 100 % ,
εs values at RH = 100 % , ω = 20 rpm
400 m³/h 600 m³/h 800 m³/h 1000 m³/h 1200 m³/h
εs [%]
εs [%]
Figure 2. Sensible effectiveness [%] vs. dry bulb temperature [°C] at different air volume flow rate and at ω = 20 rpm; (a) winter condition, (b) summer condition (for color image see journal web site)
Latent effectiveness vs. wheel speed
Latent effectiveness was more sensitive for wheel rotation speed step changing under the same air volume flow rate and different supply inlet temperature conditions, fig. 3. It can
200 4060 10080
20 15 10 6 2
Wheel speed ω [rpm] Wheel speed ω [rpm]
0 ⁰C –5 ⁰C –10 ⁰C –15 ⁰C
200 4060 10080
20 15 10 6 2
40 ⁰C 35 ⁰C 30 ⁰C 25 ⁰C 20 ⁰C 15 ⁰C 10 ⁰C 5 ⁰C εL values at V = 400 m3/h εL values at V = 400 m3/h
(a) (b)
εL [%] εL [%]
Figure 3. Latent effectiveness [%] vs. wheel speed [rpm] at different dry bulb temperature [°C] and at V = 400 m3/h; (a) winter condition, (b) summer condition (for color image see journal web site)
be realized, from trending data, the maximum Latent effectiveness occurs at the highest wheel speed. However, the temperatures show almost the same trend at different wheel speeds.
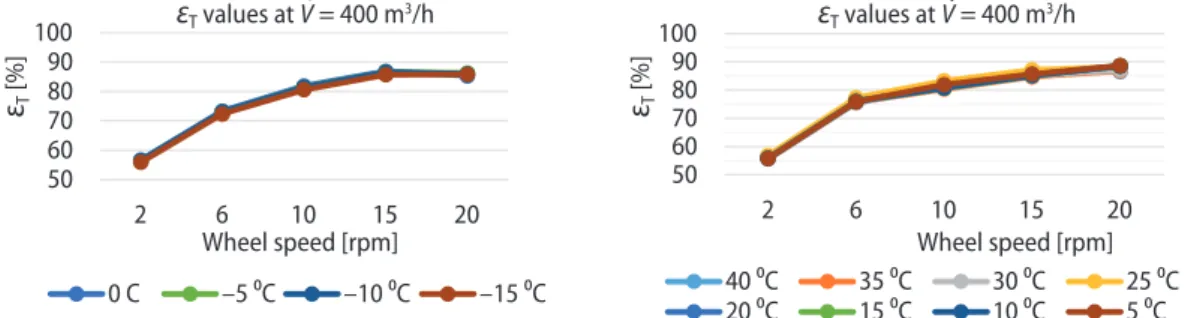
Total effectiveness vs. wheel speed
Figure 4 below presents the total effectiveness vs. wheel speed for different dry bulb temperature at V = 400 m3/s, it can be realized, from trending data, the maximum total effec- tiveness occurs at the highest wheel speed. However, the temperatures show almost the same trend at different wheel speeds.
5060 70 8090 100
20 15 10 6
2 Wheel speed [rpm] Wheel speed [rpm]
0 C –5 ⁰C –10 ⁰C –15 ⁰C
5060 7080 10090
20 15 10 6 2
40 ⁰C 35 ⁰C 30 ⁰C 25 ⁰C 20 ⁰C 15 ⁰C 10 ⁰C 5 ⁰C
εT values at V = 400 m3/h εT values at V = 400 m3/h
εT [%] εT [%]
Figure 4. Total effectiveness [%] vs. wheel speed [rpm] at different dry bulb temperature [°C] and at V = 400 m3/h; (a) winter condition, (b) summer condition (for color image see journal web site) Maximum effectiveness vs. dry-bulb temperature
Figure 5 shows that all the effectivenesses values in the function of dry bulb tempera- ture levels at lowest volume flow rate, V = 400 m3/s, and maximum wheel speed, ω = 20 rpm.
It can be obtained, from trending data that the maximum effectiveness is the latent effectiveness overall at the same operating parameters which reaches almost 94 %.
Figure 5. Maximum effectiveness [%] vs. dry bulb temperature [°C] for effectiveness at ω = 20 rpm and at V = 400 m3/h; (a) winter condition, (b) summer condition (for color image see journal web site)
80 85 90 95
–20 –15 –10 –5 0
Temperature [°C] Temperature [°C]
at RH = 100%, V = 400 m3/h, ω = 20 rpm at RH = 100%, V = 400 m3/h, ω = 20 rpm
80 85 90 95
0 5 10 15 20 25 30 35 40
ε [%] ε [%]
εL εT
εs εs εL εT
(a) (b)
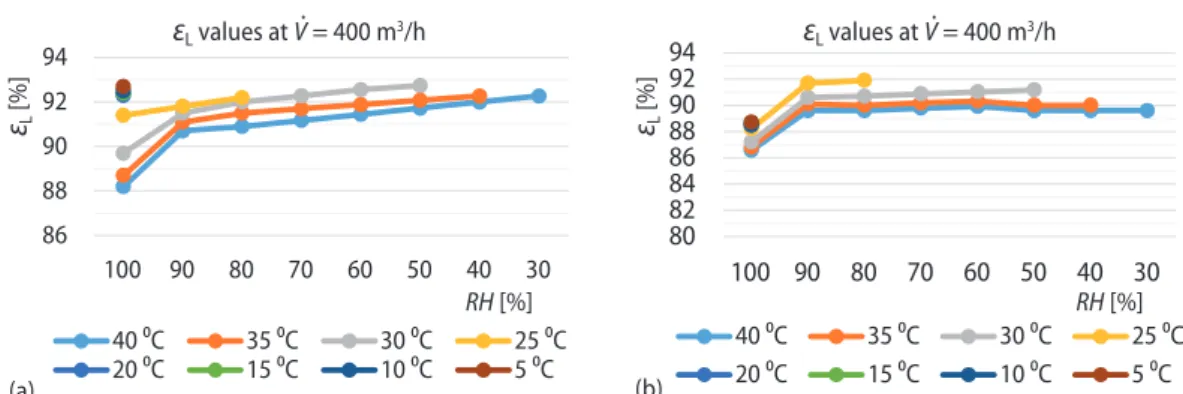
Latent and total effectiveness vs. relative humidity
Figure 6 below presents the latent and total effectiveness in the function of relative humidity for different dry bulb temperature [oC] at V = 400 m3/s air volume flow rate. It can be realized, from trending data that the maximum latent and total effectiveness occurs at the lowest temperature. However, the effectiveness increased when the relative humidity decreased for different temperatures.
Uncertainty in calculating the effectiveness
Kline et al. [23] have presented the method used for estimating uncertainty in exper- imental results as shown in the eq. (7). The method is constructive on precise specifications of uncertainties in the many primary experimental measurements [24]. It is more clear to define the experimental uncertainties, eq. (7) rather than to experimental errors in the experiments.
The analysis combines all the errors in the results
1 2
2 2 2
1 2
n
R x x x
n
R R R
x x x
ω = ± ∂∂ ω +∂∂ ω + …+ ∂∂ ω (7) The temperature and relative
humidity sensors were located in the mid-section in the test facility before and after the energy wheel.
The calibration result for the hu- midity and temperature metering instrument and the hot-wire ane- mometer can be shown in tab. 5.
As sample the description under below shows how the uncertainty in the effectiveness were calculated during our research.
Data observed and measured:
– Volumetric flow rate = 400 m3/h
– Temperature of the supply inlet = –15 oC – Relative humidity of the supply inlet = 100%
– Temperature of the exhaust inlet = 22 oC – Relative humidity of the exhaust inlet = 35%
The eqs. (8)-(10) show the calculations of uncertainty in sensible, latent and total effectivenesses:
s si si so ei
2 2 2 2
s s s s
si si so ei
3.72%
m T T T
m T T T
ε ε ε ε ε
ω = ± ∂∂ ω +∂∂ ω +∂∂ ω +∂∂ ω = ± (8) Figure 6. Latent (a) and total (b) effectiveness [%] vs. relative humidity [%] at different dry bulb temperature [°C] and at V = 400 m3/h (for color image see journal web site)
86 88 90 92 94
100 90 80 70 60 50 40 30
RH [%] RH [%]
40 ⁰C 35 ⁰C 30 ⁰C 25 ⁰C 20 ⁰C 15 ⁰C 10 ⁰C 5 ⁰C
8082 8486 8890 9294
100 90 80 70 60 50 40 30 40 ⁰C 35 ⁰C 30 ⁰C 25 ⁰C 20 ⁰C 15 ⁰C 10 ⁰C 5 ⁰C εL values at V = 400 m3/h εL values at V = 400 m3/h
(a) (b)
εL [%] εL [%]
Table 5. Calibration result of the multifunction instrument Nominal
value Normal
value Measured
value Deviation Uncertainly 40% RH 39.9% RH 40.5% RH 0.6% RH 0.5 % RH
0 °C 0.09 °C 0.3 °C 0.21 °C 0.08 °C
1 m/s 0.98 m/s 1.00 m/s 0.02 m/s 0.05 m/s
L si si so ei
2 2 2 2
L L L L
si si so ei
5.93%
m x x x
m x x x
ε ε ε ε ε
ω = ± ∂∂ ω +∂∂ ω +∂∂ ω +∂∂ ω = ± (9)
T si si so ei
2 2 2 2
T T T T
si si so ei
6.77%
m h h h
m h h h
ε ε ε ε ε
ω = ± ∂∂ ω +∂∂ ω +∂∂ ω +∂∂ ω = ± (10) Figure 7 shows the uncertainties for all the effectiveness values in the function of dry bulb ambient temperature for summer and winter condition at lowest volume flow rate, V = 400 m3/s and maximum wheel rotation speed, ω = 20 rpm.
80 85 90 95 100
-20 -15 -10 -5 0 5 10 15 20 25 30 35 40 45
Temperature [°C]
RH = 100%, V = 400 m3/h, ω = 20 rpm
ε [%]
εL εT
εs
Figure 7. Uncertainty in effectiveness [%] vs. dry bulb temperature [°C] for effectiveness at ω = 20 rpm and at V = 400 m3/h (for color image see journal web site)
Conclusions
In this work, experimental tests were conducted to determine sorption energy wheel performance. The performance of the sorption wheel was evaluated under extreme wide range ambient air condition parameters. The major findings obtained from research work are summa- rized as follows.
y The sensible effectiveness obtained from the experiments showed an increasing trend by decreasing the air volume flow rate under winter and also summer ambient air conditions.
However, the results show almost the same sensible effectiveness values under different dry bulb air temperatures and same wheel rotation speeds.
y It could be obtained that the values of the sensible effectiveness start to reduce when wheel speed reaches a value of 10 rpm and lower.
y The latent and total effectivenesses showed an increasing trend by decreasing the air volume flow rate and increasing the wheel rotation speed.
y The latent and total effectiveness values have a maximum value under wheel speed 20 rpm, and decrease constantly as a function of rpm.
y It can be obtained from all the test data that the peak value of the latent effectiveness reached almost 94%.
y The maximum latent and total effectiveness values were found at the lowest ambient air dry bulb temperatures.
y The latent and total effectiveness values increased by decreasing the relative humidity of the ambient air under different temperature levels.
Acknowledgment
This research project was financially supported by the National Research, Development and Innovation Office from NRDI Fund Grant number: NKFIH PD_18 127907, the Janos Bolyai Research Scholarship of the Hungarian Academy of Sciences, and the UNKP-18-4 New National Excellence Program of the Ministry of Human Capacities, Budapest, Hungary.
Nomenclature
Cp – specific heat capacity, [kJkg–1K–1] h – enthalpy, [kJkg–1]
ṁ – mass flow rate, [kgs–1] p – partial pressure, [Pa]
R – function of a desired result, [–]
T – dry bulb temperature, [°C]
V̇ – volume flow rate, [m3s–1] x – absolute humidity, [kgkg–1] Greek symbols
ρ – density, [kgm–3]
ε – effectiveness of sorption wheel, [–]
ω – wheel rotation speed [rpm]
ωR – uncertainty for R function, [–]
ωx – uncertainty for the independent, [–]
φ – relative humidity, [%]
Subscripts a – moist air ei – exhaust inlet eo – exhaust outlet L – latent VL – supply inlet VR – supply outlet s – snsible T – total w – water vapor
References
[1] Hossein, J., et al., A Comprehensive Review of Backfill Materials and Their Effects on Ground Heat Ex- changer Performance, Sustainability, 10 (2018), 12, pp. 1-22
[2] Jozsef, N., et al., Investment-Savings Method for Energy-Economic Optimization of External Wall Ther- mal Insulation Thickness, Energy and Buildings, 86 (2014), Jan., pp. 268-274
[3] Rasheed, A., et al., Development and Optimization of a Building Energy Simulation Model to Study the Effect of Greenhouse Design Parameters, Energies, 11 (2018), 8, pp. 1-19
[4] Vanesa, V., et al., Effect of Increasing Temperatures on Cooling Systems, A Case of Study: European Greenhouse Sector, Climatic Change, 123 (2014), 2, pp. 175-187
[5] Seyed, A. G., Mazlan, A. W., Heat Transfer Enhancement and Pressure Drop for Fin-and-Tube Compact Heat exchangers with Delta Winglet-Type Vortex Generators, Facta Universitatis, Series: Mechanical Engineering, 16 (2018), 2, pp. 233-247
[6] Robert, S., The Analysis of Two-Phase Condensation Heat Transfer Models Based on the Comparison of the Boundary Condition, Acta Polytechniquea Hungarica, 9 (2002), 6, pp. 167-180
[7] Đorđević, et al., Experimental Investigation of the Convective Heat Transfer in a Spirally Coiled Corru- gated Tube with Radiant Heating, Facta Universitatis Series: Mechanical Engineering, 15 (2017), 3, pp.
495-506
[8] Ali, A., Mazyar, S., Finding a Criterion for the Pressure Loss of Energy Recovery Exchangers in HVAC Systems from Thermodynamic and Economic Points of View, Energy and Buildings, 166 (2018). pp.
426-437
[9] Sahdev, R. K., et al., Forced Convection Drying of Indian Groundnut: An Experimental Study, Facta Universitatis Series: Mechanical Engineering, 15 (2017), 3, pp. 467-477
[10] Hammad, M., et al., Green Building Design Solution for a Kindergarten in Amman, Energy and Build- ings, 76 (2014), June, pp. 524-537
[11] Yau, Y., et al., Heat Pipe Heat Exchanger and its Potential to Energy Recovery in the Tropics, Thermal Science, 19 (2015), 5, pp. 1685-1697
[12] Sanaye, S., et al., Thermal-Economic Multi-Objective Optimization of Heat Pipe Heat Exchanger for Energy Recovery in HVAC Application Using Genetic Algorithm, Thermal Science, 18 (2014), Suppl. 2, pp. S375-S391
[13] Papakostas, K., et al., Energy and Economic Analysis of an Auditorium’s Air Conditioning System With Heat Recovery in Various Climatic Zones, Thermal Science, 22 (2018), Suppl. 3, pp. S933-S943
[14] ***, ASHRAE, Principles of Heating, Ventilating, and Air Conditioning. American Society of Heating, Refrigerating and Air-Conditioning Engineers, Inc. Atlanta, USA, 2005
[15] Simonson, C., Besant, R. W., Heat and Moisture Transfer in Energy Wheels during Sorption, Conden- sation, and Frosting Conditions, Journal of Heat Transfer-Transactions of ASME, 120 (1997), 3, pp.
699-708
[16] Sparrow, E., et al., Heat and Mass Transfer Characteristics of a Rotating Regenerative Total Energy Wheel, International Journal of Heat and Mass Transfer, 50 (2007), 7-8, pp. 1631-1636
[17] Jeong, J., Mumma, S. A., Practical Thermal Performance Correlations for Molecular Sieve and Silica Gel Loaded Enthalpy Wheels, Applied Thermal Engineering, 25 (2005), 5-6, pp. 719-740
[18] Harmati, N., et al., Energy Performance Modelling and Heat Recovery Unit Efficiency Assessment of an Office Building, Thermal Science, 19 (2015), 3, pp. 865-880
[19] Angrisani, G., et al., Experimental Analysis on the Dehumidification And Thermal Performance of a Desiccant Wheel, Applied Energy, 92 (2012), Apr., pp. 563-572
[20] ***, Hoval Enventus, Rotary Heat Exchangers for Heat Recovery in Ventilation Systems, 2nd Handbook for Design, Installation and Operation, 2018
[21] ***, ASHRAE, HVAC Applications, Inc. Atlanta, GA, USA, 2011
[22] ***, ASHARE, ASHARE Handbook: HVAC Systems and Equipment, Inc. Atlanta, GA, USA, 2008 [23] Kline, S. J., et al., Describing the Uncertainties in Single Sample Experiments, Mechanical Engineering,
75 (1953), 1, pp. 3-8
[24] Holman, J. P., Analysis of Experimental Data, in: Experimental Methods for Engineers, McGraw-Hill, London, 2001, pp. 48-60
Paper submitted: September 27, 2018 Paper revised: December 11, 2018 Paper accepted: December 20, 2018
© 2020 Society of Thermal Engineers of Serbia Published by the Vinča Institute of Nuclear Sciences, Belgrade, Serbia.
This is an open access article distributed under the CC BY-NC-ND 4.0 terms and conditions
![Figure 2. Sensible effectiveness [%] vs. dry bulb temperature [°C] at different air volume flow rate and at ω = 20 rpm; (a) winter condition, (b) summer condition (for color image see journal web site)](https://thumb-eu.123doks.com/thumbv2/9dokorg/1323976.106779/7.892.150.744.883.1051/figure-sensible-effectiveness-temperature-different-condition-condition-journal.webp)
![Figure 7. Uncertainty in effectiveness [%] vs. dry bulb temperature [°C] for effectiveness at ω = 20 rpm and at V = 400 m 3 /h (for color image see journal web site)](https://thumb-eu.123doks.com/thumbv2/9dokorg/1323976.106779/10.892.185.738.245.363/figure-uncertainty-effectiveness-temperature-effectiveness-color-image-journal.webp)
