Abstract—Selection of effective teaching methods is a key issue of education. The supply of the available methods is wide. However, recent trends bring the utilization of info-communication technology to the fore, either traditional tools did not disappear. Relevant literature deals with the characteristics and potential advantages of the methods. The study analysis the proper teaching methods based on the opinions of higher education students with a limited scope of the core knowledge of business courses. Experiences of the authors in higher education confirm that a mixed toolset of methods is used, and the changes are slower than the development of the technology.
The paper uses pairwise comparison in the fields of management and strategy, project management, accounting, finance, controlling, marketing and human resource management for identifying the teaching methods considered to be the most useful one.
Business students in the sample usually prefer the non-lecture teaching methods, which are based on their active participation in the class work. Results show that simulations and case studies are the most popular teaching methods, while presentations are considered the most unnecessary one. Listening to lectures generally has a low efficiency based on the responses, but the distribution of the answers suggests not to omit them.
However, students’ opinions are not the only considerable factors in choosing the teaching methods, the effectiveness of the education can be enhanced if the methods are acceptable to the target audience.
Keywords—AHP, business education, Guilford-method, pairwise comparison, teaching methods.
I. INTRODUCTION
ENISTON[1] defined the main goals of higher education as “the development of an informed, responsible citizenry and the preparation of every boy and girl for a personally satisfying and socially useful career”. However, this definition was laid down in 1960, but its meaning is still valid today.
Obviously, the content and the methods are continuously L. Berényi, an associate professor is with the University of Miskolc, Institute of Management Science, Miskolc, Hungary (corresponding author), phone: 036-46-565-111; fax: 036-46-563-441; e-mail: szvblaci@uni- miskolc.hu). His main research fields are quality management and environmental management including higher education development. He took part in establishing the curriculum system of bachelor and master business courses when the Bologna-system was introduced and teaches various management courses in various universities.
N. Deutsch, an associate professor is with the Corvinus University of Budapest, Department of Strategy and Project Management, Budapest, Hungary (e-mail: nikolett.deutsch@uni-corvinus.hu). Her main research fields are strategic management and energy systems. She has a great experience in strategic management an innovation management curriculum development and teaching as well as developing case studies for management education.
changing to meet the recent technological possibilities and the social expectations. Measuring the successfulness of higher education is difficult since the diversity of interested parties.
Students’ level of knowledge, students’ satisfaction, placement rate, employer satisfaction etc. must be considered in accordance with different motivations. Drengenberg and Brain [2] marked productivity measurement in higher education a wicked problem. Exam results (output indicator) can describe the learning outcomes, nevertheless, the expansion of the knowledge (outcome indicator) is more signifcant but more difficult to measure. Literature agrees that value-added must be measured (see [3], [4], [5]). Value-added characteristic of learning depends on various factors including the teachers’
knowledge and approach, choice of teaching methods, students as “raw materials”, organizational background, financial possibilities, IT support etc.
Biggs [6] point out that alignment in the curriculum is important. Butcher et al. [7] highlight the need for clarifying the content of value added, the fitness for purpose and the fitness of purpose.
We believe that we can only talk about success if students can learn useful (usable) content in an effective and enjoyable way. A comprehensive analysis goes far beyond of this study.
Moreover, the understanding of the value and the way of adding value is different in the specializations. Our focus is on choosing the proper teaching method, limited to some subject of the business education. It is not questioned that the curriculum is a core component of knowledge transfer, the methods of this transfer influence the successfulness.
A key component of teaching is to learn how to teach [8]
and teaching the students how to learn [9]. The factors that can help students to learn are as follows [7]:
• Building on foundations: new ideas and knowledge are linked to existing frameworks,
• Guidance on what is to be learned: clear learning outcomes are linked to detailed assessment criteria and grade descriptors,
• Processing activities: opportunities to discuss and rehearse ideas and concepts as they are met,
• Application activities: opportunities to use ideas, and to extend and enhance understanding by being challenged,
• Structure: an organized and sequenced pathway through concepts,
• Feedback on learning: timely information on how
Effective teaching methods in business higher education: a students’ perspective
László Berényi, Nikolett Deutsch
K
successful, or not, learning has been,
• Resources necessary for the task: paper and electronic, and appropriate access to tutors,
• Support structure: help to deal with both academic and pastoral issues as they arise.
II. CHANGES IN THE TEACHING ENVIRONMENT OF THE HIGHER EDUCATION
There are two important influencing factors of the development of teaching methods in the recent decades:
• the structural transformation of the higher education in Europe,
• the push of technological development, especially info- communication technology (ICT).
ICT has an important role in enhancing the European Higher Education Area [10], i.e. the influencing factors above are not independent of each other.
A determinative changing process has launched in the higher education by the Bologna Process [11]. Among others, an achievement of the process and a fundamental concept of the European Higher Education Area is the competence-based description of the requirements and the assignment of performance factors to this [12]. Professional competencies are the knowledge and skills necessary for successful job performance [13]. In this approach, the competency-based approach of teaching allows the social usefulness of the career and it is ready to adopt the changing labor market expectations. A full agreement on the necessary competencies is missing in the literature but communication, foreign language communication and learning to learn is usually mentioned. EU [14] gives a good guidance with summarizing the key competencies for lifelong learning as follows:
• Communication in the mother tongue,
• Communication in foreign languages,
• Mathematical competence and basic competences in science and technology,
• Digital competence,
• Learning to learn,
• Social and civic competences,
• Sense of initiative and entrepreneurship,
• Cultural awareness and expression.
A useful categorization is defined by Gagné [15] who thinks of learning as achieving changes in student behavior by educational experience. These changes have five main areas:
• Intellectual skills: “knowing how” rather than
“knowing that”,
• Verbal skills: knowing names, places, and recalling principles and generalizations,
• Cognitive strategies: managing the mental processes (thinking, memorizing),
• Attitudes: emotions, and the social and cultural approaches to the subject and learning.
• Motor skills: physical tasks of learning, such as being able to tools.
Special competencies for business students can be well described by the requirement of MBA (Master of Business Administration) Programs. A comprehensive model is presented in Table 1.
Categories Characteristics
Problem-solver Effectively carries out all steps of the decision-making process
Applies management principles throughout the process
Recognizes and thoughtfully considers ethical implications when making decisions
Communicator Writes professionally
Delivers professional presentations Communicates with impact Appropriately seeks and utilizes feedback for improvement
Relation-builder Participates actively in team projects and positively impacts outcomes Builds effective relationships with peers, mentors and business partners Prepared
professional
Develops and acts upon a long-term career vision
Understands and leverages professional strengths Understands and overcomes professional weaknesses
Actively seeks out opportunities to build professional expertise Demonstrates professionalism in interactions with others
Table 1 Management Program Competency Model [16]
Further influencing factors are the spread of computer usage and the generalization of the internet. Info-communication tools (ICT) play an increasing role in the renewal of teaching methods. This is reflected in the form of digital learning materials instead of printed books, interactive materials, e- communication between teachers and students etc. Digital pedagogy appeared both in the theoretical and practical literature [17], [18], [19]. Digital learning material can diversify the learning experience and make education possible for learners who have difficulties in attending lectures in a traditional classroom [20]. There are also new opportunities opened collaborative work [21], [22] through ICT tools.
As a result of the technological development mentioned above, communication significantly moved to the digital world. Campbell and Norton [23] compare the possible advantages and disadvantages of face-to-face discussion and asynchronous e-forum discussion based on literature review (Table 2 and Table 3). Blended learning can manage the potential disadvantages and the current limits to development [24], [25].
Face-to-face discussion
A range of group sizes from pairs to whole class
Everyone can observe the whole context from an individual perspective Gesture, body language, facial expression are all clear
Loudness, tone, and speed of discussion are evident
Immediate impact Asynchronous e-
forum discussion
A range of group sizes equal to, or greater than a class
Situated across spaces and times Time to read and reflect before replying Opportunity for deeper thinking and challenging assumptions
People with different learning needs benefit from the opportunity to work at their own pace
Loud voices cannot dominate and a record of insightful contributions is maintained
Opportunity for formative feedback and peer mentoring
Table 2 A comparison of online and face-to-face discussions, advantages [23]
Face-to-face discussion
Situated in a particular space and time Limited thinking time before
Responding makes it easy to lose the focus
People with different learning needs might not engage as easily as others Less confident contributors might say very little, especially if the group includes a more knowledgeable or forceful character
The tutor or leader of the group takes over
Insightful contributions are often lost Asynchronous e-
forum discussion
Working in an e-learning environment challenges thinking and learning styles Time-consuming
Might seem decontextualized and the dialogue flow is less visible
No visual or auditory information from others
Misunderstanding protocols Misunderstanding postings Inappropriate responses Reluctance to respond to tutors Reluctance to challenge others Contributors may feel vulnerable, exacerbated by permanent written record
Threatens privacy
Table 2 A comparison of online and face-to-face discussions, disadvantages [23]
Nicholls [26] highlights that technology can increase the motivation of students, as well as encourage quiet and shy individuals to take part in an online discussion, however, it must be considered that:
• this form of teaching requires more than just transferring the teaching materials to a technological format,
• technology is not cheap, nor is it always reliable;
therefore make sure it is within the module budget [26].
III. ABOUT TEACHING METHODS IN HIGHER EDUCATION There is a great variety of approaches, strategies and styles and methods that may be used in teaching. The proper selection of them depends on the actual situation. Effective teaching requires:
• transforming knowledge of the subject into suitable tasks, which lead to learning,
• learning experience that matches the needs of the students (learners),
• balancing between the students’ chances of success against the difficulty required to challenge them,
• understanding the way students learn and interrelations of other influencing factors [26].
Teaching methods can be distinguished by the participation and control of participants (Figure 1). Small-group teaching methods, case studies, role-playing helps deep and lasting learning [27] through enhancement of classroom involvement.
Fig. 1 A continuum of teaching methods [28]
Teaching methods include lectures, seminars, laboratory work as well as individual/group problem solving, interrogation, debate, feedback and mentoring. A grouping of factors can be based on the following factors [7]:
• student grouping (large or small group, individual, distance or face-to-face),
• role of the tutor (tutor-led or tutor-less; directing,
guiding or monitoring),
• educational technology (supported or mediated by),
• minds-on (theory based) or hands-on (practically based),
• stage in the program (to make ensure progression).
The authors [7] link several methods to expected outcomes (Table 5).
Directs attention Promotes motivations Maintain interest Provides immediate feedback Allows students to progress at own rate
Lecture yes yes/? yes/? no no Tutorial yes yes yes yes yes Seminar yes yes/? ? yes yes/?
Demonstration yes yes/? yes no no Laboratory yes yes/? yes yes yes
Workshop yes yes yes yes yes
Roleplay yes yes yes yes yes
Simulations yes yes yes yes yes Resource-
based learning yes yes yes no yes
Projects yes yes yes no yes
Table 5 Linking methods to student outcomes [7]
Paksi-Petró [29] deals with teacher-oriented, student- oriented and self-directed forms of teaching. Her research shows that self-education has a great importance but the need for conventional forms of teaching still remains. Likewise, Bidabadi et al. [30] offer a mixed approach (student-centered together with teacher-centered) plus educational planning and previous readiness. They concluded that the teaching method must help the students to question their preconceptions and motivates learning by putting them in real situations.
Nowadays, case studies and projects have an increasing role in business education since the simulation of a corporation, a decision situation or else these allow a practice-oriented teaching under classroom conditions. From another aspect, these allow active learning i.e. learning with the active engagement of the students in the learning process [31].
The extensiveness of the sources about teaching and learning methods raises the question whether one best is to find. Relevant literature agrees on that an effective method considers various influencing factors and an effective set of methods is not limited to one single approach. It should also be considered that although higher education teaches innovation, they are much less innovative about their operation. As a result, changes in teaching methods and teaching environment are quite slow and the toolset is mixed.
IV. RESEARCH DESIGN
Among other factors, the effectiveness of a teaching method depends on the students’ perceptions and the attitudes to them as well as the personal approach to learning including schedule and learning style. Our aim is to compare different teaching methods in business education based on students’ evaluation.
We assume that proper methods also depend on the content of the learning material, different topics may show different preference orders. There are five core topics selected for the analysis:
• management and strategy,
• project management,
• accounting, finance and controlling,
• marketing,
• human resource management.
For the comparison, we prepared a specified list of methods based on the curriculum and thematic of subjects of the Hungarian higher education institutions. The selected methods are as follows:
• lectures: listening to lectures,
• problem-solving: samples, numerical calculations solved during seminars,
• presentation: individual presentation or mini-lecture of a given topic,
• case study: solving a case study,
• simulation: solving simulations tasks or presentation with role-playing.
We asked Hungarian business students to compare the methods pairwise, related to the five topics. This means 5 times 10 questions, ordered by the guidance of Ross [32]. The questions are prepared for preference analysis by the Guilford- method [33]. The sample allows calculating:
• the personal level of consistency (K) in the order of the factors (0≤K≤1, where 0 is the complete absence of consistency, 1 is a complete consistency, the latter means the responder has a clear list of preferences),
• group-level preference orders on interval-scale (a limitation of the method is that quantified results between groups are not comparable!) between 0 and 100 (analysis is limited to cases where K=1),
• group level consensus by Kendall’s coefficient of concordance for pairwise comparison (ν) [33]
(analysis is limited to cases where K=1).
Indicators above can describe the level of consistency and the preference orders within a group. Nevertheless, comparison of the results between groups is not feasible since distances of the preference order (weights) are measured on an interval-scale, which includes the value of 0% for the less preferred element and the value of 100% for the most preferred one. Therefore, we applied a solution that helps to cut off the barriers by giving a ratio-scale result. A particular step of the Analytic Hierarchy Process (AHP) by Saaty [34]
offers a solution presenting the preference orders as weights on a ratio scale, which allows the direct comparison of the results between various sub-samples.
AHP method determines the weights of items based on the eigenvector assigned to the highest real eigenvalue of a pairwise comparison result matrix. Rapcsák [35] shows that there is only one positive, non-zero eigenvalue in case of a matrix in Figure 2.
Fig. 2 Preparation of pairwise comparison results for ratio- scale evaluation [35]
Data collection used an electronic survey managed by the EvaSys Survey Automation Software. We sent a link to the questionnaire to business students of various Hungarian universities. Data collection period was between January and March 2018.
V. RESEARCH SAMPLE AND LIMITATIONS A. The composition of the research sample
The research sample consists of the opinions of 120 students, randomly selected from various Hungarian higher education institutions. Data collection period is February and March 2018. It is to note that setting the preference orders by study topics uses filtered samples excluding the respondents with inconsistent orders by topics.
The sample characteristics are as follows:
• gender: 61.7% females and 38.3% males,
• level of studies: 34.2% bachelor level and 65.8%
master level,
• time arrangement: 63.3% full-time students and 36.7%
part-time students,
• progression of studies: 32.5% perform the first-year, 28.3% perform the second-year, 6.6% perform the third or the fourth year of their studies (master programs are 2 years long)
• learning outcomes: 10% excellent, 59.2% good, 30.9%
satisfactory or worse.
The survey included questions about the learning habits.
Respondents take an average of 4.94 hours per week with learning during the study period and 18.46 hours during the exam period. In most cases, there is not a significant difference between full-time and part-time students about the preferred part of the day for learning, except the mornings, which is less
available for part-time students and those who work.
84.1% of the respondents rather prefer book or notes for learning than not, and 56.7% of them judged lectures useful.
Submitting a mid-term essay is not very popular, 67.5% of the sample rather dislike those. Discussion of the lessons learned is important or very important for 50.8% of the respondents, 29.2% is uncertain (marked the middle value on a 5-point scale) and 20% thinks that it is not necessary.
B. Limitations
However, the findings can contribute a better understanding of the selection of proper teaching methods, there are some limitations for discussion and conclusions to note. Despite the random selection, our sample cannot be considered representative which prevents us from generalizing conclusions for the whole population of higher education students in Hungary. A further limitation is that participation in the online survey was entirely voluntary without a supervision while completing it, the results may reflect the reality with a bias.
VI. RESULTS A. Level of consistency
Most of the students have a fully consistent opinion about the preferences among the listed teaching methods. Table 5 summarizes the distribution of consistency levels (K) within the sample that confirms the usability of the sample. For more reliable results, conclusions focus on the cases where K=1.
K= 0.0 0.2 0.4 0.6 0.8 1.0 Management
and strategy 0 1 2 7 12 98
Project
management 1 5 6 9 18 81
Accounting, finance and controlling
1 2 7 10 16 84
Marketing 0 3 4 10 17 86
Human resource management
3 4 9 11 18 75
Table 5: Distribution of consistency-levels (persons) Figure 3 shows the distribution of the average values of the consistency levels that shows that absence of consistency is not concentrated at some students, and opinions are not independent of the subject of the analysis (topic).
Fig. 3 Distribution of the average personal consistency levels
B. Preference orders
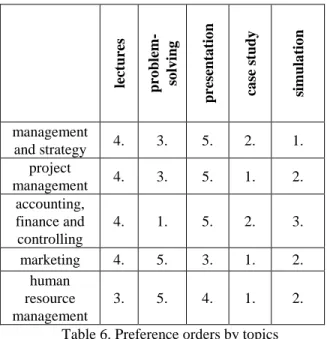
The preference orders by topics are shown in Table 6, detailed results including significance test are presented in Appendix 1. Each preference order is significant, however with the increase of the sample this is only in extreme cases not fulfilled [33].
lectures problem- solving presentation case study simulation
management
and strategy 4. 3. 5. 2. 1.
project
management 4. 3. 5. 1. 2.
accounting, finance and controlling
4. 1. 5. 2. 3.
marketing 4. 5. 3. 1. 2.
human resource management
3. 5. 4. 1. 2.
Table 6. Preference orders by topics
Calculations based on the methods suggested by Guilford [33] (interval-scale) and Saaty [34] (ratio-scale) give a more precise overview of the order of preferences. Ratio-scale evaluation allows the conclusion that e.g. case studies (0.6) are four times better than lectures (0.15) in the education of management and strategy.
Students (n=98) think that management and strategy education primarily needs simulations (Table 7). 72.2% of the markings preferred simulations against any other methods, while 68.9% is the indicator of case studies. Lectures are preferred only in 31.9% of the possible cases.
Project management education (n=81) is thought to be effective by using case studies (preferred in 74.1% of the possible cases) that are followed by simulations (in 67.5% of
the cases). Students feel presentation the least necessary method, which was preferred only in 23.1% of the cases (weights presented in Table 8).
Guilford-scale weight
Ratio-scale weight
lectures 9.13 0.15
problem solving 47.46 0.28
presentation 0.0 0.12
case study 92.05 0.6
simulation 100.0 0.72
Table 7. Preference weights, management and strategy Guilford-
scale weight
Ratio-scale weight
lectures 21.79 0.15
problem solving 55.89 0.30
presentation 0.0 0.10
case study 100.0 0.76
simulation 86.67 0.55
Table 8. Preference weights, project management Learning accounting, finance and controlling topics (n=84) is the most effective by problem-solving through samples and numerical calculations (Table 9). Even though the interval- scale results show that judgment on the effectiveness of case studies and simulations is lagging remarkably behind, ratio- scale results point out a huge difference. Problem-solving is preferred in 95.8% of the possible cases; presentations are kept the less useful (86,9% of the markings thinks is not preferred to any other methods).
Guilford-scale weight
Ratio-scale weight
lectures 26.31 0.03
problem solving 100.0 0.99
presentation 0.0 0.01
case study 50.04 0.08
simulation 41.99 0.05
Table 9. Preference weights, accounting, finance and controlling
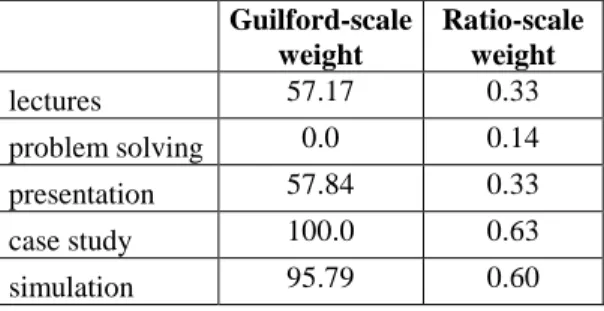
Respondents (n=86) say that marketing education needs primarily case studies (preferred in 65.9% of the cases) and simulations (preferred in 64.2% of the cases). Student presentations (47.9% of the possible markings within marketing) are thought more useful for marketing education than for other topics, and lectures show an analogous result.
Numerical or similar exercises are the least useful based on the students’ judgment (Table 10).
Guilford-scale weight
Ratio-scale weight
lectures 57.17 0.33
problem solving 0.0 0.14
presentation 57.84 0.33
case study 100.0 0.63
simulation 95.79 0.60
Table 10. Preference weights, marketing
Human resource management (n=75) can be effectively taught by case studies (preferred in 77.0% of the cases), while problem-solving represents the other end (78% of the cases prefers other methods). Simulations are preferred in 63.3% of the possible cases. It must be noted, that the results of the topic are the most scattered; only 62.5% of the respondents gave a clear preference order. Weights of preferences are presented in Table 11.
Guilford- scale weight
Ratio-scale weight
lectures 53.31 0.30
problem solving 0.0 0.10
presentation 27.21 0.17
case study 100.0 0.80
simulation 74.24 0.47
Table 11. Preference weights, human resource management
C. Coefficient of concordance
The Kendal’s coefficient of concordance shows the level of consensus on the preference list. Since the minimum value of the coefficient is not fixed, a corrected indicator is calculated, which presents the results expressed as percentages (between 0% and 100%). The indicator is calculated both for the total sample and the filtered samples. The level of consensus is quite low (Figure 4).
Fig 4: Level of concordance (ν(corr.), %)
Filtering the samples by excluding the cases where the personal level of consistency is not clear (K<1) increased the level of consensus. Comparing the topics of the research, students have the most common opinions about the proper teaching methods in case of accounting, finance and controlling. Notwithstanding, results suggest that students have different needs for teaching methods.
VII. CONCLUSIONS
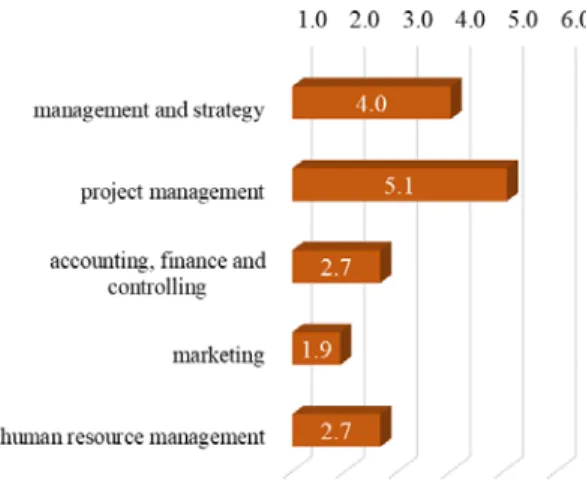
A clear conclusion of the analyses is that business students keep the non-lecture teaching methods, which are based on their active participation in the class work, more useful than the traditional way. Simulations and case studies usually run the lists. Presentations are considered the most unnecessary in three topics. Moreover, listening to lectures has a low efficiency by the responses. We did not formulate a hypothesis, just an assumption that proper methods depend on the content of the learning material, i.e. different topics show different preference orders. It is axiomatic that numerical and other examples are more important for accounting than for strategic management education; we wanted to explore the differences in relative weights. The following graphs (Figure 5 and Figure 6) allows comparing the weights of ratio-scale calculations.
Fig. 5 Comparison of weights by topics
Fig. 6 Comparison of weights by methods
We cannot say that preference orders calculated based on student opinions must imply the immediate rethinking of curriculum and subject objective. Besides, the low values of coefficients of concordance suggest the consideration of local relations and possibilities.
The results show a subordinate role of lectures, but the need for them is various. Checking the ratio between the weights of the case studies (generally preferred method) and the lectures, it can be concluded that students rather need for lectures for learning accounting, finance, controlling, marketing and human resource management than management, strategy and project management.
Fig. 7: Ratio of the weight of case studies divided by the weight of lectures by topics
We find it much more expedient to consider the results of the survey and adapt the preferred teaching methods at the expense of the less favored one, indeed. What is more, a combination of the methods is feasible, e.g. numerical examples as an extension of a case study. The experiences of this study may contribute giving a boost of curriculum development by a baseline.
REFERENCES
[1] H. Keniston, The Goals of Higher Education, Proceedings of the American Philosophical Society, vol. 104, no. 6., pp. 565–569, 1960.
[2] N. Drengenberg, and A., If all you have is a hammer, everything begins to look like a nail – how wicked is the problem of measuring productivity in higher education?, Higher Education Research &
Development, vol. 36, no. 4, pp. 660–673, 2006.
[3] J. M. Cunha, and T. Miller, Measuring value-added in higher education:
Possibilities and limitations in the use of administrative data, Economics of Education Review, vol. 42, pp. 64–77, 2014.
[4] C. F. Balcázar, and H. Ñopo, Broken gears: the value added of higher education on teachers’ academic achievement, High Education, vol. 72, no. 3, pp. 341–361, 2016.
[5] E. Riehl, J. E. Saavedra, and M. Urquiola, Learning and Earning: An Approximation to College Value Added in Two Dimensions, Working Paper 22725. Cambridge, MA: National Bureau of Economic Research, 2016.
[6] J. Biggs, Teaching for Quality Learning at University, Buckingham:
SRHE and Open University Press, 1999.
[7] C. Butcher, C. Davis, and M. Highton, Designing Learning: From module outline to effective teaching. New York: Routledge, 2006.
[8] P. Ramsden, Learning to Teach in higher education, NewYork:
Routledge-Falmer, 2003.
[9] R. J. Wlodkowski, Enhancing Adult Motivation to Learn: A Comprehensive Guide for Teaching All Adults, SanFrancisco: Jossey- Bass, 2011.
[10] M. Kocsis-Baán, Innovative E-learning Solutions “Password” of CEE Region for Entering the European Higher Education Space, Learning Technology Newsletter, vol. 9, no. 1, pp. 20–23, 2007.
[11] B. Wätcher, The Bologna Process: developments and a prospect, European Journal of Education, vol. 39, no. 3, pp. 265–273, 2004.
[12] E. Varga, Z. Szira ,H. Boda, and L. Hajós, A munkaerőpiacon elvárt kompetenciák relevanciájának összehasonlító elemzése a munkáltatók és a felsőoktatásban végzős fiatal munkavállalók aspektusából, Studia Mundi – Economica, vol. 4, no. 1, pp. 82-93, 2017.
[13] L. M. Spencer, S. M. Spencer, Competence at work: Models for superior performance. New York: John Wiley & Sons, 1993.
[14] Recommendation of the European Parliament and of the Council of 18 December 2006 on key competences for lifelong learning (2006/962/EC)
[15] R. M. Gagné, The Conditions of Learning and Theory of Instruction, New York: Holt, Rinehart and Winston, 1985.
[16] S. J. Marsh, and T. R. Bishop, Competency Modeling in an Undergraduate Management Degree Program, Business Education &
Accreditation, vol. 6, no. 2, pp. 47–60, 2014.
[17] A. Benedek (ed.), Digitális pedagógia, Budapest: Typotex, 2008.
[18] M. D. Clark, T. Hergenrader, and J. Rein, Creative Writing in the Digital Age: Theory, Practice, and Pedagogy, New York: Bloomsbury Academic, 2015.
[19] H. Beetham and R. Sharpe, Rethinking Pedagogy for a Digital Age:
Designing for 21st Century Learning, New York: Routledge, 2013.
[20] S. J. Sirkemaa, Digital Learning Environment: Experiences from Using video in Learning Process, International Journal of Education and Information Technologies, vol. 11, pp. 134–137, 2017.
[21] K. G. Guerrero, and B. Y. P. Caviativa Castro, Knowledge management with collaborative technologies of the prosumer teacher, International Journal of Education and Information Technologies, vol. 11, pp. 180–
189, 2017.
[22] J. Howell, Teaching with ICT: Digital Pedagogies for Collaboration and Creativity, Melbourne: Oxford University Press, 2012.
[23] Campbell, and L. Norton, Learning, Teaching and Assessing in Higher Education: Developing Reflective Practice, Exeter: Learning Matters Ltd, 2006.
[24] J. Bonk, and C. R. Graham, The Handbook of Blended Learning: Global Perspectives, Local Designs, San Francisco: Pfeiffer, 2006.
[25] S. Almansoori, and V. L. Akre, Roadmap for enhancing efficiency and effectiveness of Blended E-learning in Higher Education: A UAE Case Study, International Journal of Education and Information Technologies, vol. 10, pp. 176–185, 2016.
[26] G. Nicholls, Developing Teaching and Learning in Higher Education, New York: Routledge-Falmer, 2002.
[27] L. Erickson, C. B. Peters, and D. W. Strommer, Teaching First-Year College Students, San Francisco: Jossey-Bass, 2006.
[28] G. Brown, M. Atkins, Effective Teaching in Higher Education, New York: Routledge, 1988.
[29] Cs. Paksi-Petró, A közigazgatási vezetőfejlesztés oktatásmódszertana, Ph.D. dissertation, National University of Public Service, Budapest, Hungary, 2017
[30] N. S. Bidabadi, A. N. Isfahani, A. Rouhollahi, and R. Khalili, R., Effective teaching methods in higher education: requirements and barriers. Journal of Advances in Medical Education & Professionalism, vol. 4, no. 4, pp. 170–178, 2016.
[31] M. Prince, Does active learning work? A Review of the Research, Journal of Engineering Education. vol. 93, no. 3, pp. 223–231, 2004.
[32] R. T. Ross, Optimum orders for the presentation pairs in the method of paired comparisons, Jorunal of Education Psychology, vol. 25, pp. 375–
382, 1934.
[33] J. Kindler, and O. Papp, Komplex rendszerek vizsgálata: Összemérési módszerek, Budapest: Műszaki Könyvkiadó, 1978.
[34] T. L. Saaty, The Analytic Hierarchy Process. New York: McGraw Hill, 1980.
[35] T. Rapcsák, Többszempontú döntési problémák, Budapest: Budapesti Corvinus Egyetem, 2007.
Appendix 1.
Preference orders and significance test, filtered sample (K=1):
management and strategy
project management
accounting, finance and
controlling marketing
human resource management
lectures 9.126025 21.79499 26.30997 57.17401 53.31317
problem
solving 47.45597 55.89303 100 0 0
presentation 0 0 0 57.84401 27.20822
case study 92.05443 100 50.03665 100 100
simulation 100 86.66567 41.994 95.78858 74.23514
ν 0.207616 0.233333 0.503098 0.136306 0.234162
ν(min) -0.01031 -0.01235 -0.01205 -0.01176 -0.01333
ν(corr.) % 21.57018 24.26829 50.90136 14.63494 24.4239
df 10.31467 10.38295 10.36883 10.35998 10.41471
ꭓ2 215.898 201.7754 438.1249 128.979 188.4421
u 16.3492 15.64269 25.15881 11.62036 14.96048
Preference orders and significance test, the total sample:
management and strategy
project management
accounting, finance and
controlling marketing
human resource management
lectures 10.75569 18.41788 26.10098 63.82068 49.68127
problem
solving 49.8366 54.05711 100 0 0
presentation 0 0 0 60.19895 34.63178
case study 93.33157 100 49.01239 100 100
simulation 100 83.66053 45.43811 95.70714 81.23798
ν 0.119521 0.173613 0.389412 0.119832 0.170476
ν(min) -0.0084 -0.0084 -0.0084 0.0084 -0.0084
ν(corr.) % 20.19167 18.05 39.45 12.7106 17.73318
df 10.25567 10.25567 10.25567 10.25567 10.25567
ꭓ2 246.493 220.3574 481.5099 155.2726 216.5608
u 17.78612 16.57604 26.6154 13.20513 16.39441
The maximum level of Kendall’s coefficient of concordance is 1, on the other hand, the minimum is not fixed, it depends on the number of cases (m): νeven = -1/(m-1) and νodd = -1/m. In order to ensure the comparison, we calculated a corrected coefficient of consensus as [33]:
(1) The significance test is as follows [33]:
where γ shows the sum of values below the main diagonal in the aggregated preference matrix, i.e. the number of non-preferred incidences; n is the number of factors and ꭓ2, df [33]:
(4)
![Table 1 Management Program Competency Model [16]](https://thumb-eu.123doks.com/thumbv2/9dokorg/1387582.114931/2.918.472.846.223.711/table-management-program-competency-model.webp)
![Table 2 A comparison of online and face-to-face discussions, advantages [23]](https://thumb-eu.123doks.com/thumbv2/9dokorg/1387582.114931/3.918.62.456.97.523/table-comparison-online-face-face-discussions-advantages.webp)
![Table 5 Linking methods to student outcomes [7]](https://thumb-eu.123doks.com/thumbv2/9dokorg/1387582.114931/4.918.76.450.243.628/table-linking-methods-student-outcomes.webp)
![Fig. 2 Preparation of pairwise comparison results for ratio- ratio-scale evaluation [35]](https://thumb-eu.123doks.com/thumbv2/9dokorg/1387582.114931/5.918.179.338.240.397/preparation-pairwise-comparison-results-ratio-ratio-scale-evaluation.webp)