Preterm Birth and Low Birth Weight in Hungary’s Szabolcs-Szatmár-Bereg County
2009 – 2012
PhD Theses
Rákóczi Ildikó
SEMMELWEIS UNIVERSITY Ph.D. School of Pathological Sciences
Supervisor: Péter Balázs, MD, Ph. D.
Opponents: Edit Paulik Edit, MD, Ph.D.
Ferenc Paulin, MD, Ph.D.
Chairman of the final examination committee:
Júlia Hajdú, MD, Ph.D.
Members of the final examination committee:
Tímea Tóth, Ph. D.
Ágnes Tóth Kovácsné, Ph. D.
Budapest
2016
2
INTRODUCTION
Preterm birth (PTB=before 37th gestation week) and low birth weight (LBW=under 2,500 grams) are worldwide leading causative factors of the neonatal morbidity and mortality.
Every year 15 million neonates are born preterm and among them die 1.1 million babies due to joining conditions and complications (Lu Gao Bert W. at al.). PTB is defined as a delivery prior to the completed 37th gestational week. However, definition of PTB is more difficult when compared with LBW because the neonate’s weight is an absolutely reliable (Melamed Y, et al.).
The proportion of PTB and LBW represent 8-10% of all liver-births in Hungary.
This high prevalence as a serious epidemic has in epidemic sense negative effect on the whole reproduction of the population. Researches, conducted in the past years, have proven that there is a strong correlation between LBW and chronic illnesses (cardio- vascular diseases, diabetes) that also represent public health hazards. PTB can only partially be traced back to health issues, there are primarily social factors, such as the mother’s educational level, poor housing, unhealthy lifestyle (nutrition, smoking, poor personal/sexual hygiene) in the background.
AIMS
Our primary aim was to clear by means of the epidemiological survey the possible causative factors behind PTB and LBW in Hungary’s less developed north-eastern region specifically in Szabolcs-Szatmár-Bereg County. The knowledge gained will open the door for further ambitions to tailor specific programs adjusted to the local circumstances. They will serve by interventional strategies to lessen the geographic and social class differences before and during the pregnancy in order to improve the health status of the new-born babies.. Because of the significant number and share of the Roma population, concerning also its increased reproductive activity, there was our special aim to analyse the circumstances along the Roma versus non-Roma dichotomy.
Special aims while analysing the potential risk factors of PTB and LBW
PTB and LBW may be caused by independent and closely interrelated factors. Using epidemiological methods, we decided for more thoroughly analysis of possible causative factors as presented below:
3
the pregnant women’s demographic and biometric features (age, family and nutritional status)
neonatal parameters (primarily the gestational time and birth weight and their two- by-two combinations)
pathologic past events in the obstetrical history (earlier PTBs and LBWs plus stillbirths)
pathologic maternal conditions before and during the pregnancy (pre-eminently eclampsia or its imminent risks)
usage of professional care during the pregnancy (first visit at the district nurse of the Maternity and Child Health Service (MCHS), and the number of controls during the pregnant care)
maternal and family socioeconomic circumstances (housing, family income, labour market options)
lifestyle features (nutritional status, coffee and alcohol consumption especially concerning tobacco smoking)
maternal education,
Roma versus non-Roma ethnicity (as effective independent variable related to ther dependent variables of PTB and LBW)
settlement type and availability of health services
METHODS
We performed our questionnaire based research in 2009 and 2012 targeting only the liveborn cases in four north-eastern counties of Hungary. In these theses there are analysed only the data of the County Szabolcs-Szatmár Bereg. Our research was supervised by the Institutional Review Board of the Semmelweis University Budapest (Ref.: TUKEB 103/2009), and it was supported by the Ministry of Health. Data collecting was performed by the precinct nurses of Maternity and Child Health Service.
The questionnaire had two separated parts.
Part I.: filled out by the MCHS nurses, based on medical records. The first block of 16 questions concerned the maternal and neonatal health, the second block (17-28 Qs) the maternal behaviour during the pregnancy (tobacco smoking, coffee and alcohol
4
consumption) plus conditions having emerged during the pregnancy and the puerperal period.
Part II.: contained a series of questions asking parental demographic, biometric and lifestyle characteristics, (age, family status, education, occupation, labour market situation) together with ethnicity of the mother (Roma, non-Roma) There were also registered the housing circumstances (settlement type, living conditions, amenities). Further questions asked the smoking habits of mothers and the social environment alike. Not only the actual situation was concerned but also past tobacco cessation attempts by alone or supported by health professionals..
Statistical analysis was performed by the actual versions of the IBM-SPSS program. Odds ratios were calculated by 95% confidence intervals. Significant differences were accepted at p<0.05 level. In binary logistic and linear regression analyses we used the variables as presented above.
5 RESULTS
Table1: Maternal demographic, biometric and obstetrical characteristics of Roma/non- Roma subsamples in the whole sample (n=8104), of Szabolcs-Szatmár-Bereg County.
Variables Total
n (%)
Non-roma n (%)
Roma n (%)
p-values*
Age in years Mean StD
minimum/maximum
n=7893 27,9 5,98 14/49
n=5400 29,24
5,48 15/49
n=2153 24,49
5,91 14/44
0,001
BMI categories (n, %) Underweight=≤18,49
Normal=18,5–24,9; Overweight=25–
29,9;
Obesity=30
n=7774 799(10,3) 4621(59,4) 1514(19,5) 840(10,8)
n=5301 424(8,0) 3178(60,0) 1080(20,4) 619(11,7)
n=2134 337(15,8) 1248(58,5)
357(16,7) 192(9,0)
0,001
No. of deliveries Primipara Multipara
n=7793 1383(17,7) 6410(82,3)
n=5311 1111(20,9) 4200(79,1)
n=2138 262(12,3) 1876(87,7)
0,001
Method of delivery Sectio caesarea Other
n=6294 1476(23,5) 4818( 76,5)
n=5395 1755(32,5) 3640(67,5)
n=2165 461(21,0) 1701(78,6)
0,001
Marital status Married Other
n=7941 4202(52,9) 3739(47,1)
n=5421 3499(64,5 1922(35,5)
n=2171 488(22,5) 1683(77,5)
0,001
* Pearson Chi-square test was used except the t-test for maternal age
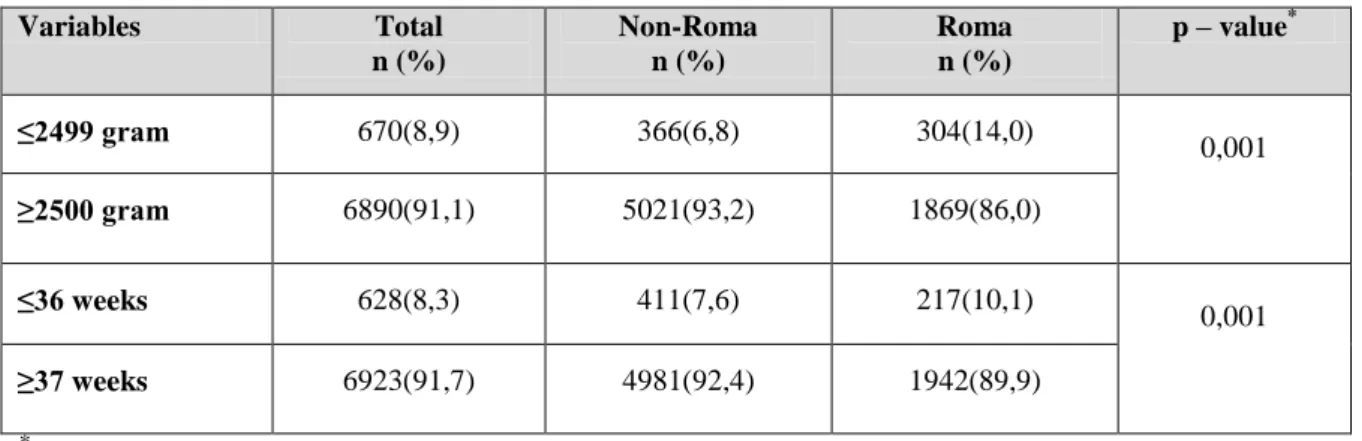
Table 2: LBW and PTB prevalence in the whole sample (n=7999).
Variables Total
n (%)
Non-Roma n (%)
Roma n (%)
p – value*
≤2499 gram 670(8,9) 366(6,8) 304(14,0)
0,001
≥2500 gram 6890(91,1) 5021(93,2) 1869(86,0)
≤36 weeks 628(8,3) 411(7,6) 217(10,1)
0,001
≥37 weeks 6923(91,7) 4981(92,4) 1942(89,9)
*Chi-square test
6
Table 3: LBW and PTB prevalence of neonates in the 2009 (n=4320) and 2012 (n=3669) subsamples
Variables 2009 n (%) 2012n (%) p – value*
≤2499 gram 376(8,7) 325(9,0)
0,723
≥2500 gram 3923(91,3) 3297(91,0)
≤36 week 330(7,7) 325(8,9)
0,052
≥37 week 3941(92,3) 3313(91,1)
* Chi-square test
Table 4: LBW prevalence of Non-Roma and Roma subsamples in the 2009 and 2012 samples
Weight at delivery
Non-Roma Roma
2009 (n=%)
2012 (n=%)
2009 (n=%)
2012 (n=%)
≤2499 gram 199(7,1) 167(6,5) 148(12,8) 156(15,6)
≥2500 gram 1005(87,2) 2413(93,5) 1005(87,2) 864(84,4)
p – value* 0,369 0,099
*Chi-squared test
Table 5: PTB prevalence of Non-Roma and Roma subsamples in the 2009 and 2012 samples
Gestational age in weeks
Non-Roma Roma
2009 (n=%)
2012 (n=%)
2009 (n=%)
2012 (n=%)
≤36 week 200(7,2) 211(8,1) 105(9,2) 112(11,0)
≥37 week 2589(92,8) 2392(91,9) 1040(90,8) 902(89,0)
p – value* 0,196 0,148
* Chi-squared test
7
Table 6: Two-by-two table of gestational weeks and birth weight in the whole sample (n=7854)
Gestational age in weeks
Weight at delivery
p – value*
≤2499 gram ≥2500 gram
≤36 weeks 378(4,8) 271(3,5)
0,001
≥37 weeks 316(4,0) 6889(87,7)
* Chi-squared test
Table 7. Interrelation of gestational weeks and birth weight in Roma (n=2154) and non- Roma (n= 5343) subgroups of the whole sample.
Gestational age in weeks
Non-Roma Roma
≤2499 gram ≥2500 gram ≤2499 gram ≥2500 gram
≤36 weeks 219(4,1) 188(3,5) 142(6,6) 74(3,4)
≥37 weeks 146(2,7) 4790(89,7) 156(7,2) 1782(82,7)
p – value* 0,001 0,001
* Chi-squared test
Table 8: Interrelation of gestational weeks and birth weight in the 2009 (n=4264) and 2012 (n=3590) samples.
Gestational age in weeks
2009 2012
≤2499 gram ≥2500 gram ≤2499 gram ≥2500 gram
≤36 weeks 199(4,7) 129(3,0) 179(5,0) 142(4,0)
≥37 weeks 174(4,1) 3762(88,2) 142(4,0) 3127(87,1)
p – value* 0,001 0,001
*Chi-squared test
8
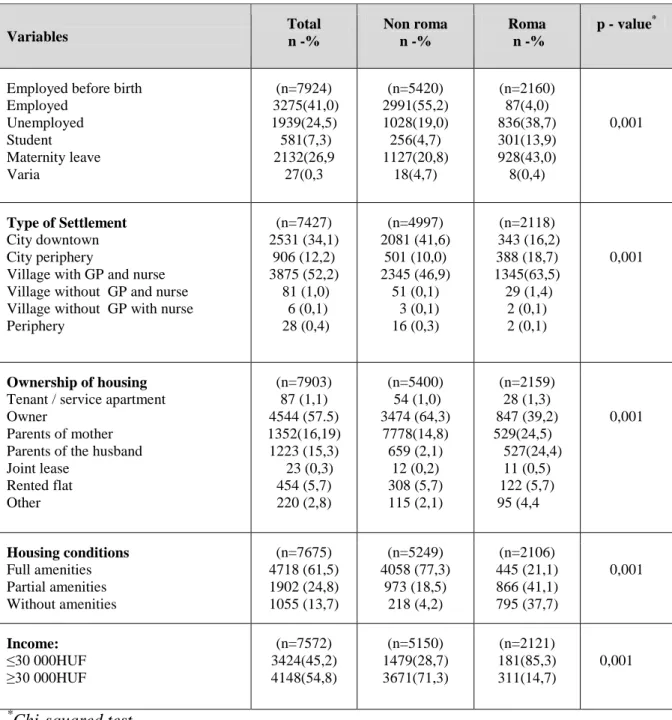
Table 9: Socioeconomic characteristics of mothers in the whole sample of Szabolcs- Szatmár-Bereg County (n=8104) in non-Roma and Roma subgroups
Variables Total
n -%
Non roma n -%
Roma n -%
p - value*
Employed before birth Employed
Unemployed Student Maternity leave Varia
(n=7924) 3275(41,0)
1939(24,5) 581(7,3) 2132(26,9
27(0,3
(n=5420) 2991(55,2) 1028(19,0) 256(4,7) 1127(20,8)
18(4,7)
(n=2160) 87(4,0) 836(38,7) 301(13,9) 928(43,0) 8(0,4)
0,001
Type of Settlement City downtown City periphery
Village with GP and nurse Village without GP and nurse Village without GP with nurse Periphery
(n=7427) 2531 (34,1)
906 (12,2) 3875 (52,2)
81 (1,0) 6 (0,1) 28 (0,4)
(n=4997) 2081 (41,6)
501 (10,0) 2345 (46,9)
51 (0,1) 3 (0,1) 16 (0,3)
(n=2118) 343 (16,2)
388 (18,7) 1345(63,5) 29 (1,4)
2 (0,1) 2 (0,1)
0,001
Ownership of housing Tenant / service apartment Owner
Parents of mother Parents of the husband Joint lease
Rented flat Other
(n=7903) 87 (1,1) 4544 (57.5) 1352(16,19) 1223 (15,3) 23 (0,3)
454 (5,7) 220 (2,8)
(n=5400) 54 (1,0) 3474 (64,3)
7778(14,8) 659 (2,1)
12 (0,2) 308 (5,7) 115 (2,1)
(n=2159) 28 (1,3) 847 (39,2) 529(24,5)
527(24,4) 11 (0,5) 122 (5,7) 95 (4,4
0,001
Housing conditions Full amenities Partial amenities Without amenities
(n=7675) 4718 (61,5) 1902 (24,8) 1055 (13,7)
(n=5249) 4058 (77,3)
973 (18,5) 218 (4,2)
(n=2106) 445 (21,1) 866 (41,1) 795 (37,7)
0,001
Income:
≤30 000HUF
≥30 000HUF
(n=7572) 3424(45,2) 4148(54,8)
(n=5150) 1479(28,7) 3671(71,3)
(n=2121) 181(85,3) 311(14,7)
0,001
*Chi-squared test
9
Table 10: Socio-demographic features of the entire maternal sample in Szabolcs-Szatmár- Bereg County (n=8104) in non-Roma and Roma subgroups.
Variables Total
n -%
Non-roma n -%
Roma n -%
p - value*
Education
<8 basic classes 8 basic classes Vocational training Graduation
Graduation plus Bachelor degree Master degree
(n=7935) 65(8,2) 2333(29,4 1444(18,2) 1000(12,6) 892(11,2) 1168(14,7)
440(14,7)
(n=5423) 98(1,8) 879(16,2) 1151(21,1)
921(17,0) 844(15,6) 1112(20,5)
418(7,7)
(n=2171) 545(25,1) 1376(63,4)
211(9,7) 26(1,2)
9(0,4) 3(0,1) 1(0,0)
0,001
Coffee during pregnancy Consumption: yes
Consumption: no
(n=7961) 4267(59,6) 3694(46,4)
(n=5426) 2757(50,8) 2669(49,2)
(n=2176) 1333(61,3)
843(38,7) 0,001
Tobacco smoking during pregnancy
cessation during pregnancy
(n=7955) 1722(21,6) 6233(78,4)
(n=5425) 687(12,7) 4738(87,3)
(n=2173) 975(44,9)
1198(55,1) 0,001 ETS during the pregnancy
Yes No
(n=5806) 1698(30,3) 3908(69,7)
(n=3739) 735(19,7) 3004(80,3)
(n=1694) 898(53,0)
796(47,0) 0,001
* Chi-squared test
Table 11: Average differences of birth weights and gestational times of non-Roma and Roma neonates in deep poverty and all other income categories
Deep poverty (3424/45,2)
Variables Non-Roma Roma Difference p-value*
Birth weight
in gram 3444,3 2966,9 -177 0,001
Gestational
age in weeks 38,6 38,3 -0,25 0,001
Deep poverty vs. others (4148/54,8)
Birth weight
in gram 3296,9 2997,6 -299 0,001
Gestational
age in weeks 38,7 38,3 -0,38 0,001
Total
(7572/100,0)
Birth weight
in gram 3255,97 2976,7 -279 0,001
Gestational
age in weeks 38,68 38,35 -0,326 0,001
* t-probe
10
Table 12: Occurance of symptoms and diseases during the pregnancy in the whole sample (n=8104) and non-Roma (n=5529) and Roma subsamples (n=2201).
Variables: yes/no Total (%) Non-Roma (%) Roma (%) p-value*
Oedema 1475/5905
(20,0/80,0)
1024/3958 (20,6/79,4)
393/1655
(19,2/80,8) 0,191
Proteinuria 475/6904
(6,4/93,6)
266/4712 5,3/94,7
184/1864
(9,0/91,0) 0,001
Hypertonia 569/6808
(7,7/92,3)
415/4562 (8,3/91,7)
125/1927
(6,1/93,9) 0,001 Bleeding/convulsion (≤12 weeks) 592/6787
(8,0/9,2)
398/4580 (8,0/92,0)
166/1882
(8,1/91,9) 0,877 Bleeding/convulsion (>12 weeks) 584/6795
(17,9/92,1
375/4603 (7,5/92,5)
180/1868
(8,8/91,2) 0,76
Parodontosis 684/6693
(9,3/90,7)
492/4485 (9,9/90,1)
150/1897
(7,3/92,7) 0,001
Caries 1023/6354
(13,9/86,1)
611/4366 (12,3/87,7)
368/1679
(18,0/82,0) 0,001
Varicous veins 608/6770
(8,2/91,8)
428/4549 88,6/91,4)
143/1905
(9,0/93,0) 0,024
Opstipatio 856/6523
(11,6/88,4)
702/4276 (14,1/85,9)
112/1936
(5,5/94,59 0,001
Anaemia 3220/4157
(43,6/56,4)
1879/3098 (37,8/62,2)
1230/812
(60,1/39,9) 0,001
Vaginal infections 1642/5737
(22,3/77,7)
1086/3892 (21,8/78,2)
462/1586
22,6/77,4) 0,495
Urinary infections 959/6420
(13,0/87,0)
499/4484 (9,9/90,1)
410/1638
(20,0/80,0) 0,001
Respiratory diseases 539/6899
(7,3/92,7)
364/4613 (7,3/92,7)
137/1911
(6,7/93,3) 0,356
* Chi-squared test
11
Table 13: Symptoms and diseases in the deep poverty subsample (n=3289) during the pregnancy in the whole population and non-Roma (n=1479) and Roma (n=1810) subgroups.
Variables: yes/no Total (%) Non-roma (%) Roma (%) p-value*
Oedema 619/2594
(19,2/80,8)
273/1105 (19,8/80,2)
323/1381
(19,0/81,0) 0,550
Proteinuria 232/2983
(7,2/92,8)
75/1302 (5,4/94,6)
152/1552
(8,9/91,1) 0,001
Hypertonia 208/3005
(6,5/33,5)
105/1270 (7,7/92,3)
95/1608
(5,5/94,4) 0,018 Bleeding/convulsion (≤12 weeks) 235/2980
(7,3/92,8)
89/1288 (6,5/93,5)
135/1569
(7,9/92,1) 0,121 Bleeding/convulsion (>12 week) 269/2946
(8,4/91,6)
119/1258 (8,6/91,4)
137/1567
(8,0/92,0) 0,547
Parodontosis 269/2944
(8,4/91,6)
132/1244 (9,6/90,4)
119/1584
(7,0/93,0) 0,009
Caries 555/2658
(17,3/82,7)
232/1144 (16,9/83,1)
300/1403
(17,6/82,4) 0,581
Varicous veins 243/2971
(7,6/92,4)
127/1249 (9,2/90,8)
107/1597
(6,3/93,7) 0,002
Opstipatio 235/2980
(7,3/92,7)
142/1235 (10,3/89,7)
83/1621
(4,9/35,1) 0,001
Anaemia 1723/1491
(53,6/46,4)
649/728 (47,1/52,9)
1026/677
(60,2/39,8) 0,001
Vaginal infections 737/2478
(22,9/77,1)
308/1069 (22,4/77,6)
395/1309
(23,2/76,8) 0,593
Urinary infections 534/2681
(16,6/83,4)
173/1204 (12,6/87,4)
339/1365
(19,9/80,1) 0,001
Respiratory disease 193/3021
(6,0/94,0)
78/1298 (5,7/94,3)
104/1600
86,1/97,9) 0,611
* Chi-squared test
12
Table 14: Time of the started care at the MCHS and frequency of controls in the whole sample (n=8104) and non-Roma (n=5529) and Roma (2201) subgroups.
Variables: yes/no Total Non-Roma Roma p-value*
Started care Elemszám Mean StD
minimum/maximum
7447 11,41 4,547 4-39
5304 10,74 3,945 1-38
2143 13,04 5,401 4-39
0,001
Number of controls Elemszám
Mean StD
minimum/maximum
7493 10,18 3,443 0-34
547 10,46 3,284 0-34
2108 9,57 3,744
1-32
0,001
* Chi-squared test
Table 15: The impact of demographic and socioeconomic maternal variables on PTB computed in binary logistic regression model.
Variables
PTB
EH 95% CI p-value
Non-Roma vs. Roma 1,11 0,85-1,46 0,442
Age < 17 years vs. others 0,70 0,70-0,38 0,025
BMI underweight vs. others 1,38 1,05-1,84 0,024
Health visitor met: ≤5 /≥6 3,38 2,59-4,42 0,001
Education basic vs. more 1,39 1,03-1,87 0,029
Non-married vs. married 0,88 0,71-1,09 0,267
Unemployed vs. employed 0,96 0,74-1,26 0,788
Urban/non-urban housing 0,90 0,74-1,10 0,327
Without amenities/others 0,74 0,55-0,99 0,041
Deep poverty vs. others 0,85 0,65-1,10 0,226
Smoking during pregnancy Y/N 1,69 1,33-2,16 0,001
ETS during the pregnancy/Y/N 1,04 0,84-1,28 0,71
13
Table 16: Comparison of average birth weights of at-term neonates (37-42 gestational weeks, n=7253) by dichotomous maternal variables.
Variebles
Average difference
Standard
error 95%CI p-value
Non-Roma vs. Roma 261,82 12,05 285,45-238,19 0,001
Age < 17 years vs. others 311,44 32,90 375,93-246,94 0,001
BMI underweight vs. others 236,22 18,25 272,00-200,44 0,001
Non-married vs. married 172,54 11,16 194,43-150,66 0,001
Multipara/primipara 7,90 14,64 36,61-20,82 0,590
Education basic vs. more 259,26 10,99 280,81-237,72 0,001
Unemployed vs employed 166,74 11,02 188,35-145,13 0,001
Deep poverty vs. others 206,79 11,06 228,48-185,10 0,001
Amenities: yes/no 251,44 16,05 282,91-219,97 0,001
Smoking during pregnancy Y/N 322,88 13,03 348,43-297,33 0,001
Table 17: Linear regression model of at-term neonates’ (37-42 gestational week) birth weights along the variables of the Table 16.
Variables Average
difference
Standard
error 95%CI p-value
Non-Roma vs. Roma 75,10 17,76 109,92-40,29 0,001
Age < 17 years vs. others 132,15 34,16 199,11-65,18 0,001
BMI underweight vs. others 157,92 19,38 195,92-119,93 0,001
Non-married vs. married 43,83 13,45 70,20-17,45 0,001
Multipara/primipara 60,95 15,73 91,80-30,11 0,001
Education basic vs. more 87,12 18,12 122,64-51,60 0,001
Unemployed vs employed 24,01 15,29 5,96-53,97 0,116
Deep poverty vs. others 24,46 15,73 55,29-6,38 0,120
Amenities: yes/no 48,31 18,88 85,31-11,31 0,111
Smoking during pregnancy Y/N 228,93 14,68 259,50-198,35 0,001
14 CONCLUSIONS
In our study period the average age of mothers delivered with live-born babies was 27,9 years (StD±5,9). The same outcome was 29.2 years (StD±5.4) in the non-Roma and 24.4 years (StD±5,91) in the Roma population. Concerning maternal tobacco smoking, 44.9%
of pregnant Roma women smoked on daily base during the pregnancy opposed to 12.7%
of the non-Roma subsample, which increased significantly the chance of PTB (OR=1.69 95%CI=1.33-2.16). Additionally, we registered low educational level, unhealthy lifestyle and low family income.
In the binary logistic model PTB was significantly interrelated with undernutrition measured by BMI (OR=1.38; 95%CI=1.05-1.84), low educational level (OR=1.39;
95%CI=1.03-1.87) and less than 5 visits at the MCHS (OR=3.38; 95%CI=2.59-4.44).
Our linear regression model shows the interrelation of variables with impact on the fetial growth as the greatest impact was realized by tobacco smoking during the pregnancy (-228,9 g) followed by the low maternal BMI value (-157,9 g). The role of Roma ethnicity went back to -75,1 gram indicating clearly that being Roma may not be considered as a firm independent variable.
The result gained show that PTB and LBW are only partly due to the health status.
The leading factors are low maternal education, unfavourable living conditions, and bad habits (nutrition, tobacco smoking) Studies published recently indicate that there are interrelations between LBW and specific conditions (cardiovascular diseases, diabetes) of the adult population.
We need complex programs aiming specifically the high risk groups of pregnant women and implementing these programs must consider the collaboration of vulnerable individuals and populations. PTB and LBW prevention must be based on the early recognition of dangers and risk factors. Identification of these circumstances and their impacts on the pregnancy and discovery of thus far unknown interrelations will provide a firm base for improving the obstetrical outcomes in maternal and neonatal terms alike.
15
BIBLIOGRAPHY OF THE CANDIDATE'S PUBLICATIONS
1. Rákóczi I, Fogarasi-Grenczer A, Takács P, Balázs P.(2016) The impact of
secondhand smoke on neonatal biometric outcomes and gestational age in Hungary.
New Medicine ,20:37-41.
2. Balázs P, Fogarasi-Grenczer A, Rákóczi I, KL. Foley.(2015) A koraszülés epidemiológiája Északkelet-Magyarországon Gyermekgyógyászat, 66:166-172.
3. Rákóczi I, Fogarasi-Grenczer A, Balázs P. A várandósság alatt dohányzó nők szocio- ökonómiai hátterének jelentősége a leszokás támogatásában Védőnő, 24: 2014; 28-31.
4. Balázs P, Rákóczi I, Grenczer A, Foley KL(2014). Roma újszülöttek testtömege:
biomedicinális és szociális tényezők hatása, Orvosi Hetilap,155: 954–961.
5. Balázs P, Rákóczi I, Grenczer A, Foley KL.(2014) Birth weight differences of Roma and non-Roma neonates - public health implications from a population based study in Hungary". Cent. Eur. J. Public Health, 22: 24-28.
6. Balázs P, Grenczer A, Rákóczi I, Foley KL.(2014). Smoking Cessation During Pregnancy Among Roma and Non-Roma Women in Hungary’s Underdeveloped Regions. Psychology Research, 4: 345-353.
7. Balázs P, Rákóczi I, Grenczer A, Foley KL. (2012)Risk factors of preterm birth and low birth weight babies among Roma and non-Roma mothers: a population-based study. Eur. J. Public Health, 23:480-485.
8. Balázs P, Rákóczi I, Grenczer A, Foley KL.(2012) Várandósok egészségi állapota Magyarországon, roma és nem roma populációban végzett epidemiológiai kutatás alapján. Népegészségügy, 9: 253-263.
9. A Fogarasi-Grenczer, I Rákóczi, P Balázs, KL.(2012) Foley: Socioeconomic factors and health risks among smoking women prior to pregnancy in Hungary. New Medicine, 16:45-51.
10. Balázs P, Foley KL, Grenczer A, Rákóczi I. (2011)Roma és nem-roma népesség egyes demográfiai és szocioökonómiai jellemzői a 2009. évi szülészeti adatok alapján. Magyar Epidemiológia, 8: 67-75.
11. Foley KL, Balazs P, Grenczer A, RákócziI.(2011)Factors Associated with Quit Attempts and Quitting among Eastern Hungarian Women who Smoked at the Time of Pregnancy. Cent. Eur. J. Public Health, 19:63-66.
16
12. Fogarasi-Grenczer A, Balázs P, Rákóczi I.(2011) Az idő előtti születés egyes kockázati tényezőinek bemutatása Vas és Szabolcs-Szatmár-Bereg megyében.
Magyar Nőorvosok Lapja, 74: 5-10.
13. Balázs P, Foley KL, Rákóczi I, Grenczer A.(2010) Koraszülő roma és nem roma nők összehasonlítása Szabolcs-Szatmár-Bereg megyei adatok alapján. Nőgyógyászati és Szülészeti Továbbképző Szemle, 12: 138-145.
UNRELATED PUBLICATIONS
1. Rákóczi I. Iskola-egészségügyi gondozás. In:Rantalné Szabó Márta (szerk.), Egészségügyi Felsőoktatási Záróvizsga tesztkérdés gyűjtemények, Általános Védőnői Ismeretek Medicina Könyvkiadó Zrt. Budapest, 2010:130-165.
2. Rákóczi I. Iskola-egészségügy. A védőnő szerepe az iskola-egészségügyi ellátásban.
,,Tudásalapú gazdaság és életminőség” A ,,Magyar Tudomány Napja 2004”
alkalmából rendezett Szabolcs-Szatmár-Bereg megyei Tudományos konferencia anyagának bemutatása. In:Galó Miklós, Vass Lajosné (szerk.), Szabocs-Szatmár- Bereg Megyei Tudományos Közalapítvány. Nyíregyháza, 2004:529-531.