Importance of spatial visualization skills in Hungary and Turkey: Comparative Studies
Rita Nagy-Kondor
University of Debrecen, Faculty of Engineering, Hungary rita@eng.unideb.hu
Submitted October 5, 2014 — Accepted December 18, 2014
Abstract
The goal of this paper is to review research results and compare spatial abilities of prospective elementary mathematics teachers from Hungary and Turkey. The tests in a way that it contained the important components of the spatial ability (imaginary manipulation of the object, projection description and projection reading, reconstruction, transparency of the structure) were used; such as Mental Cutting Test, Purdue Spatial Visualization Test and Heinrich Spatial Visualization Test. By right of the curriculum of the two countries it can be said that for teaching the spatial geometry small time has left in both countries. The results of the survey verify that many students have problems with imagining a spatial figure and therefore to solve the spatial geometry exercises. As a future study, it is being planned to make special interactive worksheets to develop of spatial ability.
Keywords:Spatial ability, Mathematics education, Spatial tests MSC:G20, G30, G40
1. Introduction
Spatial visualization skills are very important to success in many fields of science.
Students with high scores on a mental rotation test systematically score higher on anatomy examinations [32]. According to previous studies spatial visualisation ability is a predictor for success in technical education, spatial ability development is importance in engineering training, especially for architects [1, 4, 12, 13, 20, 17,
http://ami.ektf.hu
171
18, 21, 22]. This ability is not determined genetically, but rather a result of a long learning process [23].
Spatial ability can be defined as the abilities of imagine the visualization of an object from different viewpoints, rotation of it and blend or integrate of the parts of the given object [9, 15, 20].
McGee [15] defines spatial ability as “the ability to mentally manipulate, rotate, twist or invert pictorially presented stimuli”, McGee [15] and Maier [14] classify five components of spatial skills as
• Spatial perception: the vertical and horizontal fixation of direction regardless of troublesome information;
• Spatial visualization: it is the ability of depicting of situations when the components are moving compared to each other;
• Mental rotation: rotation of three dimensional solids mentally;
• Spatial relations: the ability of recognizing the relations between the parts of a solid;
• Spatial orientation: the ability of entering into a given spatial situation.
Spatial thinking has an important role in the teaching and learning of math- ematics process. Studies showed that this ability has positive correlations with geometry and mathematics education [3, 29, 30]. Considering its important role in mathematics education, development of spatial ability by the aid of Information and Communication Technologies had great attention in the reviewed literature, especially with Dynamic Geometry Systems [6, 11; 16, 19, 26, 29].
The measurement of spatial abilities is standardized by international tests, among which the Mental Rotation Test (MRT) is introduced by Vanderberg and Kuse [31] and the Mental Cutting Test (MCT) are of greatest importance. MRT presents a criterion figure shown along with four candidate figures, two of which represent the criterion figure in a rotated position. MCT presents a 3D object with an imaginary cutting plane and five possible solutions for the cross-section shape.
Heinrich Spatial Visualization Test (HSVT) and Purdue Spatial Visualization Test – Visualization of Rotation (PSVT-R) are widely used for testing the spatial ability.
Much work has been reported an analysis of MCT [1, 13, 21, 22, 25, 27], MRT [1, 4, 13, 18, 23], HSVT [5, 10, 28] and PSVT-R [1, 2, 7, 24] results of engineering students or prospective mathematics teachers, with emphasis on gender differences and attempted to find possible reasons of gender difference, concluding, that typical mistakes play central role in it. Most US researchers have used the PSVT-R to measure visualization skills; MRT and MCT are widely used in Europe and Japan.
One of paper-and-pencil test was selected to measure spatial visualization abi- li-ty of prospective elementary mathematics teachers: a reduced version of HSVT.
This test was developed by Heinrich [10] to examine the spatial abilities of engi- neering graphics students. The original HSVT includes two major expert skills in spatial visualization: synthesis and decomposition. For each two basic skills she
hypothesized that when mental rotation was added to these tasks at three hierarchi- cal levels of complexity, this would render the spatial problem solving progressively more difficult [5, p.2].
The original HSVT consists of 48 items divided into 6 scales:
• synthesis without rotation;
• decomposition without rotation;
• synthesis with one-step rotation;
• decomposition with one-step rotation;
• synthesis with two-step rotation;
• decomposition with two-step rotation.
Example items of the test are given in the following figures ([28, p. 173]).
Figure 1: Example item for Synthesis section
Figure 1 expresses an example about the part of "Synthesis". Synthesize four pieces, adjusting Probe X to fit piece # and selecting one of 5 options A, B, C, D, E to replace the question mark [5, p. 3].
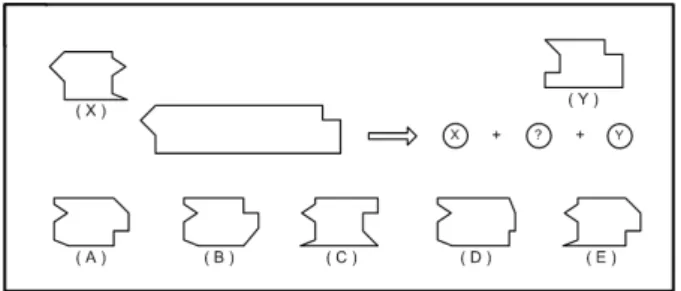
Figure 2: Example item for Decomposition section
In the Figure 2, decompose given pattern three pieces, X+?+Y, where probes X,Y may need to be adjusted, and after selecting one of 5 options, A, B, C, D, E
to replace the question mark. The reduced test includes 15 items for the part of
“synthesis”, and 10 items for the part of “decomposition”. In our work [28], following theoretical aspects of the HSVT, we used 25 items of it due to administering to the junior level prospective elementary mathematics teachers. Now it can be compared that HSVT performances [28] with new performances of PSVT-R.
Guay developed the PSVT in 1976 to determine student’s ability to visualize, recognize orthograpic drawings. The PSVT includes three sections: developments, object rotations and views [8]. Most researchers and the autors use only the object rotations portion. The rotations section shows an object in two different positions.
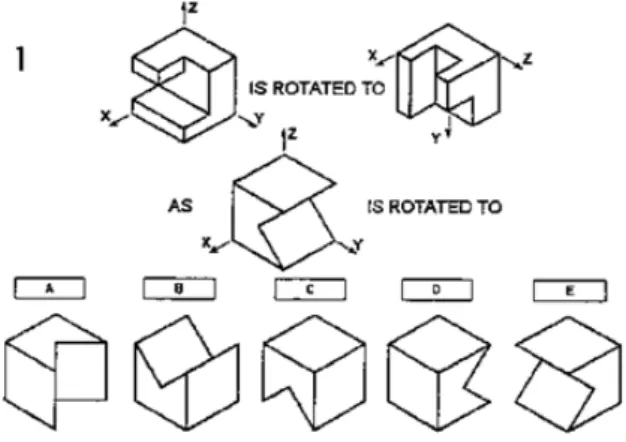
The first object is rotated on the X, Y or Z-axis, to show the rotation pattern. A second object is presented with five alternative views, one represents the second object subjected to te same rotation as the example. In our study coordinate axes were added to the first and second stimulus objects, but they were not added to the five solution choices [2]. The first stimulus object was shown in its new, rotated position. Figure 3 expresses an example about the part of PSVT-R (with coordinate axes).
Figure 3: Example item for visualization of rotations test
In the light of the existing literature, we investigate and compare spatial vi- sualization test PSVT-R and HSVT performances of two samples of junior level prospective elementary mathematics teachers from Hungary and Turkey enrolled to teacher training departments with the variables of gender and age. So, this work posed the following question:
• What are prospective Hungarian and Turkish elementary mathematics teach- ers’ spatial visualization ability levels?
• Is there a significant relationship between prospective Hungarian and Turkish mathematics teachers’ Heinrich and Prudue spatial visualization ability?
In the second section we report about the circumstances of the survey. The
third section contains the results of the survey. The last section is the summary of the article and our experiences.
2. Background
Elementary mathematics teachers had been graduating from 3 years’ education since the establishment of the Republic of Turkey (1923) to 1982. Secondary school mathematics teachers graduated from Teacher Traning Colleges and Universities.
After 1982, all education program areas came to be updated and standardized according to the framework programs of developed countries. In order to train major teachers national universities opened new teaching programs. From 1982 to 1997, mathematics teachers graduated from mathematics education programs of the Department of Science Education. Moreover, researchers graduating from the Faculty of Sciences got a mathematics teacher’s degree by taking a pedagogical program organized by the education faculty.
After 1997, the mathematics education program (it was a part of science edu- cation) was divided into two teaching programs, namely elementary and secondary mathematics (four and five years long). Nowadays, it is also possible to be a sec- ondary school mathematics teacher also for students who graduate from the faculty of sciences and get a teacher’s degree after a pedagogical traning process (Figure 4).
Mathematics Teacher Training Program in Hungary can be found at the fol- lowing website: http://www.math.unideb.hu/index.php?p=007&pa=000
3. The comparative survey
We made our comparative survey at the Eskişehir Osmangazi University and Uni- versity of Debrecen, among prospective elementary mathematics teachers. 73 Hun- garian students and 85 Turkish students took the test. All data were collected during the spring semester of 2012. Standard instructions were given to samples of junior level prospective elementary mathematics teachers from Hungary and Turkey. For the entire test, 25 minutes were given to the each sample to fill the whole HSVT test [28], and 20 minutes were given to the each sample to fill the PSVT-R test.
The tasks of PSVT-R focus on the imaginary manipulation of the solid. The task is to follow the phases of the objective activity that consist of the complex spatial transformation of the solid. The first task is the identification of the figure, and the second task is the manipulation of mental representations. Each problem is composed of a criterion figure, two one alternative and four incorrect alternatives.
Correct alternative is structurally identical to the criterion, but shown in a rotated position. The subjects are asked to find the correct alternative. The PSVT-R (coordinate axes) contains 30 items of increasing level of difficulty.
Figure 4: Mathematics Teacher Training Program in Turkey ([28, p. 178])
Data were analysed using the SPSS statistical analysis program. The perfor- mance of the students, correct responses given to each item of PSVT-R is presented in the Figure 5.
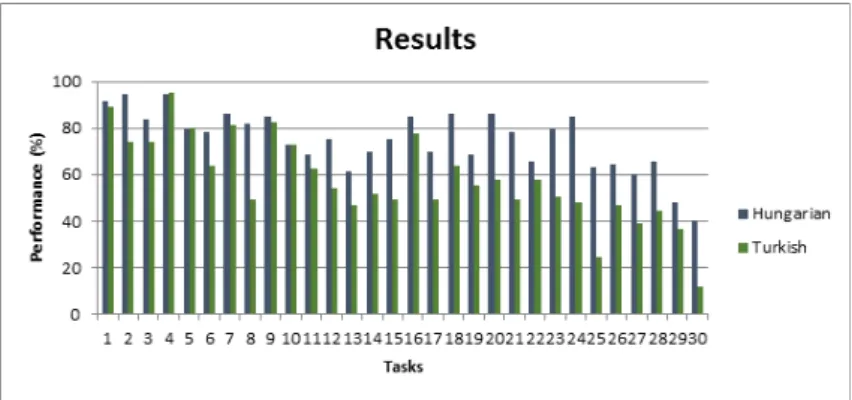
Figure 5: Students’ performance
As it is shown, the most items are marked correctly: item1 with 92% (Hungar- ian students) and 89% (Turkish students) correct response rate; item4 with 95%
(Hungarian students) and 95% (Turkish students) correct response rate; item2 with 95% (Hungarian students) and 74% (Turkish students) correct response rate and item9 with 85% correct response rate by Hungarian students and item4 with 82%
correct response rate by Turkish students. The difference is remarkable between Hungarian students and Turkish students: item25 with 38%; item24 with 37% dif- ference rate. Turkish sample performed better than Hungarian sample in items 4, 5 (the biggest difference rate is 1%).
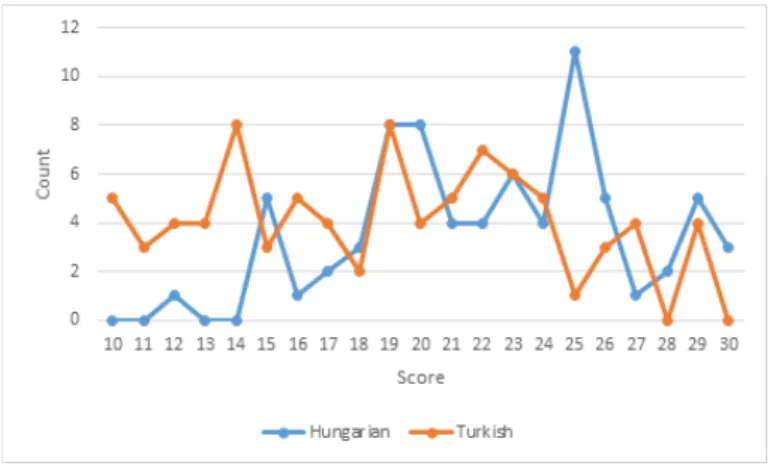
Hungarian sample’s performance is better than Turkish sample do is the dis- tribution of the PSVT-R scores. Figure 6 gives us the results with respect to distribution of the scores.
Figure 6: Distribution of the scores PSVT-R
Figure 6 shows that, while there are 27 Hungarian junior prospective elementary mathematics teachers performed 25 and greater scores, in Turkish sample there are 12 prospective teachers. And none of Turkish prospective teachers did give correct responses for the whole PSVT-R while 3 Hungarian did.
Means, standard deviations of spatial visualization ability and statistical dif- ferences of each group are analyzed in terms of descriptive statistics. The results appear in the Figure 7.
Figure 7: Mean scores of each sample and statistical differences
Investigating of each sample’s and all subjects’ means and standard deviations,
we find that Hungarian junior level prospective elementary mathematics teachers mean score of PSVT-R is 22.26 (SD=4.33), and mean score of Turkish sample is 18.82 (SD=5.36). According to these results, it can be said that Hungarian and Turkish prospective elementary mathematics teachers have adequate spatial visualization ability.
Figure 7 also shows that there is a significant difference (p<.05) between mean scores of spatial visualization of Hungarian and Turkish junior level prospective elementary mathematics teachers. Hungarian sample performed better than those Turkish did at PSVT-R.
Additionally, there is a significant relationship between elementary mathematics teachers’ scores in PSVT-R and HSVT (p<.01).
We found significant difference between prospective Hungarian and Turkish elementary mathematics teachers’ scores of PSVT-R in favor of Hungarian sample.
We think that one of the reasons may be teacher training programs. We give mathematics area courses in Figure 4. We compared the syllabi, one can see that Hungarian sample takes more lectures related to computer and geometry which may develop their geometrical and spatial reasoning. Similar findings are also observed in our previous study interpreted by HSVT [28] and MCT [27]. Moreover, results of the present study support the related literature. It is well known that to develop spatial ability, researchers suggest activities including isometric and technical drawings, computer applications and use of geometric manipulative in the teaching process [11, 16, 19, 20, 26]. In the mentioned courses there are a lot of applications need the use of spatial thinking. Therefore, suffice it to say that the related literature supports results of the present study.
4. Conclusion
In this work, we compared PSVT-R and HSVT performances of prospective Hun- garian and Turkish mathematics teachers. There was a significant difference be- tween mean scores of spatial visualization of Hungarian and Turkish students. As a consequence, the following conclusions were obtained.
The results of the survey verify that many students have problems with imagin- ing a spatial figure and therefore to solve the spatial geometry, PSVT-R exercises.
So it would be very useful in the high schools and in the university training as well, if we devote more time for spatial ability, for summarizing the spatial ge- ometry knowledge, for solving spatial geometry tasks. According to these results, mathematics teacher curriculums may be updated.
In the related literature there are various factors effecting spatial ability. In order to make further interpretations about the obtained results, we will analyse each group’s data qualitatively in terms of prepared spatial visualization, mental rotation and spatial orientation tasks. Studies suggest that interactive animation and virtual solids are promising tools for training spatial thinking in undergraduates [11, 16, 19, 24, 26]. Similar studies were conducted and concluded that students’
education of preschool, primary, middle and secondary school are also important
in the development of spatial ability [3, 26, 30]. Future work will be comparing of curriculums from preschool to university level and deal with another variables such as preschool education and spatial experience. It would be useful to focus on task based student interviews to reveal the student’s spatial problems. Moreover, some comparative studies with self-report measures [26] may yield concrete elements to evaluate the overviewed results.
Acknowledgements. I would to thank Dr Melih Turgut (Eskişehir Osmangazi University, Faculty of Education, Turkey) his valuable cooperation in this impor- tant topic and useful helps in the data gathering process.
References
[1] Ault, H. K., John, S., Assessing and Enhancing Visualization Skills of Engineering Students in Africa: A Comprehensive Study,Engineering Design Graphics Journal Vol. 74/2 (2010), 12–20.
[2] Branoff, T., Connolly, P., The Addition of Coordinate Axes to the Purdue Spatial Visualization Test – Visualization of Rotations: A Study at Two Universities, Proceedings of the American Society for Engineering Education Annual Conference, (1999).
[3] Bosnyák, Á., Nagy-Kondor, R., The spatial ability and spatial geometrical knowledge of university students majored in mathematics,Acta Didactica Universi- tatis Comenianae Vol. 8 (2008), 1–25.
[4] Bölcskei, A., Kovács, A. Z., Kušar, D., New Ideas in Scoring the Mental Ro- tation Test,YBL Journal of Built Environment Vol. 1/1 (2013), 59–69.
[5] Chen, K. H., Validity studies of the Heinrich spatial visualization test, Doctoral Dissertation, Ohio State University, Ohio, USA(1995).
[6] Cohen, C. A., Hegarty, M., Visualizing cross sections: Training spatial thinking using interactive animations and virtual objects,Learning and Individual Differences Vol. 22/6 (2012), 868–874.
[7] Ferguson, C., Ball, A., McDaniel, W., Anderson, R., A Comparison of Instructional Methods for Improving the Spatial Visualization Ability of Freshman Technology Seminar Students, Proceedings, IAJC-IJME International Conference (2008).
[8] Guay, R. B., Purdue Spatial Visualisation Test: Rotations,West Lafayette: Purdue Research Foundation(1977).
[9] Haanstra, F. H., Effects of art education on visual-spatial and aesthetic perception:
two meta-analysis,Rijksuniversiteit Groningen(1994).
[10] Heinrich, V. L. S., The development and validation of a spatial perception test for selection purpopes, Master Science Dissertation, Ohio State University, Columbus, Ohio, USA(1989).
[11] Kurtulus, A., The effects of web–based interactive virtual tours on the development of prospective mathematics teachers’ spatial skills, Computers & Education Vol. 63 (2013), 141–150.
[12] Langley, D., Zadok, Y., Arieli, R., Exploring spatial relationships: a strategy for guiding technological problem solving, Journal of Automation Mobile Robotics and Intelligent Systems Vol. 8 (2014), 30–36.
[13] Leopold, C., Górska, R. A., Sorby, S. A., International Experiences in Develop- ing the Spatial Visualization Abilities of Engineering Students,Journal for Geometry and Graphics Vol. 5/1 (2001), 81–91.
[14] Maier, P. H., Spatial geometry and spatial ability – How to make solid geometry solid? In Elmar Cohors-Fresenborg, K. Reiss, G. Toener, and H.-G. Weigand, edi- tors, Selected Papers from the Annual Conference of Didactics of Mathematics 1996, Osnabrueck (1998), 63–75.
[15] McGee, M. G., Human Spatial Abilities: Psychometric studies and environmental, genetic, hormonal and neurological influences,Psychological BulletinVol. 86 (1979), 899–918.
[16] Nagy-Kondor, R., Spatial Ability, Descriptive Geometry and Dynamic Geometry Systems,Annales Mathematicae et InformaticaeVol. 37 (2010), 199–210.
[17] Nagy-Kondor, R., Technical Mathematics in the University of Debrecen,Annales Mathematicae et Informaticae Vol. 38 (2011), 157–167.
[18] Nagy-Kondor, R., Sörös, C., Engineering students’ Spatial Abilities in Budapest and Debrecen,Annales Mathematicae et InformaticaeVol. 40 (2012), 187–201.
[19] Nagy-Kondor, R., Using dynamic geometry software at technical college,Mathe- matics and Computer Education Fall (2008), 249–257.
[20] Olkun, S., Making Connections: Improving Spatial Abilities with Engineering Drawing Activities, International Journal of Mathematics Teaching and Learning (2003),http://www.ex.uk/cimt/ijmt1/ijabout.htm
[21] Németh, B., Hoffmann, M., Gender differences in spatial visualization among engineering students, Annales Mathematicae et Informaticae Vol. 33 (2006), 169–
174.
[22] Németh, B., Sörös, C., Hoffmann, M., Typical mistakes in Mental Cutting Test and their consequences in gender differences, Teaching Mathematics and Computer Science(2007), 1–8.
[23] Shiina, K., Short, D. R., Miller, C. L., Suzuki, K., Development of Software to Record Solving Process of a Mental Rotations Test, Journal for Geometry and Graphics Vol. 5 /2 (2001), 193–202.
[24] Sorby, S., A New and Improved Course for Developing Spatial Visualization Skills, Proceedings, ASEE Annual Conference (2001).
[25] Tsutsumi, E., A mental cutting test using drawings of intersections, Journal for Geometry and Graphics Vol. 8/1 (2004), 117–126.
[26] Turgut, M., Development of the spatial ability self-report scale (SASRS): reliabil- ity and validity studies,Quality & Quantity: International Journal of Methodology (2014, in press), Doi: 10.1007/s11135-014-0086-8.
[27] Turgut, M., Nagy-Kondor, R., Comparison of Hungarian and Turkish prospec- tive mathematics teachers’ Mental Cutting performances, Acta Didactica Universi- tatis Comenianae Vol. 13 (2013), 47–58. ISBN 978-80-223-3507-2
[28] Turgut, M., Nagy-Kondor, R., Spatial Visualisation Skills of Hungarian and Turkish prospective mathematics teachers, International Journal for Studies in Mathematics Education Vol. 6/1 (2013), 168–183.
[29] Turgut, M., Uygan, C., Spatial ability training via 3D modelling software. In E.
Faggiano & A. Montone (Eds),Proceedings of the 11th International Conference on Technology in Mathematics Teaching–ICTMT11, University of Bari, 9-12 July 2013, Italy: Università degli Studi di Bari Aldo Moro (2013), 292—297.
[30] Turgut, M., Yenilmez, K., Spatial visualization abilities of preservice mathe- matics teachers, Journal of Research in Education and Teaching Vol. 1/2 (2012), 243–252.
[31] Vanderberg, S. G., Kuse, A. R., Mental Rotations, a group test of three dimen- sional spatial visualization,Perceptual and Motor Skills Vol. 47 (1978), 599—604.
[32] Vorstenbosch, M. A., Klaassen, T. P., Donders, A. R. T., Kooloos, J.
G., Bolhuis, S. M., Laan, R. F., Learning anatomy enhances spatial ability, Anatomical sciences education Vol. 6/4 (2013), 257–262.