Journal of Aerosol Science 147 (2020) 105582
Available online 18 May 2020
0021-8502/© 2020 The Author(s). Published by Elsevier Ltd. This is an open access article under the CC BY-NC-ND license
(http://creativecommons.org/licenses/by-nc-nd/4.0/).
The role of the combined use of experimental and computational methods in revealing the differences between the micron-size particle deposition patterns in healthy and asthmatic subjects
Arp � � ad Farkas
a,b,*, Frantisek Lizal
b, Jan Jedelsky
b, Jakub Elcner
b, Jakub Karas
b,c, Miloslav Belka
b, Ondrej Misik
b, Miroslav Jicha
baCentre for Energy Research, Konkoly Thege M. 29-33, 1121, Budapest, Hungary
bFaculty of Mechanical Engineering, Brno University of Technology, Technicka 2, Brno 61669, Czech Republic
cDepartment of Pharmaceutics, Faculty of Pharmacy, University of Veterinary and Pharmaceutical Sciences, Palackeho Trida 1946/1, 612 42, Brno, Czech Republic
A R T I C L E I N F O Keywords:
Airway deposition measurement Airway deposition simulation Micron-size particles Asthma
A B S T R A C T
Quantification of airway deposition of aerosol particles is essential for the assessment of health risks of detrimental particles. Knowledge of deposition distribution is important also in the case of treatment with aerosolised drugs. It is also worth considering that deposition of inhaled particles in severe asthmatics can be different from the deposition in healthy subjects due to the modified breathing parameters, airway geometry and lobar flow distribution.
The aim of this study was to apply combined experimental and numerical techniques to quantify the upper airway and bronchial deposition of the inhaled microparticles in healthy in- dividuals in comparison with asthma patients. Idealised and realistic physical and digital replicas of the human airways were constructed. Deposition fractions and efficiencies of inhaled poly- disperse mannitol and chitosan particles in different airway sections were measured and calculated.
Deposition fraction of polydisperse mannitol particles in the idealised airway geometry assuming breathing conditions of healthy subjects was 21.9% and 18.3% when determined experimentally and by numerical simulations, respectively. Experimental measurements of deposition fraction of chitosan particles in the same geometry, but assuming breathing parame- ters characteristic of severe asthmatics yielded 32%, while simulations provided 30.1% for the same conditions. Extrathoracic deposition fraction of mannitol particles in healthy subjects measured in the realistic geometry was 71.1%, while bronchial deposition fraction was 5.3%. The corresponding simulations yielded 76.2% and 8.9% deposition fractions in the upper and bron- chial airways, respectively. There was a good agreement between the experimental and simula- tion deposition results also in the different predefined sections of the airways. Present pilot study proved that lobar flow redistribution due to severe asthma significantly modified the deposition distribution of micro-particles.
Although the present results refer only to small groups of healthy and asthmatic individuals, it clearly demonstrates the capability of carefully validated models to simulate the deposition of micron-size particles in larger populations of both groups.
* Corresponding author. Centre for Energy Research, Konkoly Thege M. 29-33, 1121 Budapest, Hungary.
E-mail address: farkas.arpad@energia.mta.hu (A. Farkas). �
Contents lists available at ScienceDirect
Journal of Aerosol Science
journal homepage: http://www.elsevier.com/locate/jaerosci
https://doi.org/10.1016/j.jaerosci.2020.105582
Received 31 January 2020; Received in revised form 28 April 2020; Accepted 29 April 2020
Journal of Aerosol Science 147 (2020) 105582 1. Introduction
Particles in the air have varying concentration, composition, shape and density characteristics. Once inhaled they can deposit in different regions of the respiratory tract and interact with the airways. Inhaled ultrafine particles may eventually reach other organs by passing into the systemic circulation (Nemmar et al., 2002) or the brain by translocation from the nose through the olfactory nerves (Oberd€orster et al., 2004). Many of the inhaled aerosol particles (particles suspended in air) can be detrimental, such as radioactive aerosol particles, cigarette smoke particles, fly ash particles, certain types of fibres, allergens, viruses and bacteria, et cetera. On the other hand, inhaled medical aerosols play a key role in the management of respiratory diseases like asthma, COPD (chronic obstructive pulmonary disease) or CF (cystic fibrosis). Besides their physical and chemical properties, the health effects of both harmful and beneficial inhaled aerosols depend on the amount of deposited particles and the deposition site within the airways. Therefore, it is important to quantify the efficiency and distribution of their airway deposition. Deposition of aerosols in the airways of healthy in- dividuals has been intensively studied in the open literature both experimentally and by different modelling techniques. There is a large variety of both in vivo and in vitro experimental methods for the measurement of particle deposition within the airways. A comprehensive review of the well-established and emerging techniques used to quantify the airway deposition of different inhaled particles, including the advantages and drawbacks of each method, was recently published by Lizal et al. (2018). A broad spectrum of mathematical techniques was also applied to model the transport and deposition of the inhaled particles within the human airways. An insight into the different modelling concepts and the comparison of model predictions with experimental data was provided by Hofmann (2011).
Considerably less attention was paid to the particle transport and deposition in diseased airways. Besides the characteristics of the inhaled particles, airway deposition and the subsequent health effects depend on the geometry (anatomy) of the airways and the breathing mode. Both factors may be altered in pathological conditions leading to specific deposition patterns, doses and dose dis- tributions. It has been demonstrated that common airway diseases such as asthma or COPD may lead to specific breathing patterns due to lung function decline (Sears, 2007). In addition to the change in the dimension of the airways, airway diseases may lead to changes in mucus thickness (e.g. cystic fibrosis, CF) but also changes in composition and thickness of the lung epithelium influencing the particle-lung interactions. An appropriate quantification of the amount of deposited particles requires the understanding and consideration of all these modifying factors. In this study we are particularly interested in combining experimental measurements with numerical simulations to quantify the deposition of inhaled micron-sized particles in small groups of healthy individuals and asthmatic patients.
Asthma is a chronic respiratory disease characterised by recurrent attacks of breathlessness and wheezing, which vary in severity and frequency from person to person. The estimated total number of individuals affected by asthma is ranging from 235 million (WHO, 2016) to 339 million (GAN, 2018). Asthma kills around 1000 people every day and it is the most common chronic disease among children. There can be a causal relationship between the concentration of inhalable detrimental particles and the frequency of certain types of asthma. The symptoms that go along with allergic asthma (the most common type of asthma, especially in children) show up after the inhalation of allergens. A recent global study including 194 countries demonstrated that inhalation of traffic-related particles is strongly linked to new cases of childhood asthma (Achakulwisut, Brauer, Hystad, & Anenberg, 2019). The authors suggested the revision of the adequacy of the WHO guideline for ambient NO2 concentrations. Since the symptoms are triggered by the particles that are inhaled and deposited within the airways, it is important to quantify the deposited amount at given ambient concentrations.
Understanding of how asthma influences airway deposition of particles is important also from the perspective of asthma treatment by aerosolised drugs. Knowledge of the fate of inhaled particles within the airways will allow us to make a step further in our goal of delivering the right type and amount of medication to the right place in the airways.
Modelling of the effect of asthma on the airflow and particle transport within the airways was in the focus of several past publi- cations. A number of earlier works focused on the effect of local reduction of airway lumen on the bronchial airflow and particle deposition (Farkas & Bal�ash�azy, 2007; Longest, Vinchurkar, & Martonen, 2006; Luo, Liu, & Yang, 2007; Yang, Liu, & Luo, 2006). In these works typically a few central airway generations were considered based on Weibel’s description of the architecture of human lungs (Weibel, 1963). The heterogeneity of the airway congestion was also taken into account in the model of Martonen, Fleming, Schroeter, Conway, and Hwang (2003). Later, Inthawong et al. (2010) studied the effects of airway obstruction induced by an asthma attack on particle deposition in large tracheobronchial segments reconstructed from medical images. The consonant finding of these studies was that airway narrowing produced notable increases of micron size particle deposition at the affected sites. The above works focused on the quantification of particle deposition in the tracheobronchial part of the airways without considering the filtering effects of the upper airways. Horvath et al. (2011) applied a whole respiratory tract model to calculate the regional and airway generation � specific deposition fractions of 0.1–20 μm pollens in severe asthmatics and compare them to the corresponding values of healthy subjects. Their conclusion was that severe asthma affects the deposition pattern at both regional and local levels.
All the above mentioned works aimed at the simulation of the effect of asthma on particle deposition through the modified airway calibre. Although some of them accounted also for the modified breathing parameters of asthmatic patients (e.g. Horv�ath et al., 2011), none of them considered the redistribution of the flow among the lobes due to the disease. By the development of modern imaging techniques (especially HRCT, high-resolution computed tomography) it has become possible to accurately estimate the volume of the lobes of both deflated and inflated lungs. By the analysis of the differences of the lobar volumes in the two states, important infor- mation on the distribution of airflow among the lobes is possible. By this method, Choi et al. (2013) have estimated the lobar volume changes between expiratory (at functional residual capacity, FRC) and inspiratory (at total lung capacity, TLC) states and observed the redistribution of the lobar flow in severe asthmatics compared to healthy controls. This finding was confirmed by Jahani et al. (2017)
�A. Farkas et al.
who acquired dynamic CT images during tidal breathing using four-dimensional computed tomography (4D-CT). Jahani (2016) has also studied the consequences of lobar flow redistribution in terms of pressure distribution in the healthy and asthmatic lungs. Among the few studies addressing the lobar flow redistribution in asthmatics and applying subject-specific regional airflows it should be mentioned the recently published works of Choi, Miyawaki, and Lin (2018, 2019, and 2019).
The objective of the present study is to perform parallel numerical simulations and experimental measurements of airway depo- sition of micron-size particles in healthy subjects and severe asthmatics. Highlighting the importance of mutual validation of simu- lations and measurements and demonstrating the potential of in silico methods to be used towards an understanding of the effects of disease on regional particle deposition is another aim of this work. It is worth noting that due to the small groups of healthy and asthmatic individuals and the specific boundary conditions assumed, this study is not intended to draw general conclusions on the modification of particle deposition and dosimetry in asthmatics. Instead, it proposes to be a pilot study demonstrating the possibility of future use of the combined use of experimental measurements and numerical simulations in the context of larger populations studies to reveal the effects of airway disease.
2. Methods
In this work, the quantification of the deposition of aerosol particles in the airways of healthy and severe asthmatic subjects was performed by keeping the same airway geometry. In reality, the geometry of the asthmatic airways may also be modified due to the disease. Due to this limitation, the differences in terms of particle deposition patterns could be attributed only to the modified breathing mode and lobar airflow redistribution in severe asthmatics. By the same token, experimental measurements and numerical simulations were performed in parallel in the physical and digital versions of the same airway geometries assuming the same poly- disperse particle size distributions, similar breathing and boundary conditions, which allowed us to directly compare the results obtained by the two methods. Both the experiments and the simulations were performed in two airway geometries with different levels of complexity.
2.1. Experimental method 2.1.1. Experimental setup
The schematic representation of the test rig used for the measurement of particle deposition within the airways is demonstrated in Fig. 1.
The experimental airway deposition measurements were performed in two different 3D printed physical airway replicas, which will be presented in details in section 2.1.2. To allow the dismantling into segments and reassembly of the airway models, flanges with screw or bayonet joints were created between the segments. Particle filters (Millipore AAWP02500 Nitrocellulose membrane filters;
four filters in case of the simple geometry and ten filters in case of the realistic geometry) were placed at the airway outlets to measure the mass of particles exiting the airways without deposition. The inner surface of the hollow replicas was coated by silicone oil to avoid bouncing and resuspension of the particles hitting the airway walls. The silicone oil was used for emulating the thin mucus layer lining the realistic human bronchial airways. The airflow through the airway replicas was provided by a breathing mechanism with five cylinders corresponding to the five lobes. The breathing mechanism was computer-controlled, providing pre-defined breathing profiles
Fig. 1.Scheme of the test rig for the measurement of particle deposition.
Journal of Aerosol Science 147 (2020) 105582
which will be presented in section 2.1.3. The particles were injected into the airways by a small-scale powder disperser (TSI SSPD 3433). The disperser sucks the rigid particles from an annular ring through a venturi aspirator, then the particles continue to the airway model. The chitosan and mannitol particles used in this study were provided by the Faculty of Pharmacy of the University of Veterinary and Pharmaceutical Sciences Brno. More details about the test particles are provided in section 2.1.4.
2.1.2. Physical airway geometry models
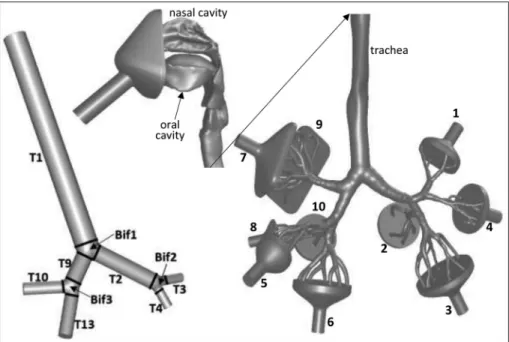
The left-hand side of Fig. 2 demonstrates the simpler airway geometry considered in this study. This airway structure consists of the trachea (T1), left (T2) and right (T9) main bronchi, right upper lobar bronchus (T10), right intermediate bronchus (T13), left upper lobar bronchus (T3) and left lower lobar bronchus (T4) connected by bifurcation zones (Bif1, Bif2 and Bif3). A detailed description of this geometry can be found in Lizal, Elcner, Hopke, Jedelsky, & Jicha, 2012. As demonstrated in Fig. 2, this geometry was divided into sub-regions in order to better characterise the local distribution of the deposited particles. The right-hand side of Fig. 2 depicts the much more complex and realistic airway geometry containing oral and nasal cavities, laryngo-pharyngeal and tracheobronchial airways down to the 7th generation. For better visibility, the airway geometry was cut at the level of the trachea and the upper part rotated by 90�around the vertical axis. This complex geometry is a reference airway model in which we have previously measured (Belka et al., 2018), and simulated (Farkas, Lizal, Elcner, Jedelsky, & Jicha, 2019) the deposition of fibres. The same geometry, but Fig. 2.Simplified tracheobronchial and realistic naso-oro-laryngeal-tracheobronchial airway geometries considered in this study. For better visi- bility, the realistic geometry is cut at the level of the trachea and the upper airways are rotated by 90�clockwise (towards the right lung) around the vertical axis.
Fig. 3.Segmentation of the realistic airway geometry. The upper airways are enlarged (2 �) and rotated 90�clockwise. The left and right lungs are shown at their original scale but translated.
�A. Farkas et al.
without the nasal cavity, was also the subject of a recent large benchmark study (Koullapis et al., 2018). The STL files and detailed description of the geometry can be downloaded from (Koullapis et al., 2019). This geometry has one inlet and ten funnel-shaped outlets (numbered in Fig. 2), that is, two outlets for each lobe. The particles are delivered through the inlet tube and a facial mask. The role of the mask is to make it possible to switch between nasal and oral breathing. The more complex geometry was also split into different segments, which are shown in Fig. 3.
2.1.3. Breathing profiles
Most of the effort related to the setting of boundary conditions was spent on the construction of time-dependent velocity profiles at the outlets. It was demonstrated by 4D CT techniques that the difference between the breathing of healthy and asthmatic individuals manifests not only in terms of different inhaled volumes and breathing frequency but also in the different flow distribution among the five lung lobes (Jahani, Choi, Choi, Iyer, & Hofmann, 2015). Therefore, much attention was paid to reproduce these differences both during the experiments and simulations and impose them in the form of time-dependent boundary conditions at the outlets. The breathing profiles for the five lung lobes (inhaled volume versus time) were constructed based on realistic own measurements of the breathing profiles for the whole airways (yielding the time-dependent inhaled volume at the nose or mouth) combined with data on the measured flow splitting among the lobes retrieved in the open literature. Breathing patterns characteristic of tidal breathing (normal breathing at resting) for both healthy and severe asthmatic individuals were reconstructed. Patient demographics and breathing characteristics of 49 asthmatic patients and 17 healthy subjects were previously recorded at Petz Alad�ar Teaching Hospital (Gyor, } Hungary, ethical approval number 76-1-20/2017). From this database five healthy and three asthmatic individuals were selected whose lung function parameters matched the best the corresponding data in the publication of Jahani et al. (2015) and Jahani et al.
(2017) who provided dynamic (time-dependent) lobar flow distribution of healthy individuals and severe asthmatics at normal breathing. Average values of the lung function data and breathing parameters of the selected healthy individuals and asthmatic pa- tients are demonstrated in Table 1.
Representative lobar inhalation profiles (air volume entering each lobe versus time) of healthy individuals (five subjects) and severe asthmatics (three patients) were constructed by averaging their corresponding individual lobar profiles (taking the average of their lobar volume at every plotted time value). These lobar flow patterns are demonstrated in the left upper (healthy subjects) and right upper (asthmatics) panels of Fig. 4. The derivation of the curves in Fig. 4 (upper panels) yields the lobar flow rates, which divided by surface areas of the outlets results in the average outlet velocities. These time-dependent velocity values are plotted in the left (healthy individuals) and right (asthmatic patients) bottom panels of Fig. 4. In the case of the simpler geometry, the right middle and lower bronchi are missing (see Fig. 2), thus the flow rates in the right middle and right lower lobes were summed up to get the flow in the right intermediate bronchus. In the case of the more complex second geometry, the lobar flow was further split into two parts to get the flow at each of the ten funnel-shaped outlets. The two funnel-shaped outlets corresponding to the same lobar bronchus were characterised by the same static pressure, thus splitting of the lobar flow was based on the flow resistance of the two airway segments downstream the lobar bronchus and the resulting flow fractions were determined experimentally. The resulting fractions of airflow in each sublobar segment (numbered from 1 to 10 in Fig. 2) are demonstrated in Table 2 together with the diameters of the funnel outlets.
For instance, since the air flowing through the right upper bronchus (marked with RUL in Fig. 4, upper panels) is divided into two parts entering the system of branches denoted by 7 and 9 (see Fig. 2), the volume profiles at exits 7 and 9 will have the same shape as the volume profiles RUL in Fig. 4 (upper panels), but the maximum of the curves will be at 0.556 (exit 7) and 0.444 (exit 9) of the original RUL curves. The time-dependent outlet velocity profiles were constructed starting from these volume profiles and taking into account the surface areas corresponding to each outlet (Table 2). Fig. 5 demonstrates the air volume (upper panel) and velocity (bottom panel) profiles at exits 7 and 9. The volume and velocity profiles corresponding to all the other exits (not shown in Fig. 5) were constructed similarly.
As mentioned in section 2.1.1, the airflow through the airway replica was provided by a breathing mechanism with five cylinders corresponding to the five lobes. In case of the simple geometry both cylinders supplying the right middle and lower lobes were connected to the branch T13 (see Fig. 2) The pistons in the cylinders moved based on prescribed positions. The transformation between the flow profiles in Fig. 4 (upper panels) and the curves describing the position of the pistons was performed by the help of the equation
Table 1
Averaged lung function data (first five rows) and breathing parameters of healthy individuals and asthmatic patient.
TLC-total lung capacity; FRC-functional residual capacity; FVC-forced vital capacity; FEV1-expired air volume in the first second of forced exhalation.
Healthy subject Asthmatic patient
TLC % predicted 94 97
FRC % predicted 82 102
FVC % predicted 94 75
FEV1% predicted 92 54
FEV1/FVC �100 79 58
Inhaled volume (ml) 500 700
Inhalation time (s) 1.5 1.0
Breath-hold after inhalation (s) 0 0
Exhalation time (s) 2.5 1.2
Breath-hold after exhalation (s) 1 0.8
JournalofAerosolScience147(2020)105582
6
Fig. 4.Lobar breathing profiles of healthy (upper left panel) and asthmatic (upper right panel) subjects and time-dependent velocity values at outlet boundaries for healthy (bottom left) and asthmatic (bottom right) individuals in the case of the simplified airway geometry. LLL-left lower lobe; LUL-left upper lobe; RLL-right lower lobe; RML-right middle lobe; RUL-right upper lobe; RMLL-right middle and lower lobes. The notations of the bronchial outlets correspond to the lobes they belong to (right upper lobar bronchus-RUL, right intermediate bronchus-RMML, left upper lobar bronchus-RUL and left lower lobar bronchus).
�A. Farkas et al.
L ¼V/S, where L is the position of the piston, V denotes the volume of air and S is the cross-sectional surface area of the cylinder (the diameter of the cylinder is 63 mm).
2.1.4. Test aerosol particles
Spray drying method of aqueous dispersion was used to prepare chitosan and mannitol particles (spray dryer SD-06, LabPlant, UK).
The 10% (w/w) dispersion of D-mannitol (Penta, CZ; Mr ¼182.18) in water and 10% (w/w) dispersion of chitosan (Sigma-Aldrich, US;
Mr: 10 000–1 000 000) in 1% acetic acid were used. Dispersions were tagged with fluorescein sodium salt (2.5 mg/1 g of solid content) and sprayed through a 2 mm two-fluid nozzle under the pressure of 300 kPa to the heated drying chamber. Drying conditions were set to peristaltic pump speed 15 mL/min, fan speed 30 L/min, inlet temperature 140 �C for mannitol and 180 �C for chitosan dispersion, respectively. Surface morphology was examined by scanning electron microscopy (Mira 3, Tescan, CZ). Particle size was measured by laser diffraction (LA-690, Horiba, JP), aerodynamic parameters were characterised by aerodynamic particle sizer (TSI™ model 3321, US). The normalised cumulative mass size distributions of the chitosan and mannitol particles used in the experiments are shown in Fig. 6.
It should be noted, that the chitosan and mannitol particles prepared for experiments served only as representative aerosol particles that might be possibly used for inhalation therapy (usually as carriers), however, no active pharmaceutical ingredient (API) was incorporated in the particles. The selection of mannitol particles for experiments simulating the inhalation of a healthy person and chitosan for asthma was given by technical reasons and is not intended as an indication of recommended use. It should be recognised that using different particle formulations to study deposition in the healthy and asthmatic subjects is one of the limitations of this study. However, the laboratory producing the chitosan particles discontinued their formulation during the work and it was decided to continue with mannitol particles.
2.2. Numerical simulations 2.2.1. Airway geometries
The airway geometries used in the present simulations were the digital counterparts of the physical geometries in which the measurements were performed (see Figs. 2 and 3). The detailed presentation of the two geometries can be found in 2.1.2. The inlet tube and the facemask were kept also during the simulations to comply with the conditions of the experiments. Similarly, outlet funnels were considered during the computations, but deposition in them was discounted to get only the deposition in the airways.
2.2.2. Computational meshes – setting up the appropriate mesh and time step size
The airway geometries considered in this study were spatially discretised by the construction of mathematical meshes using the Star-CCM þ commercial software (version 10.04.011, CD-adapco, Melville, NY, USA). All the numerical meshes were three- dimensional hybrid grids containing a boundary mesh with ten prismatic layers and polyhedral cells in the core of the domain. The size of the cells in the boundary layer decreased in the direction of the wall. The first mesh points in the proximity of the wall satisfied the yþ<1 condition even for the coarsest mesh, where yþis the non-dimensional wall distance. The quality of the meshes was further improved in FLUENT software (ANSYS, Inc., Canonsburg, PA, USA) by increasing the orthogonality and decreasing the aspect ratio of some cells. A two-dimensional transverse cross-section (Section 1) of the mesh in the middle of the trachea is demonstrated in Fig. 7, upper panel.
A significant effort has been spent to ensure that the computational methods are appropriate and resolve the relevant physical phenomena both in time and space. Numerically this implies that the results are not only converged for a given mesh and time step size but also that the results are mesh size and time step size independent. The mesh independence test was performed by gradually decreasing the size of the cells (decreasing the edge size of the smallest cell by a factor of 1.5) until the flow characteristics converged into constant values. For this purpose, four different meshes on the simple geometry containing 0.28, 0.55, 1.90 and 3.88 million cells were constructed. Middle and bottom panels of Fig. 7 depict the profiles of normalised velocity magnitude averaged over the inhalation time along two lines at the middle of the trachea (line A1B1 in Section 1) and at the middle of the right intermediate bronchus (line A2B2
in Section 2). As the figure demonstrates, at the level of the trachea the flow is generally well resolved even by the coarser meshes, but Table 2
Flow splitting inside the lung lobes of the realistic airway geometry. The numbering of the outlets (exits) is according to Fig. 2. RUL – right upper lobe, RML – right middle lobe, RLL – right lower lobe, LUL – left upper lobe, LLL – left lower lobe.
Lobe Outlet nr. Outlet diameter (mm) Flow fraction
RUL 7 10 0.556
9 10 0.444
RML 5 10 0.427
8 8 0.573
RLL 6 10 0.613
10 10 0.387
LUL 1 10 0.429
4 10 0.571
LLL 2 10 0.288
3 10 0.712
JournalofAerosolScience147(2020)105582
8
Fig. 5.Air volume profiles of healthy (upper left panel) and asthmatic (upper right panel) subjects and time-dependent velocity values at exits 7 and 9 for healthy (bottom left) and asthmatic (bottom right) individuals in the case of the complex airway geometry. The numbering of the exits corresponds to the notations in Fig. 2. The original RUL (right upper lobe) volume and velocity profiles splitting into exit 7 and exit 9 are also shown.
�A. Farkas et al.
there are some locations where a finer mesh is necessary. The insert of this panel proves that the flow profile corresponding to the second finest mesh is quite similar to the profile assigned to the finest mesh. Since the second finest mesh contains less than half of the number of cells of the finest one, it is plausible to perform the calculations on this grid. This is further supported by the lower panel of Fig. 7 where normalised mean velocity values along a line (A2B2) in the right intermediate bronchus are plotted for the four meshes. It is clear that the lines converge into the shape depicted by the profile corresponding to the finest mesh and the closest results are provided by the second finest mesh. It is worth noting that similar trends were observed when comparing the time-dependent velocity profiles corresponding to the four meshes (profiles at eleven evenly distributed time steps were compared).
The time step was always adjusted to the mesh size to keep the Courant number of the smallest cell below one. For the mesh chosen for particle tracking computations (the mesh with 1.9 million cells) the time step size was 10-4 s. It was also verified that this time step size is smaller than the dynamic and viscous time scales. In conclusion, the second finest analysed mesh and 0.1 ms time step were used to compute the airflow characteristics and to quantify the deposition of particles in the studied airways. The same type of mesh was used to simulate the airflow field and particle trajectories in the more complex airway geometry including the upper airways, but the mesh was further refined in the vicinity of nasal turbinates to appropriately resolve the flow in these narrow regions. In this case, the total number of cells was 5.4 million.
2.2.3. Boundary conditions
The boundaries of the simpler model consisted of an inlet, four outlets and a wall surface. Zero gauge pressure was prescribed at the tracheal inlet and the operating pressure was the normal atmospheric pressure. The value of turbulent intensity was set to 1% at the outlets and to 5% at the mouth inlet. No-slip condition (zero air velocity) was assumed at the wall boundary. Similar conditions were assumed in the case of the realistic geometry, but the number of outlets was ten and the inlet was the tube inlet belonging to the mask, as shown in Fig. 2. The tube was connected to the nose and the mouth was closed in the case of present nose breathing simulations. The closed mouth inlet was a wall entity. The breathing profiles in the current simulations were similar to those described in section 2.1.3 characterising the normal nose breathing of healthy and severe asthmatic subjects. The practical implementation of the outlet ve- locities for simulation purposes was realised by 28 different user-defined functions (UDFs, four for the simple airway and breathing of healthy subject, four for the simple airway and breathing of asthmatic individual, ten for the complex airway and healthy subject and ten for the complex airway and asthmatic individual) in form of Cþþcodes attached to the FLUENT solver.
2.2.4. Numerical model for the simulation of the airflow
In this work, the airflow was considered unsteady and turbulent. The SST k-ω turbulence model with low-Re correction for the estimation of turbulent viscosity was used. Mass, momentum, turbulent kinetic energy and dissipation rate equations were solved by a finite volume method using the FLUENT CFD solver (part of ANSYS 19.1 engineering software). The algebraic equations were line- arised and solved using a Gauss-Seidel iteration method combined with an algebraic multigrid (AMG) technique to accelerate the solution process. A pressure-based segregated solver was applied. The field variables were interpolated to the faces of the cells by using second-order upwind schemes. Gradients of solution variables were determined by the least-squares cell-based approach at cell centres and by Taylor series expansion at cell faces. The PRESTO! (Pressure Staggering Option) algorithm was applied to compute the cell-face pressure values. The pressure-velocity coupling was realised by the PISO (Pressure-Implicit with Splitting of Operators) scheme.
2.2.5. Tracking of the inhaled particles
Inert spherical particles were considered in this study. The numerical simulations were performed assuming polydisperse particle size distributions characterised by MMADs (mass median aerodynamic diameter) of 6.1 μm (GSD ¼1.4) and 8.1 μm (GSD ¼1.7) in case Fig. 6.Normalised cumulative mass size distributions of polydisperse chitosan and mannitol particles. MMAD-mass median aerodynamic diameter, GSD-geometric standard deviation.
Journal of Aerosol Science 147 (2020) 105582
of chitosan and mannitol particles, respectively (see Fig. 6). A Lagrangian method was applied to compute the trajectory of the particles within the airways. The particles did not interact with each other. There was a one-way coupling between the air continuum and the discrete particles, that is, the particles did not influence the airflow, but their movement was affected by the airstreams. The deter- ministic forces acting on the particles were the drag force (with Cunningham correction for submicron particles), gravitational force, buoyancy force and the shear-induced lift force, while their stochastic movement was caused by turbulent dispersion and Brownian diffusion. However, considering this second stochastic phenomenon did not significantly change the deposition results. It has been demonstrated that in the core flow turbulence effects dominate Brownian effects (Ounis & Ahmadi, 1990). It was also shown that in a thin layer near the wall surface where turbulent fluctuations are reduced Brownian forces may also play a role. Since the applied discrete random walk (DRW) turbulent dispersion model overestimates the wall-normal air velocity fluctuations in the boundary layer (Xu, 2016), based on our investigations Brownian motion showed no effect assuming the current particle size distributions (deposition values without the Brownian force were the same even in the smallest branches). The numerical integration of the force balance Fig. 7.Mean velocity profiles corresponding to four different meshes along two lines: in the trachea (A1B1, middle panel) and in the right inter- mediate bronchus (A2B2, bottom panel). The two-dimensional transverse cross-section of the applied mesh (mesh3) at Section 1 is also demonstrated in the upper panel.
�A. Farkas et al.
equations was performed by a method, which switches in an automated way between numerically stable lower-order schemes (implicit tracking) and higher-order schemes (Runge – Kutta) which are stable only in a limited range. The particles were released at the ge- ometry inlet (tracheal or inlet tube, see Fig. 2). At each time step, 1000 particles were released. Their initial position was randomly selected within the inlet. Their sizes were selected from one of the size distributions in Fig. 6. The selection was performed by an in-house FORTRAN code and the injection files were prepared in an automated way by the help of a self-developed PERL (practical extraction and report language) routine. Trapping airways were assumed meaning that the particles stuck to the wall (deposited) as they came in contact with it.
3. Results and discussion
3.1. Particle deposition in the simplified geometry
The results of experimental deposition measurements and numerical simulations performed in the simple airway geometry are presented in Fig. 8. The particles were polydisperse with their size distributions shown in Fig. 6. Mannitol particles were used in the experiments conducted under breathing conditions characteristic of healthy individuals and chitosan particles to quantify the depo- sition corresponding to the breathing of asthmatics. Tidal breathing through the nose was assumed in both cases. Reynolds number in the trachea varied in time between 0-3145 for the breathing conditions of healthy subjects and between 0-6545 for the asthmatic patients.
The results in Fig. 8 are provided in terms of deposition fractions defined as the ratio of the particulate mass depositing in a certain region of the airways to the mass of particles entering the airway geometry (trachea inlet in this case). As the two panels of Fig. 8 demonstrate, experimental and numerical results exhibited the same trends. Total deposition fraction of mannitol particles in a healthy subject with normal breathing was 18.3% and 21.9% when determined numerically and experimentally, respectively. Besides the similar trends and close overall deposition values, there was a reasonable agreement also between the computed and measured values of local deposition fractions (upper panel of Fig. 8). Generally, simulations slightly overestimated the deposition in the bifurcation Fig. 8.Comparison between the measured and simulated values of deposition fractions of polydisperse mannitol (upper panel) and chitosan (lower panel) particles in different parts of the airways. FILT-T3, FILT-T4, FILT-T10 and FILT-T13 denote the filters attached to the outlets T3, T4, T10 and T13, respectively. All the other notations correspond to the ones presented on the left side of Fig. 2. The error bars represent standard deviation.
Journal of Aerosol Science 147 (2020) 105582
regions and underestimated the deposition in the straight tubes compared to the experimental values. However, in most of the cases, the simulated values were within the error range of the measured data. The discrepancy between the simulated and measured values of local deposition fractions of chitosan particles in asthmatics (lower panel of Fig. 8) was higher at the level of T2 tube and partly in BIF2 bifurcation, but the general trends agreed and total deposition fractions were also in fair agreement (30.1% by simulations and 32.0%
by experiments). To minimise the effect of upstream airways, the local deposition was quantified also in terms of deposition efficiency (number of particles deposited in a section/number of particles entering the same section). The corresponding results are presented in Fig. 9. Based on Fig. 9 the courses of the curves expressing the simulated and experimentally measured local deposition efficiencies are quite similar (deposition efficiency on the filters is by definition 100%). The discrepancies are somewhat higher at T2 and T10 branches. The differences between the simulation and experimental results in terms of deposition efficiencies confirm the earlier observation on higher simulated deposition at bifurcation regions and lower deposition in some of the tubes. Since for the current particle size distributions inertial impaction is the main deposition mechanism and impaction of the particles is the most likely in the bifurcation regions, it is plausible to state that the current CFD model slightly overestimates inertial impaction. Nevertheless, the relatively good agreement between the numerical and experimental deposition values for two different polydisperse particle systems indicates that the selected models appropriately describe the deposition of the inhaled aerosol particles.
3.2. Particle deposition in the realistic geometry
The results of the experimental measurements and simulations of deposition fractions of mannitol in the realistic upper and large bronchial airways assuming tidal nasal breathing of healthy subjects are depicted in the upper panel of Fig. 10. The numbering of the segments on the horizontal axis corresponds to the notations in Fig. 3. The logarithmic scale on the vertical axes was chosen to better highlight the trends among different segments. The results of the simulations fairly depict the trends revealed by the experimental measurements. Some differences can be seen mostly in segments 3–9 (trachea, main bronchi and lobar bronchi) where the simulations Fig. 9.Comparison between the measured and simulated values of local deposition efficiencies of polydisperse mannitol particles in healthy subjects (upper panel) and chitosan particles in asthmatics (lower panel). FILT-T3, FILT-T4, FILT-T10 and FILT-T13 denote the filters attached to the outlets T3, T4, T10 and T13, respectively. All the other notations correspond to the ones presented on the left side of Fig. 2.
�A. Farkas et al.
seem to slightly overestimate the deposition. The same tendency is emerging from the same measurements and simulations but with the results expressed in terms of deposition efficiencies, which are presented in the lower panel of Fig. 10. It seems that in the largest bronchial airways the numerical model overestimates the deposition of micron-sized particles to some extent. This observation is in line with the outcomes of a large benchmark study (Koullapis et al., 2018) which stated that k-ω models in combination with the discrete random walk model for the simulation of numerical diffusion may overestimate the deposition of micro-particles. Taking into account that the results refer to a polydisperse particle system and the airway geometry is of high complexity, it can be stated that there is a relatively good match between the experimental and numerical values. The good agreement provides confidence regarding the simulation results in cases when measurements are not available.
The primary aim of the parallel measurements and computations was to validate the numerical model and to demonstrate the potential of combined (experimental and numerical) methods in the quantification deposition in healthy and diseased airways.
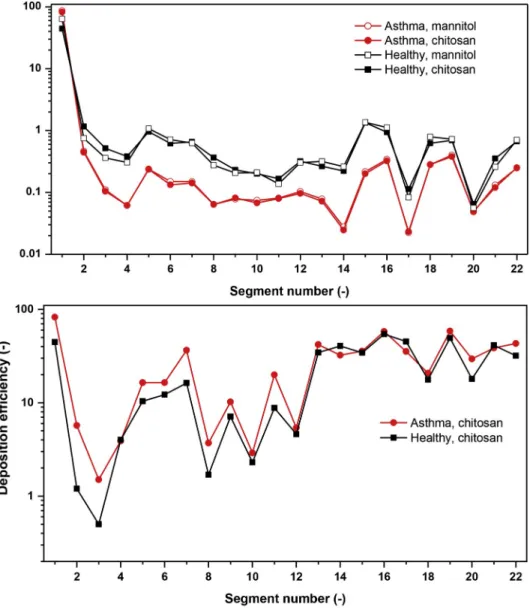
However, a direct comparison between the deposition patterns in healthy and asthmatic subjects is difficult due to a few reasons. One of them is the low number of patients considered. In reality, lobar airflow distribution may change from patient to patient and also among different populations of asthma patients (Choi et al., 2019b). Another reason is that asthmatic airway geometry may be different from the healthy one, which was not considered in the present work. Finally, the experimental measurements in the complex geometry were performed only for the healthy case, while the deposition values in the simple geometry of the healthy and asthmatic subjects plotted in Figs. 8 and 9 cannot be directly compared due to the different size distributions of mannitol and chitosan particles (the production of chitosan particles was discontinued at the the Faculty of Pharmacy of the University of Veterinary and Pharma- ceutical Sciences Brno and wee needed to switch to mannitol). However, numerical simulations were performed for both size dis- tributions in both cases. Fig. 11 demonstrates the computed deposition fractions and deposition efficiencies of chitosan and mannitol Fig. 10.Comparison between the measured and calculated values of deposition fractions (upper panel) and deposition efficiencies of mannitol particles in different sections of the realistic geometry assuming healthy subject and tidal nose breathing.
Journal of Aerosol Science 147 (2020) 105582
Fig. 11.Upper panel: Comparison between the calculated deposition fractions of chitosan and mannitol particles in healthy and asthmatic subjects at tidal nose breathing. Lower panel: Calculated deposition efficiency values of chitosan particles in healthy and asthmatic subjects.
Fig. 12.Comparison between lobar distributions of normalised deposition fractions of polydisperse chitosan and mannitol particles in healthy and asthmatic subjects.
�A. Farkas et al.
particles in the complex geometry of healthy and asthmatic individuals at tidal nose breathing.
It is evident from these results (Fig. 11, upper panel) that the deposition fraction values in the trachea and the bronchial segments are lower in asthmatic subjects. This is the result of the filtering effect of the upper airways which is stronger in asthmatics, especially during nose breathing. The Reynolds number in the tube connected to the facemask (diameter ¼0.02 m) varied in time between 0- 2390 for the breathing mode characteristic of healthy subjects and between 0-4974 for the asthmatics. It is worth noting that bron- chial deposition efficiency is still higher for asthmatics, but less particles enter this region, thus deposition fractions are lower. This can be clearly seen in the lower panel of Fig. 11, where deposition efficiencies of chitosan particles in healthy and asthmatic subjects are demonstrated. Based on the figure, in the large bronchi the deposition efficiency is higher in asthmatics. Although the case presented here cannot be considered as representative of large asthma populations, it still demonstrates that local differences between the particle deposition in healthy and diseased subjects can be revealed by carefully validated numerical models. The same is true for the lobar variations, which are presented in Fig. 12.
Fig. 12 demonstrates that the distribution of the deposited particles has changed due to the disease. In the special case considered in this work the normalised deposition (total lung deposition is 1) increased in the right lobes of asthma patients. At the same time, the sum of the depositions in the upper lobes increased and the sum of the depositions in the lower lobes decreased.
4. Conclusions
This study demonstrated that carefully validated numerical models can be a powerful tool in the characterization of inhaled particle deposition in the airways of both healthy and asthmatic subjects. Present results prove that both the modified breathing mode of asthmatics and the observed lobar flow redistribution in severe disease significantly modified the deposition distribution of micro- particles. The results suggest that the burden of inhaled detrimental particles in different parts of airways asthmatics can be different from that of healthy individuals exposed to the same environmental particle concentration. By the same token, the differences between healthy and asthmatic subjects in terms of the deposited amount of drug and its distribution should be taken into account when planning the treatment of asthmatics and elaborating the drug inhalation protocols. Despite of the fact that present results refer only to the special case of two polydisperse size-distributions, one airway geometry and a restricted number of healthy and asthmatic subjects, they clearly demonstrate the potential of the combined use of experimental and numerical techniques in the quantification of patient-specific airway deposition, but also in the calculation of particle deposition of larger populations of diseased individuals.
Declaration of competing interest
The authors declare no conflicts of interest.
Acknowledgement
This work was supported by the Czech Science Foundation under the grant GA18-25618S. The work of Arp� �ad Farkas was supported also by the J�anos Bolyai Fellowship of the Hungarian Academy of Sciences.
References
Achakulwisut, P., Brauer, M., Hystad, P., & Anenberg, S. C. (2019). Global, national, and urban burdens of pediatric asthma incidence attributable to ambient NO2 pollution: Estimates from global datasets. Lancet Planet Health, 3, e166–178.
Asthma, fact sheets, world health organization.(2016). Available at: https://www.who.int/news-room/fact-sheets/detail/asthma.
Belka, M., Lizal, F., Jedelsky, J., Elcner, J., Hopke, P. K., & Jicha, M. (2018). Deposition of glass fibres in a physically realistic replica of the human respiratory tract.
Journal of Aerosol Science, 117, 149–163.
Choi, S., Hofmann, E. A., Wenzel, S. E., Tawhai, M. H., Yin, Y., Castro, M., et al. (2013). Registration-based assessment of regional lung function data via volumetric CT images of normal subjects vs. severe asthmatics. Journal of Applied Physiology, 115, 730–742.
Choi, J., LeBlanc, L. J., Choi, S., Haghighi, B., Hoffman, E. A., O’Shaughnessi, P., et al. (2019). Differences in particle deposition between members of imaging-based asthma clusters. Journal of Aerosol Medicine and Pulmonary Drug Delivery, 32(4). https://doi.org/10.1089/jamp.2018.1487.
Choi, S., Miyawaki, S., & Lin, C. L. (2018). A feasible computational fluid dynamics study for relationships of structural and functional alterations with particle depositions in severe asthmatic lungs. Computational and Mathematical Methods in Medicine, 1–12. Article ID: 6564854.
Choi, S., Yoon, S., Jeon, J., Zou, C., Choi, J., Tawhai, M. H., et al. (2019). 1D network simulations for evaluating regional flow and pressure distributions in healthy and asthmatic human lungs. Journal of Applied Physiology, 127, 122–133.
Farkas, �A., & Bal�ash�azy, I. (2007). Simulation of the effect of local obstructions and blockage on airflow and aerosol deposition in central human airways. Journal of Aerosol Science, 38, 865–884.
Farkas, A., Lizal, F., Elcner, J., Jedelsky, J., & Jicha, M. (2019). Numerical simulation of fibre deposition in oral and large bronchial airways in comparison with � experiments. Journal of Aerosol Science, 136, 1–14.
Hofmann, W. (2011). Modelling inhaled particle deposition in the human lung – a review. Journal of Aerosol Science, 42, 693–724.
Horv�ath, A., Bal�ash�azy, I., Farkas, A., S� �ark�any, Z., Hofmann, W., Czitrovszky, A., et al. (2011). Quantification of airway deposition of intact and fragmented pollens.
International Journal of Environmental Health Research, 21, 427–440.
Inthawong, K., Tu, J., Ye, Y., Ding, S., Subic, A., & Thien, F. (2010). Effects of airway obstruction induced by asthma attack on particle deposition. Journal of Aerosol Science, 41, 587–601.
Jahani, N. (2016). Dynamic breathing lung models for healthy and asthmatic subjects based on assessment of regional lung function. PhD thesis. University of Iowa. Available at: http://ir.iowa.edu/etd/2095.
Jahani, N., Choi, S., Choi, J., Haghighi, B., Hoffman, E. A., Comellas, A. P., et al. (2017). A four-dimensional tomography comparison of healthy and asthmatic human lungs. Journal of Biomechanics, 56, 102–110.
Jahani, N., Choi, S., Choi, J., Iyer, K., & Hofmann, E. A. (2015). Assessment of regional ventilation and deformation using 4d-CT imaging for healthy human lungs during tidal breathing. Journal of Applied Physiology, 119, 1064–1074.
Journal of Aerosol Science 147 (2020) 105582 Koullapis, P., Kassinos, S. C., Muela, J., Perez-Segarra, C., Rigola, J., Lehmkuhl, O., et al. (2018). Regional aerosol deposition in the human airways: The SimInhale
benchmark case and the critical assessment of in silico methods. European Journal of Pharmaceutical Sciences, 113, 77–94.
Koullapis, P., Lizal, F., Jedelsky, J., et al. (2019). ERCOFTAC knowledge base: Application area 7: Biomedical flows - aerosol deposition in the human upper airways. [online].
Cyprus: Ercoftac, 21 October 2019 [cit. 2020-01-16]. Accessible from: https://kbwiki.ercoftac.org/w/index.php?title¼Abstr:AC7-01.
Lizal, F., Elcner, J., Hopke, P. K., Jedelsky, J., & Jicha, M. (2012). Development of a realistic human airway model. Journal of Engineering in Medicine, 226(3), 197–207.
Lizal, F., Jedelsky, J., Morgan, K., Bauer, K., Llop, J., Cossio, U., et al. (2018). Experimental methods for flow and aerosol measurements in human airways and their replicas. European Journal of Pharmaceutical Sciences, 113, 95–131.
Longest, P. W., Vinchurkar, S., & Martonen, T. (2006). Transport and deposition of respiratory aerosols in models of childhood asthma. Journal of Aerosol Science, 37, 1234–1257.
Luo, H. Y., Liu, Y., & Yang, X. L. (2007). Particle deposition in obstructed airways. Journal of Biomechanics, 40, 3096–3104.
Martonen, T., Fleming, J., Schroeter, J., Conway, J., & Hwang, D. (2003). In silico modelling of asthma. Aerosol Drug Delivery Reviews, 55, 829–849.
Nemmar, A., Hoet, P. H. M., Vanquickenborne, B., Dinsdale, D., Thomeer, M., Hoylaerts, M. F., et al. (2002). Passage of inhaled particles into the blood circulation in humans. Circulation, 105, 411–414.
Oberd€orster, G., Sharp, Z., Atudorei, V., Elder, A., Gelein, R., Krezling, W., et al. (2004). Translocation of ultrafine particles to the brain. Inhalation Toxicology, 16, 437–445.
Ounis, H., & Ahmadi, G. (1990). A comparison of Brownian and turbulent diffusion. Aerosol Science and Technology, 13, 47–53.
Sears, M. R. (2007). Lung function decline in asthma. European Respiratory Journal, 30, 411–413.
The Global Asthma Report. (2018). Auckland, New Zealand. Global Asthma Network, 2018. Available at: http://globalasthmareport.org/Global%20Asthma%20Report
%202018.pdf.
Weibel, E. R. (1963). Morphometry of the human lung. Berlin, Heidelberg: Springer-Verlag.
Xu, J. (2016). Modification of stochastic model in Lagrangian tracking method. In H. Nilsson (Ed.), Proceedings of CFD with OpenSource software. Available at: http://
www.tfd.chalmers.se/~hani/kurser/OS_CFD/#YEAR_2016.
Yang, X. L., Liu, Y., & Luo, H. Y. (2006). Respiratory flow in obstructed airways. Journal of Biomechanics, 39, 2743–2751.
�A. Farkas et al.