The Impact of the First Wave of Covid-19 on the Financial Security of Economics Students in Higher Education
Botond Kálmán
Hungarian University of Agriculture and Life Sciences Kalman.Botond@phd.uni-mate.hu
Judit Bárczi
Hungarian University of Agriculture and Life Sciences barczi.judit@uni-mate.hu
Zoltán Zéman
Hungarian University of Agriculture and Life Sciences uzleti.szabalyozas@uni-mate.hu
summary
our study examines the financial literacy of students in higher education studying economics.
Literature shows that financial literacy is becoming more valuable, but this increasingly important knowledge is not accompanied by practical results. Therefore, the sense of financial security is also reduced, especially if an unexpected major economic crisis occurs. The reasons for this decline have been investigated. Hungarian and foreign students were interviewed in a two-phase offline questionnaire survey. The first wave of coVID-19 took place between the two surveys to model the economic crisis. The questions assessed students’ theoretical knowledge, financial behaviour, and attitudes towards finance. We also asked how they rated their own financial situation and sense of security. After statistically processing the responses, linear models were set up to identify the factors that played a role in the development of financial security. our most important result is that the year of the survey influences all dimensions of financial culture, which verifies the role and effect of the crisis caused by the outbreak.
Keywords: financial literacy, environmental crisis, economic higher education, financial security JEL codes: G53, A22, D14, G01
DoI: https://doi.org/10.35551/PFQ_2021_3_3
W
What is financial literacy? How is it manifested in the everyday lives of today’s higher education students? Does it help young people entering the labour market to make financial decisions?Does a degree in economics and knowledge of economics provide a significant advantage in navigating everyday finances? How does an unexpected recession affect seemingly workable habits? This paper provides contributions to answering these questions.
Nowadays, the proper management of personal finances is increasingly important. The level of financial culture is basically indicated by a knowledge-based understanding of different financial skills and effective decisions (Németh, 2015). Among the components of this culture (knowledge, behaviour, attitude), behaviour is the most important in practice (Bárczi, Zéman, 2015). until the mid-2010s, it remained a literary fact that young people lack financial literacy (Bhushan, Medury, 2013). The financial literacy of young people has been the subject of several studies (Béres et al., 2013; Németh et al., 2017). According to a report of the state Audit office of Hungary (Béres et al., 2020), the level of financial literacy of Hungarian 18-25 year olds has not changed since 2013, either. By 2017, a national strategy was prepared, in which financial education was given a prominent role. This education was assessed in two research studies in 2017 and 2020, respectively (Németh, 2017; Németh et al., 2020). The main finding of the latter report is that group interactive methods are not sufficiently used in university business education, either.
one of the effects of the pandemic has been a decline in financial well-being. However, the term is not about health, nor is it about material well-being. That is why we prefer to translate it as financial security. In 1993, Porter and Garman found that demographic factors, family and wealth status and financial literacy determine financial security. of the three, the
role of financial literacy stands out (Brilianti and Lutfi, 2020), modified by demographic factors. (Joo, Grable, 2004). People with adequate financial literacy tend to save more and also invest more (Pangestu, Karnadi, 2020). According to Sabri and Falahati (2013), financial literacy and behaviour also play a major role in the financial security of employees.
The understanding of financial security differs between the two genders (Zyphur et al., 2015): for women it is mainly a question of self-evaluation and for men it is higher income. For entrepreneurs, in addition to self- evaluation, good financial skills are important (Patel, Wolfe, 2019). one in four workers reported a deterioration in their financial situation in spring 2020 (otto, 2020). Middle and top managers are less likely to perceive that they cannot control their finances or have no money left at the end of the month (Buchler et al., 2009). There are also differences between countries. In the Eu’s ten-point financial satisfaction survey, Austria scored the highest of the countries we studied (7.3), followed by Hungary and slovakia with 5.5 points (Eurostat, 2019).
All areas of financial security have been affected by the pandemic. Two out of three American students felt more uncertain about their financial future and nearly half of them cited the coronavirus as the reason for that (Kiernan, 2020). 81% of students reported a significant decrease in their family income (Jones et al., 2021), with three quarters indicating that they had to rethink how to finance their higher education costs (Grocholski, Griesmer, 2021). A good indicator of the financial situation is the ability to raise funds to cover unexpected expenses, which has declined due to the pandemic (coibion et al., 2020). At the same time, 61% of students have improved their financial literacy, especially in the area of savings.
Reviewing the literature, we could not find any national survey comparing the performance of students in higher education before covid-19 with their performance during the crisis, in an international context.
We aim to fill this research gap with our work.
Objective
This work is based on a larger complex study on the financial knowledge, behaviour and attitudes of business and non-busi- ness students in higher education. covid-19 provided an opportunity to assess the impact of an environmental-economic crisis and to investigate whether economic education mitigates the impact of the crisis.
MethOd
our primary data were collected through a questionnaire survey of university students.
The original complex research was essentially attitudinal in nature. Therefore, the sample was based on relational capital, in the knowledge that the representativeness of the resulting sample is questionable. We asked our university acquaintances to distribute the questionnaires and then to collect and return them to us. Although at first sight the sampling technique seems to follow the snowball method, that is not the case.
Indeed, the facilitators who distributed the questionnaires did not ask the respondents to further distribute the questionnaires, so the acquaintances of acquaintances were not included in the sample. We sampled the universities of the facilitators available to us, where we administered our questionnaire twice. This made it possible to compare responses before and during the pandemic. our
sampling (Kapitány, 2010). unfortunately, a major drawback of this procedure is that it is designed to study hidden populations.
Therefore, it cannot be made representative by post-weighting, only by narrowing the sample. In other words, our sample would be representative if we titled the present study
‘The impact of the first wave of coVID-19 on the financial security of students studying economics at the Budapest Business school, the Vienna university of Economics and Busi- ness and the Economic university of Bratisla- va’. However, we can say that the normality of our sample is adequate for statistical analysis.
According to the theorem of the central li- mit distribution, as the number of items in the sample increases, the sample means will follow an increasingly normal distribution.
If the number of elements in the sample is sufficiently large (n>100), which criterion is met in our case, normality is plausible based on the theorem (Huba, Lipovszki, 2014).
The organisation for Economic co- operation and Development (oEcD) uses its own methodology to measure financial literacy (Kossev, 2020). In this, the components of financial literacy are divided into three sub- areas and scored separately for
financial literacy
financial behaviour
financial attitudes.In our research, we used our own questionnaire based on the oEcD methodology, supplemented with questions on financial security perceptions (cFPB, 2017).
The response rate for the offline questionnaire was 92%, double the usual response rate for online questionnaires (Ilieva et al., 2002). our questionnaire was self-administered, typically consisting of closed questions, except for the question relating to age. We included all grouping criteria, such as country, university, and job title, in the demographic questions
multiple-choice questions were used to answer the closed questions. The same questionnaire was asked in 2019 and 2020. The questionnaire was first prepared in Hungarian and then translated into English. The translation also took into account the differences between the specificities of the educational systems. In order to avoid misunderstandings, we asked for and received help and advice from the same people who helped us to distribute the questionnaires in the given universities. They were familiar with the characteristics of their own study systems, after all. We were thus able to ensure that the translated text was identical in content to the original questionnaire. The interpretation of the Likert scales was not a problem either, as we only marked the two endpoints of our scales with also a text next to the number, e.g.:
Please indicate to what extent the following statements apply to you:
1 = not at all, 2 3 4 5 = completely.
Thus we avoided any possible misunderstandings when translating and gave the respondent more freedom to judge their situation, because they were not trying to find the options suiting them best from a predefined set of answers. Data were recorded using Microsoft Excel spreadsheet, pre-coding and data cleaning were performed using the R software package.
The overall measure and component of financial security perceptions were analysed by fitting linear models. The outcome variable in the models was the sense of financial security, the explanatory variables were demographic variables and our ‘financial literacy’ and
‘financial attitudes’ indices, as well as the year of the survey, the latter also serving as a moderating variable. Based on these, we fitted ANcoVA linear models, respectively, with the significance level of the statistical tests set at 5%.
In constructing our model, we had two main objectives. one was to estimate financial
security perceptions using variables of interest to us as predictors, and the other was to see the correlation between our input variables and financial security perceptions. In constructing the models, we started from models with all possible explanatory variables and then progressively eliminated non-significant explanatory variables to arrive at the final models.
since the year of the survey, i.e. the actual impact of the pandemic, was the most important for the hypotheses, only interactions with this variable were included in the model. In addition, we included continuous explanatory variables, covariates in the analysis, such as demographic variables, data on the nature of the studies and our aggregated indices ‘financial literacy’ and ‘financial attitudes’.
The initial model for all questions was as follows:
Y=β0+β1 X1i+β2 X2i+β3 X3i+β4 X4i+β5 X5i+β6 X6i+ +β7 X7i+β8 X8i+β9 X9i+β10 X10i+
+β11 X1i X2i+β12 X1i X3i+β13 X1i X4i+β14 X1i X5i+β15 X1i X6i+ +β16 X1i X7i+β17 X1i X8i+β18 X1i X9i+β19 X1i X10i where:
X1: year of survey (2019; 2020)
X2: country (Hungary, Austria, slovakia) X3: work schedule (full-time, part-time) X4: occupation (physical work and university
student, intellectual work and university student, university student)
X5: position (subordinate, middle manager, top manager, entrepreneur, student only) X6: gender (female, male)
X7: age
X8: marital status (1 = single ... 5=in a close emotional relationship)
X9: financial literacy X10: financial attitudes
The last nine items were included to examine the effect of interactions. Their design was based on the assumption that the
level of the year of the survey as a variable influences the magnitude of the marginal effect of the other variables mentioned. Note that significant interactions can be found for only four variables (country, age, gender and financial literacy) when fitting the models.
descriptiOn Of the saMple
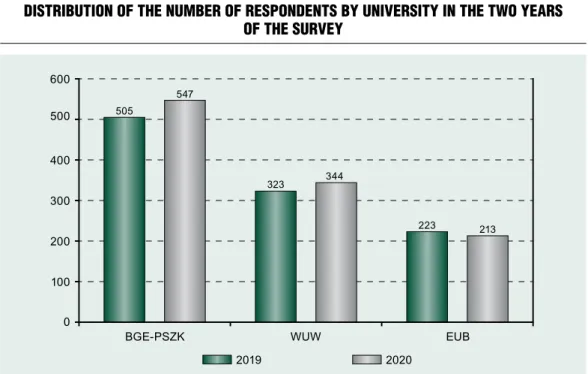
Before presenting our results, we introduce the descriptive statistics of the sample. In this study, we focus only on economics students (Figure 1). In 2019, 1,051 and in 2020, 1,104 evaluable questionnaires were returned.
In both years, the proportion of male and female respondents was about 70% and 30%
respectively. The proportion of full-time and part-time students was similar.
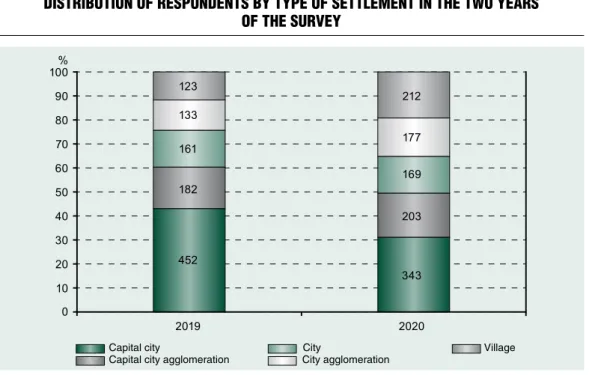
The distribution by type of residence is shown in Figure 2.
students who work while studying are mostly engaged in intellectual activities; only 6% of them have a physical job besides their studies (Figure 3). The proportions by the classification of position are shown in Figure 4.
By age, the distribution of the two surveys is very similar (Figure 5).
results
We start the presentation of our results with the ANcoVA models: among the fit- ted models, the explanatory power of the model for general perception of safety is the strongest (62.30%). Examining the effect size of each explanatory variable, we found that
Figure 1 Distribution of the number of responDents by university in the two years
of the survey
Note: bGe-psZK - budapest business school, WuW– vienna university of economics and business, eub – economic university of bratislava,
Source: own edited
Figure 2 Distribution of responDents by type of settlement in the two years
of the survey
Source: own edited
Figure 3 Distribution of responDents by type of occupation in the two years
of the survey
Source: own edited
Capital city City Village Capital city agglomeration City agglomeration
Physical work and university studentCapital city Intellectual work and university student University student
Figure 4 Distribution of responDents by position in the two years of the survey
Source: own edited
Figure 5 age Distribution of responDents in the two surveys
Subordinate Top manager Student Middle manager Entrepreneur
Number of students
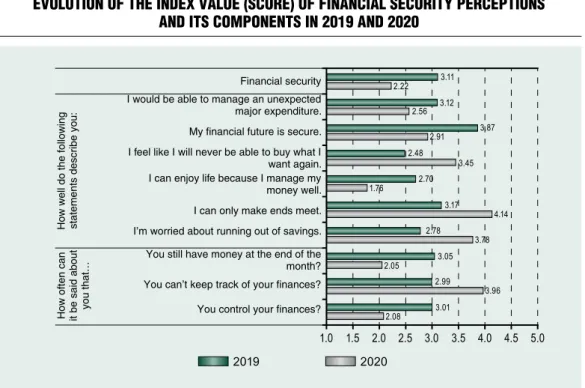
the year of the survey was the most important determinant of how responses were dispersed across the entire sample; it accounted for the largest differences (Figure 6).
The figure clearly shows that in almost all cases, the difference between the 2019 and 2020 averages is up to a quarter of the theoretical maximum standard deviation (4).
These results alone show that the negative effects of covid-19 have had a strong impact on economics students’ perceptions of financial security. This significant effect supports the results reported in the literature, such as the pieces published by Grocholski and Griesmer (2021) or Jones et al (2021).
The results for each model are as follows.
Financial Security Perceptions (WB_AVG) only the year of survey, the respondent’s position, the level of financial literacy and the
financial attitudes had a significant effect on the development of financial security (mean 2.68). These explain 62.30% of the variance in the perception of security. An important finding is that the year of survey had the largest effect (57.18%) on the perception of security, the other variables being more indicative. This means that the virus situation had an equally negative impact on everyone:
over a year the average value of the financial security perception indicator fell from 3.11 to 2.22 on the five-point scale we used.
The only significant impact of the position was that the students who also ran a business while being a university student had a significantly lower financial security score (2.54) than the average of the other four groups, which did not differ significantly (Figure 7).
Among the quantitative explanatory variables, we found significant effects in two
Figure 6 evolution of the inDex value (score) of financial security perceptions
anD its components in 2019 anD 2020
Source: own edited
I would be able to manage an unexpected major expenditure.
My financial future is secure.
I feel like I will never be able to buy what I want again.
I can enjoy life because I manage my money well.
I can only make ends meet.
I’m worried about running out of savings.
You still have money at the end of the month?
You can’t keep track of your finances?
You control your finances?
Financial security
How well do the following statements describe you:
How often can it be said about you that…
cases; these are financial literacy and financial attitudes. Both have a negative effect on the perception of financial security (Table 1).
In other words, the higher the level of one’s financial literacy and attitudes, the more they see how much more secure they could feel.
The overall indicator of financial security perception increased by one point from 2019 to 2020 in almost all demographic groups.
The effect of each of the position groups,
financial intelligence and financial attitudes is also small. The results for the questions describing overall perceptions of security are presented below.
I would be able to manage an unexpected major expenditure. (WB_1_1)
The first component of financial security perception has the lowest explanatory power (6.93%), with an overall sample mean of
Figure 7 scores of financial security perceptions in each group in the two years
of the survey
Source: own edited
Table 1 effect of quantitative variables in the financial security perception moDel
variable parameter
sig.
fin_iQ_ratiO_2 –0.2950 0.0033
fin_att_ratiO_2 –0.1283 0.0178
Source: own edited
Subordinate Middle manager Top manager Entrepreneur Student only
2019 Average of the two years 2020
2.84. This was significantly affected by four variables: year of survey (η2=0.0533), the country of the respondent (η2=0.0027), occupation (η2=0.0057) and financial attitudes (η2=0.0031). The year of the survey does not significantly moderate the effect of any other variable, i. e. all significant effects were as valid in 2019 as in 2020. This suggests that students’ preparedness for unexpected expenses deteriorated, but it was not this dimension that was most affected by the epidemic (Figure 8).
This is consistent with the observation of Coibion et al. (2020) mentioned above.
In terms of occupation (Figure 9), students who also had a generally higher paid intellectual job were the least burdened by an unexpected expenditure (3.01). No significant difference was found between those with a physical job in addition to university and those being only university students (p=0.681).
Financial attitudes were the only variable that had a significant (p=0.0097) effect on the ability to manage unexpected expenditures.
The effect is negative (–0.47), meaning that the more determined one’s attitude towards finances, the less likely they feel that financing an unexpected expenditure is a problem.
My financial future is secure. (WB_1_2)
The mean of the long-term perception of security was 3.38, the explanatory power of the model was 20.12%, which was based on the only significant variable, the year of the survey (p<0.001). The mean decreased by 20% in the year passed. since the other variables included in the model do not have a significant effect on the responses, we can conclude that the virus situation was the only cause of the decline in long-term financial security perceptions, as found by Kiernan (2020).
Figure 8 scores for the ability to manage unexpecteD expenDiture in each country
in the two years of the survey
Source: own edited
2019 Average of the two years 2020
HUN AUT SVK
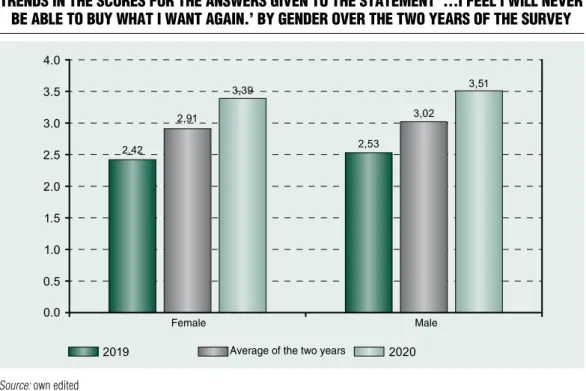
I feel like I will never be able to buy what I want again. (WB_1_3)
This question measured opinion (pessimism).
The average of the answers received is medium (3.01). The explanatory power of the model is rather low (15.75%); the year of the survey is responsible for a significant part of the effect (η2=0.1569), and only a minor part is due to the gender of the respondent (η2=0.0024). The significant difference between women (2.91) and men (3.02) (p=0.024) shows that men are more pessimistic in both years (Figure 10). The gender difference did not change in a year, so the pandemic had an equally adverse effect on everyone on this dimension as well.
I can enjoy life because I manage my money well. (WB_1_4)
This question assessed self-evaluation by
satisfaction. The overall sample mean of the responses was 2.26, and the fitted model had an explanatory power of 44.67% (medium). In this model, the year of interview (η2=0.3580), the country of the respondent (η2=0.0339), position (η2=0.0113), the quality of private life (η2=0.0058), and the level of financial literacy (η2=0.0090) and attitudes (η2=0.0037) had a significant effect. The survey year did not significantly modify the effect of the other variables. The mean of the responses given in 2019 is lower than the theoretical mean (3.0) and decreased significantly (p<0.001) further by 2020 (1.76). A significant relation can be established between the three countries (Figure 11): the self-evaluation of slovak students is the highest (2.41), and that of the Hungarian students is the lowest (2.11).
A significant difference by position Figure 9 trenDs in the scores for the ability to solve unexpecteD expenDiture
in each occupation group
Source: own edited
2019 Average of the two years 2020 Physical work and university
student Intellectual work and university
student University student
Figure 10 trenDs in the scores for the answers given to the statement ‘...i feel i will never
be able to buy what i want again.’ by genDer over the two years of the survey
Source: own edited
Figure 11 trenDs in the scores for the answers given to the statement ‘...i can enjoy life because
i manage my money well.’ for the three countries in the two years of the survey
Source: own edited
Average of the two years
Average of the two years
Female Male
of university students who were also running a business (2.09) and those who were only university students (2.34), at the two ends of the scale. In both years, the lowest mean was that of the entrepreneurs and the highest was that of those being students only (Figure 12).
Three of the quantitative variables had a significant effect on that appropriate management of finances also leads to enjoyment of life. stronger emotional ties
had a positive effect, while the level of financial literacy and financial attitudes had a negative effect. A likely explanation is that greater knowledge reveals the gaps that cause satisfaction to decline (Table 2).
However, the effect of these group characteristics is negligible compared to the effect of the virus, causing a drop of almost a whole point in the average of the responses on the five-point scale.
Figure 12 trenDs in the scores for the answers given to the statement ‘...i can enjoy life because i manage my money well.’ by work scheDule in the two years of the survey
Source: own edited
Table 2 effect of quantitative variables in the moDel of responses to the statement
‘...i can enjoy life because i manage my money well.’
variable parameter sig.
Marital status 0.0368 0.0004
financial literacy –0.7349 <0.0001
financial attitudes –0.2545 0.0047
Source: own edited
Subordinate Middle manager Top manager Entrepreneur Student only
2019 Average of the two years 2020
I can only make ends meet. (WB_1_5)
The mean of the responses to the question in the whole sample is 3.65, the explanatory power of the model is 39.68%, (medium).
Financial welfare is primarily influenced by the year of the survey (η2=0.3460), the other variables have orders of magnitude less influence.
From 2019 to 2020, the average of the responses increased by one point. Thus, this dimension of students’ perception of financial security has eroded significantly as a result of the pandemic. There is no significant difference between women and men, i.e. the significant interaction is due to the different trend (Figure 13).
The slope of the line fitted for financial literacy in 2020 is almost zero, i.e. welfare is independent of the level of financial literacy.
The scale of the increase due to the the impact of the covid-19 pandemic is in itself worrying;
an average above 4.0 means that the pandemic has taken a big toll on financial security.
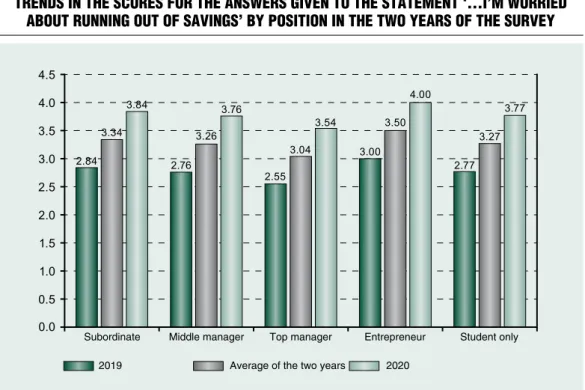
I’m worried about running out of savings.
(WB_1_6)
The mean value of worrying about running out of savings was 3.30 across the sample; the significant variables account for 35.9% of the value of the responses. only the year of survey and the position had a significant (p<0.001) effect; the former explained 35.42% and the latter 1.22% of the variance of the outcome variable. concern about running out of savings was significantly amplified in the wake of the pandemic: increased from 2.78 to 3.78.
This sharp increase is of course significant and clearly illustrates the financial strain the virus
Figure 13 trenDs in the scores for the answers given to the statement ‘...i can only make
enDs meet.’ by genDer in the two years of the survey
source: own edited
Average of the two years
Female Male
situation has had on the population under study.
significant differences in terms of position were found across the whole database; these follow the same trend in the sub-samples created by the year of survey. concern about running out of savings was lowest among top managers (3.04), with subordinates, entrepreneurs and students being significantly more concerned. The most worried students who were also running a business, had a significantly (p=0.003) higher mean (Figure 14) even compared to those being students only.
Almost all social groups showed a significant increase in their concern forecasting the involuntary depletion of their savings due to the pandemic. Although significant differences by position can be detected, this effect is much
smaller compared to what could be observed from one year to the next.
Do you still have money at the end of the month? (WB_2_2)
In the total sample, the mean of the responses was 2.61 and a total of 35.57% of the variance of individual responses was explained by significant variables, year of survey (p<0.001;
η2=0.3404) the country of the respondent (p=0.005; η2=0.0048) and position (p=0.019;
η2=0,0055). In 2019 we still measured a sample mean very close to the theoretical mean (3.05). This decreased by one point by 2020, so that economics students were significantly (p<0.001) less likely to have money left at the end of the month. For the three countries studied (Figure 15), the only significant difference (p=0.004) is between the
Figure 14 trenDs in the scores for the answers given to the statement ‘...i’m worrieD
about running out of savings’ by position in the two years of the survey
Subordinate Middle manager Top manager Entrepreneur Student only
2019 Average of the two years 2020
means of Austria (2.61) and slovakia (2.48).
Hungary’s average (2.56), which is in between the two, does not differ significantly from either the Austrian (p=0.202) or the slovakian average (p=0.116).
When comparing the position groups, a significant difference (p=0.021) can only be found between those being students only with the highest average (2.64) and entrepreneurs with the lowest average (2.44): those being students only have the most money left at the end of the month and entrepreneurs the least (Figure 16).
In 2020, economics students run out of money at a spectacularly higher rate by the end of the month than they did in 2019 (the almost familiar one-point change is observed also in this case). This trend affected slovak students the most, Austrian students the least (Hungarians are among the other two
nations); by position, it affected entrepreneurs the most and those being only students the least. However, the difference between the two demographic groups was the same in both years, so the likelihood of an undesirable event occurring was increased by the virus in the same way in all the groups we examined.
You can’t keep track of your finances?
(WB_2_3)
The mean of the responses to the statement on keeping track of finances was 3.49 and the explanatory power of the model was 37.66%.
The year of survey (p<0.001; η2=0.3288) and level of financial literacy (p=0.007; η2=0.0034) had significant influencing power in the model.
There was a visible and significant increase of almost a whole point by 2020 (p<0.001), thus demonstrating the damage caused by the pandemic in the area of finance along this
Figure 15 evolution of the scores for the question ‘...Do you still have money at the enD
of the month?’ for the three countries over the two years of the survey
Source: own edited
2019 Average of the two years 2020
dimension. According to the other significant (p=0.0072) effect, the level of financial literacy has a positive effect (B=0.4791) on whether one can keep track of their finances. Thus, the virus situation not only had a detrimental effect on the specific financial situation, but also on the ability to keep track thereof.
Do you control your finances? (WB_2_4) The mean of the responses to the question on managing finances was 2.58 across the whole sample, with 39.78% of the variance thereof explained by the three significant variables in the model. The year of survey had the largest effect in the model (p<0.001; η2=0.3455);
position (p<0.001; η2=0.0108) and the level of financial literacy (p=0.020; η2=0.025) had only a more moderate effect size.
The average of the responses given to this
range in 2019 (3.01), but a year later – showing a remarkable decrease – it was already in the lower range (2.08). Again, this suggests that the pandemic has had a strong and significant (p<0.001) negative impact on the financial management of economics students’
perception of financial security.
By position, it can be seen that university students who were also students and entrepreneurs (2.39) felt significantly less in control of their finances than those who were only students (2.62; p=0.001) or who were also in a top managerial position (2.68;
p=0.004). No significant difference was found for the other positions (Figure 17).
The level of financial literacy showed a significant (p=0.0197) negative effect (B=
–0.3929) on the control of finances, i.e., if the student’s level of financial literacy is Figure 16 trenDs in the scores for the answers given to the question ‘...Do you still have
money at the enD of the month?’ by position in the two years of the survey
Source: own edited
Subordinate Middle manager Top manager Entrepreneur Student only
2019 Average of the two years 2020
of their finances. overall, it can be concluded that the level of control over finances also decreased sharply as a result of the pandemic for all demographic groups. This result differs somewhat from Kiernan’s (2010) finding that increased financial knowledge as a result of the pandemic primarily improved the ability to save.
cOnclusiOns
Before interpreting our results, we would like to return to the question of the interpretability of the sample. one of the most important issues is the question of normality, which determines the way in which the statistics are processed, and which is discussed in the Method section. Another interpretability issue is the representativeness of the sample.
Given the sampling procedure described in the methodology section, our sample is probably not representative. Therefore, a broader sample is necessary to broaden the boundaries of the study later on. However, as our original study mentioned in the objective section was an attitude research, this was not an insurmountable problem in the original research. Indeed, our aim is to assess the extent to which the performance and outcomes of the university students we can reach coincide with the findings in the international literature.
In interpreting the results, we need to consider the limitations of the research in terms of sample, model and time. The sample is not representative due to the sampling method, but the present analysis is part of a larger complex study, and therefore respondents meeting the criteria were selected from its sample. The limitation of the model is Figure 17 trenDs in the scores for the answers given to the question ‘... you control
your finances.’ by position in the two years of the survey
Source: own edited
Subordinate Middle manager Top manager Entrepreneur Student only
2019 Average of the two years 2020
the model itself. Indeed, linear models are only an approximation, but often do not deviate significantly from reality and are much easier to handle mathematically. The limitation of time is also worth considering because, although the pandemic is not yet over, vaccination is already available, so it is not certain that our research will be repeatable.
The first and most important lesson is that the year of the study has had a significant impact on financial security as a whole and on each of its components. In the majority of cases, we have seen a drop of 20%, and less frequently 10%, in the trends of responses to each question. A further impact of the pandemic is that while in 2019 greater financial knowledge still helped to address livelihood concerns, in 2020 it tended to reinforce the feeling in respondents that they did not know enough to manage their situation. The level of financial literacy had the same impact on the ability to manage finances.
The burden of unexpected expenditures is felt most by slovak students and least by Austrian students, but the most successful in covering expenditures are Hungarians, especially those who have an intellectual job in addition to their studies. Pessimism about the financial security of the future has increased by 2020, with respondents fearing that out of necessity savings will run out and living standards will fall. The number of those being able to save fell by 20% by 2020 compared to the previous year. The decline was most remarkable among Hungarian students, especially among those who were also studying and running a business. In fact, most entrepreneurs have no money left at the end of the month. However, the representation of those who can only make ends meet also increased by 20% in the year that passed.
The ability of economics students to save has been less affected by the virus situation
examined earlier. The main reason for this is that we already measured a relatively low average in 2019, which declined slightly further by 2020. Among the countries, Hungary fell behind Austria and slovakia even more during the pandemic than in the previous year. There is also a shift by age: younger students were able to save their income rather before the pandemic, while older students were able to save during the pandemic.
In terms of financial security perception, the three countries showed a mixed picture, with Hungarians having the best results along some dimensions (ability to cope with unexpected expenditures), but generally the highest levels of security were found among Austrians or slovaks. students with a business besides university, especially those with an intellectual occupation, almost always reported the worst financial security, and those who were only students or who also held top manager’s position reported the best. There were only rare differences by gender, with men complaining more about lost aspirations and women about worsening everyday financial circumstances. Full-time students had more problems with weddings, birthdays and presents than part-time students. The level of financial literacy and attitudes had a negative impact on some dimensions of financial security, which may be mainly due to the fact that a broader knowledge better highlights where gaps still exist.
Perception of overall financial security have declined by nearly 20%, across all demographic groups. The year of the survey was most responsible for the decline, the demographic grouping criteria did not have a significant impact on the perceived decline.
combining these facts, it is clear that the covid-19 crisis has had a significant negative impact even on students of higher education majoring in economics, with above average
■
References Bárczi, J., Zéman, Z. (2015). A pénzügyi kultúra és annak anomáliái [Financial culture and its Anomalies]. Polgári Szemle, 11(1–3), pp.
101–108, Available at: https://polgariszemle.
hu/archivum/93-2015-junius-11-evfolyam-1-3- szam/gazdasagpolitika/651-a-penzuegyi-kultura- es-annak-anomaliai (Download date: 4 March 2021)
Béres, D., Huzdik, K., Deák-Zsótér, B., Németh, E. (2020). Felmérés a felsőoktatásban tanuló fiatalok pénzügyi kultúrájáról [Survey on the Financial Culture of Young People in Higher Education]. Research report, state Audit office, Available at: https://
www.asz.hu/storage/files/files/elemzesek/2021/
felsooktatas_penzugyikultura_20210311.pdf?ctid=
1307 (Download date: 2 April 2021)
Béres, D., Huzdik, K., Kovács, P., sápi, Á., Németh, E. (2013). Felmérés a felsőoktatásban tanuló fiatalok pénzügyi kultúrájáról [Survey on the Financial Culture of Young People in Higher Education]. Research report, state Audit office, Available at: https://www.asz.hu/storage/files/
files/szakmai%20kutat%c3%A1s/2013/t353.
pdf?download=true (Download date: 1 March 2021)
Bhushan, P., Medury, Y. (2013). Financial Literacy and its Determinants. International Journal of Engineering, Business and Enterprise Applications, 4(2), pp. 155–160, Available at: http://iasir.net/
IJEBEApapers/IJEBEA13-145.pdf (Download date:
30 April 2021
Brilianti, T. R., Lutfi, L. (2020). Pengaruh Pendapatan, Pengalaman Keuangan Dan Pengetahuan Keuangan Terhadap Perilaku Keuangan Keluarga Di Kota Madiun. Journal of Business and Banking, 9(2), pp. 1–17, Available at: https://journal.
perbanas.ac.id/index.php/jbb/article/view/1762/pdf (Download date: 18 June 2021)
Buchler, s., Haynes, M., Baxter, J. (2009).
casual Employment in Australia: The Influence of Employment contract on Financial Well-being.
Journal of Sociology, 45(3), pp. 271–289, https://doi.org/10.1177/1440783309335648
coibion, o., Gorodnichenko, Y., Weber, M.
(2020). The cost of the covid-19 crisis: Lockdowns, Macroeconomic Expectations, and consumer spending. [report no. w27141]. National Bureau of Economic Research, Available at: https://www.nber.
org/system/files/working_papers/w27141/w27141.
pdf (Download date: 28 April 2021)
Grocholski, E., Griesmer, B. (2021). survey Finds 2020 High school Graduates Delayed college Plans, concerned about Financial security. [online]
Business Wire, https://www.businesswire.com/news/
home/20210406005753/en/survey-Finds-2020- High-school-Graduates-Delayed-college-Plans- concerned-About-Financial-security (Download date: 26 May 2021)
Huba A., Lipovszki G. (2014). Méréselmélet (Measurement Theory). BME-MoGI, Available at: https://regi.tankonyvtar.hu/hu/tartalom/tamop 412A/2011-0042_mereselmelet/adatok.html (Download date: 22 May 2021)
Ilieva, J., Baron, s., Healey, N. M. (2002).
online surveys in Marketing Research. International Journal of Market Research, 44(3), pp. 1–14, https://doi.org/10.1177/147078530204400303
Jones, H. E., Manze, M., Ngo, V., Lamberson, P., Freudenberg, N. (2021). The Impact of the coVID-19 Pandemic on college students’
Health and Financial stability in New York city:
Findings from a Population-Based sample of city university of New York (cuNY) students, Journal of Urban Health, 98(2), pp. 187–196,
https://doi.org/10.1007/s11524-020-00506-x
Joo, s., Grable, J. E. (2004). An Exploratory Framework of the Determinants of Financial satisfaction. Journal of Family and Economic Issues, 25(1), pp. 25–50,
https://doi.org/10.1023/B:JEEI.0000016722.37994.9f Kapitány, B. (2010). Mintavételi módszerek ritka populációk esetén. (sampling methods for rare populations.) Statisztikai Szemle (Statistical Review), 88(7–8), pp. 739–754, Available at: http://
www.ksh.hu/statszemle_archive/ 2010/2010_07- 08/2010_07-08_739.pdf (Download date: 20 April 2021)
Kiernan, J. (2020). college student Financial survey. [online] WalletHub, https://wallethub.
com/blog/college-banking-credit-cards/65596 (Download date: 17 February 2021)
Kim, K. T., Lee, J. M., Hong, J. E. (2016). The Role of self-control on Retirement Preparedness of us Households. International Journal of Human Ecology, 17(2), pp. 31–42,
https://doi.org/10.6115/ijhe.2016.17.2.31
Kossev, K. (2020). OECD/INFE 2020 International Survey of Adult Financial Literacy.
[Report], Available at: https://www.oecd.org/
financial/education/oecd-infe-2020-international- survey-of-adult-financial-literacy.pdf (Download date: 20 February 2021)
Németh, E. (2015). Nem megtanulni, megérteni kell a dolgokat. [This is not about Memorisation but comprehension.]. Pénzügyi Szemle, Available: https://
www.penzugyiszemle.hu/interju/nem-megtanulni- megerteni-kell-a-dolgokat-interju-nemeth-erzsebettel (Download date: 27 February 2021)
Németh, E. (2017). Pénzügyi kultúrát fejlesztő képzések: felmérés és diagnosis. [courses Developing Financial culture: survey and Diagnosis]. Új Pedagógiai Szemle (New Pedagogical Review), pp.
Németh, E., Vargha, B. T., Domokos, K. (2020).
Financial Literacy. Who, whom and what are they Training for? comparative Analysis 2016–2020.
Public Finance Quarterly, 65(4), pp. 554–582, https://doi.org/10.35551/PFQ_2020_4_7
Németh, E., Zsótér, B., Luksander, A. (2017).
A 18–35 évesek pénzügyi kultúrája – a pénzügyi sérülékenység háttértényezői. [Financial culture of the 18–35 Year-old Age Group – Background Factors of Financial Vulnerability]. Esély (Opportunity), (3), pp. 3–33
otto, N. (2020). Employee finances fall due to COVID19. [online] Available at: https://
hrexecutive.com/1-in-4-workers-finances-have- deteriorated-due-to-covid/ Human Resource Executive. (Download date: 20 April 2021)
Pangestu, s., Karnadi, E. B. (2020). The Effects of Financial Literacy and Materialism on the savings Decision of Generation Z Indonesians. Cogent Business & Management, 7(1),
https://doi.org/10.1080/23311975.2020.1743618 Patel, P. c., Wolfe, M. T. (2019). Money Might not Make You Happy, but can Happiness Make You Money? The Value of Leveraging subjective Well- Being to Enhance Financial Well-Being in self- Employment. Journal of Business Venturing Insights, 12,
https://doi.org/10.1016/j.jbvi.2019.e00134 Porter, N. M., Garman, E. T. (1993). Testing a conceptual Model of Financial Well-Being. Financial Counseling and Planning, 4, pp. 135–164, Available at: https://www.afcpe.org/news-and-publications/
journal-of-financial-counseling-and-planning/
volume-4/%EF%BB%BFtesting-a-conceptual- model-of-financial-well-being/ (Download date: 20 June 2021)
sabri, M. F., Falahati, L. F. (2013). Predictors of
Examining the Mediate Effect of Financial stress.
Journal of Emerging Economies and Islamic Research, 1(3), pp. 61–76,
https://doi.org/10.24191/jeeir.v1i3.9130
Zyphur, M. J., Li, W.-D., Zhang, Z., Arvey, R.
D., Barsky, A. P. (2015). Income, Personality, and subjective Financial Well-Being: The Role of Gender in their Genetic and Environmental Relationships.
Frontiers in Psychology, 6,
https://doi.org/10.3389/fpsyg.2015.01493
cFPB (2017). cFPB Financial Well-Being scale.
consumer Financial Protection Bureau. Available at: http://www.sjdm.org/dmidi/files/cFPB_Finan cial_Well-Being_scale_Technical_Report.pdf (Download date: 25 April 2021)
Eurostat (2019). Quality of life in 2018 – How satisfied are People with their Lives? [report no. 172/2019.]
Eurostat Newsrelease. Available at: https://ec.europa.
eu/eurostat/documents/2995521/10207020/3- 07112019-AP-EN.pdf/f4523b83-f16b-251c-2c44- 60bd5c0de76d (Download date: 19 June 2021)