Vol. 47(1) pp. 17–23 (2019) hjic.mk.uni-pannon.hu DOI: 10.33927/hjic-2019-04
SIMULATION OF COLOR AFTERIMAGES:
AN APPROACH TO COMPUTING VIRTUAL COLOR PERCEPTION
LORINC˝ GARAI*1ANDANDRÁSHORVÁTH2
1Doctoral School of Multidisciplinary Engineering Sciences (MMTDI), Széchenyi István University, Egyetem tér 1, Gy ˝or, 9026, HUNGARY
2Department of Physics and Chemistry, Széchenyi István University, Egyetem tér 1., Gy ˝or, 9026, HUNGARY
Afterimages are a common and frequent perceptual phenomenon of everyday life. When looking into a high-intensity light source and suddenly turning away from it, a temporary “ghost” of the light source remains visible, for a while.
The computer-graphics simulation of afterimages is based on biophysical and mathematical models as published in the literature. A subordinate of afterimages defined in our research isvirtual color perception,that is in our interpretation an unusual and intense temporary color perception provoked by a rapid change in the color of the incident light. In research, the modelling of virtual color perception is a field that is by and large untouched. Our publication presents a kinetic model established to characterize the intensity and duration of virtual color perception as a function of rapid changes in the color of the incident light.
Keywords: afterimage, rod and cone photoreceptors, photopigment, kinetics
1. INTRODUCTION
In our vision, an afterimage is an illusionary image that appears after having been exposed to a prior one. Color afterimages are experienced in everyday life, for exam- ple, when driving at night the headlights of oncoming cars are so bright that when the driver looks away from them, the illusion of bright headlights still remains in perception [1]. When photorealistic images are rendered [1–4], some papers reported simulations of color afterim- ages by combining mathematical models [5–9].
A subordinate of afterimages defined in our research isvirtual color perception, a phenomenon that originates from chromatic adaptation in photoreceptors influenced by environmental color interactions, and based on the sensitivity to light and adaptibility of each cone receptor.
The physiological background of virtual color per- ception in brief is as follows: human photopic (daylight) color vision is a combined response of type L (long wave- lengths), M (medium wavelengths) and S (short wave- lengths) cone receptors to adequate stimuli of light. The photopigmentrhodopsinplays a key role in the process;
the equilibrium of its relative concentration is achieved by the opposing processes of rapid cleavage when ex- posed to light and slow resynthesis in darkness [10,11].
Adaptations of cone receptors to changes in the color of the incident light is time-consuming [12,13], hence, a
*Correspondence:garailorinc@garailorinc.hu
rapid change in the color of the incident light facilitates unusual and intense temporary color perception, the so- calledvirtual color perception. For example, when ex- posed to red light the sensitivity of L cone receptors is low and in this case is accompanied by the high sensitiv- ity of M and S cone receptors. Following a rapid change in color from red to blue in the incident light, the sensi- tivity of S cone receptors remains temporarily high, re- sulting in perception of the color bright blue that trans- forms into common blue after a short period of time dur- ing which the relative concentration of photopigment is equilibrated (restored), i.e. this is the duration ofvirtual color perception.
The purpose of our work is to develop a computa- tional kinetic model capable of simulating and quantify- ing virtual color perception.
In our research chromaticity diagrams are used. Note that changes in the xycoordinates [14] are not propor- tional to human color perception. To overcome this dis- tortion, several chromaticity coordinates were defined, for example, CIEu0v0[15].
The gamut of a device is the complete subset of colors it can produce. Usually, in an RGB (red, green, blue) de- vice, it consists of a color triangle with two-dimensional chromaticity coordinates. A gamut is characteristic of the given display (screen) currently in use, for example, modern RGB LED displays are characterized by wider gamuts compared to old-fashioned cold cathode fluores-
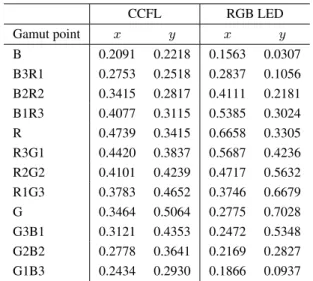
Table 1:Gamut points
CCFL RGB LED
Gamut point x y x y
B 0.2091 0.2218 0.1563 0.0307
B3R1 0.2753 0.2518 0.2837 0.1056 B2R2 0.3415 0.2817 0.4111 0.2181 B1R3 0.4077 0.3115 0.5385 0.3024
R 0.4739 0.3415 0.6658 0.3305
R3G1 0.4420 0.3837 0.5687 0.4236 R2G2 0.4101 0.4239 0.4717 0.5632 R1G3 0.3783 0.4652 0.3746 0.6679
G 0.3464 0.5064 0.2775 0.7028
G3B1 0.3121 0.4353 0.2472 0.5348 G2B2 0.2778 0.3641 0.2169 0.2827 G1B3 0.2434 0.2930 0.1866 0.0937
cent lamp (CCFL) displays that were frequently used about10years ago.
In our work, gamuts characteristic of CCFL and RGB LED desktop monitors were measured first. Following this, the simulation of virtual color perception obtained by gamut data as a result of a rapid change in the color of the incident light was conducted. Finally, preliminary val- idation tests were run on the aforementioned RGB LED desktop monitor in use [16].
2. Experimental
2.1 Measurement of the gamuts of the dis- plays used in our experiments and key pa- rameters of our model
The spectral power distribution of the red, green and blue primaries of two displays was measured by a spectrora- diometer (a Flame Miniature Spectrometer by Ocean Op- tics, Inc. calibrated 12 strong lines of He, Ne, Ar and H2
flashtubes). One of the displays used was that of an old notebook using a CCFL as a backlight and the other was a more modern one (HP ZR2440w) with a display using RGB LEDs as a backlight. Based on the spectral power distributions measured, the CIE 1931(x, y)chromaticity coordinates were calculated for all three primaries of both displays, using a Color Matching Function (CMF) of10°
at a resolution of1nm between the wavelengths of 360 nm and830 nm. Intermediate gamut point coordinates were calculated by interpolation. Gamut point numbers inTable 1andFig. 1were further referred to as colors of incident light. In our kinetic model, actual color percep- tion is compiled from the generally known mathematical relations [8,9,17] shown below.
The actual color perceptionJ of a single (L, M or S) cone receptor can be calculated by the formula
J =DEp, (1)
where D denotes a conversion constant between the cleavage of rhodopsin and neural impulses and here is
Figure 1:Chromaticity diagram of gamut points: an old CCFL display of a notebook (inner gamut) and an HP ZR2440w display (outer gamut)
equal to1. The variableErepresents the intensity of in- cident light expressed in trolands (Td). During the cal- culations a maximum luminance of the monitor of 300 cd/m2was used and a diameter of the pupil of5mm as- sumed. Therefore, the maximum retinal illuminance was equal to5890Td. The variablepdenotes the relative con- centration of photopigment (between0and1).
The time differential ofpdetermined from the rate of photopigment synthesis (Qs), spontaneous photopigment cleavage (Qc) and photoinduced cleavage (Qi) is calcu- lated by
dp
dt =Qs−Qc−Qi. (2) The variables ofEq. 2are calculated by
Qs= 1
τ, (3)
Qc =p
τ, (4)
and
Qi= E E0
p
τ, (5)
where the time constant τ = 99 1/s andE0 = 20,000 are used [13]. The following differential equation is com- posed fromEqs. 2–5:
dp dt = 1
τ−p τ− E
E0 p
τ. (6)
The solution ofEq. 6yields the actual relative concentra- tion of photopigment:
p(t) =1
b[1−(1−p0b)]e−tb/τ, (7) wherep0denotes the initial relative concentration of pho- topigment.
Finally, the equilibrium with regard to the relative concentration of photopigmentpeand percentage of pho- topigment cleavedbare related as follows:
pe= 1
b = E0
E+E0
. (8)
2.2 Simulation formula
In accordance with CIE 1931 [18,19], the actual coordi- nates of color perceptionx(t), y(t)andz(t) are calcu- lated from the color coordinates of incident lightxi,yi andzi by equationsEqs. 9–24. In the equations below, variables indexed with L, M and S apply to cone recep- tors L, M and S, respectively.
EL=Emultip·M1,1-3×[xi, yi, zi] (9) EM=Emultip·M2,1-3×[xi, yi, zi] (10) ES=Emultip·M3,1-3×[xi, yi, zi] (11)
bL =bM=bS= 1 + Emultip E0
(12) Emultip, which is equal to6,000, denotes the light inten- sity of the display. The actual relative concentration of photopigment is calculated from the initial relative con- centrations of photopigmentp0L,p0Mandp0S:
pL(t) = 1 bL
(1−(1−p0Lb))e−tb/τ (13)
pM(t) = 1 bM
(1−(1−p0Mb))e−tb/τ (14) pS(t) = 1
bS(1−(1−p0Sb))e−tb/τ (15) For the purposes of iteration in simulations, the initial rel- ative concentration of photopigmentp0was equal to0.1.
From the actual relative concentrations of photopigment Eqs. 13–15, the color perception coordinates are as fol- lows
JL(t) =D·pL·EL, (16) JM(t) =D·pM·EM, (17) JS(t) =D·pS·ES, (18) whereJL,JMandJSdenote the cone receptors of long, medium and short wavelengths, respectively.
To obtain more accurate color perception coordinates, tristimulus values were calculated:
X(t) =M1,1-3−1 ×[JL, JM, JS], (19) Y(t) =M2,1-3−1 ×[JL, JM, JS], (20) Z(t) =M3,1-3−1 ×[JL, JM, JS], (21)
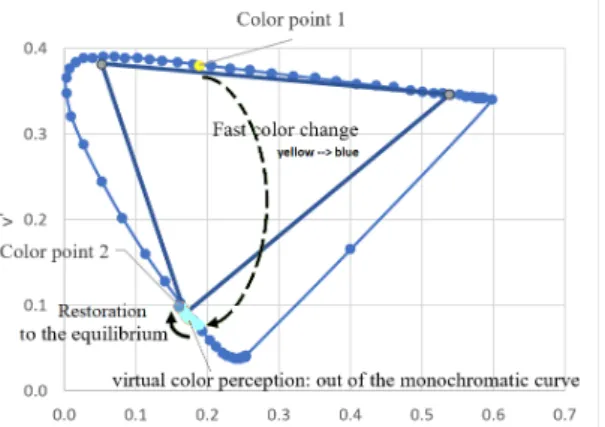
Figure 2: An example of fast color change leading to virtual color perception. Color point yellow shows pri- mary color perception. Color points bright blue show vir- tual color perception as reflected by the tendency to reach equilibrium in photopigment relative concentration.
whereM denotes a transformation matrix between tris- timulus valuesX,Y andZ, and the actual color percep- tionJ. The actual color perception coordinatesx(t),y(t), z(t)are calculated by the following equations:
x(t) = X(t)
X(t) +Y(t) +Z(t), (22) y(t) = Y(t)
X(t) +Y(t) +Z(t), (23) z(t) = 1−x(t)−y(t). (24) In accordance with the CIELUV (1976) chromaticity di- agram, the actual color perception coordinatesx(t),y(t) andz(t)are transformed into coordinatesu0(t)andv0(t) by an easy-to-compute method [19] :
u0(t) = 4x(t)
12y(t)−2x(t) + 3, (25) v0(t) = 6y(t)
12y(t)−2x(t) + 3. (26) Theintensityof the actual virtual color perception is de- termined by
∆c= q
(u0(t)−u0e)2+ (v0(t)−ve0)2, (27) whereu0e andv0edenote color coordinates at equilibrium following restoration from virtual color perception (see Restoration to the equilibriuminFig. 2).
A summary of variables and parameters is shown in Notationsat the end of this paper.
2.3 Simulation
To understand the calculations, a graphical approach is shown inFig. 2. Gamut color point 1 stands for the pri- mary perception of the actual incident light, which is yel- low here. With a rapid change in color from yellow to
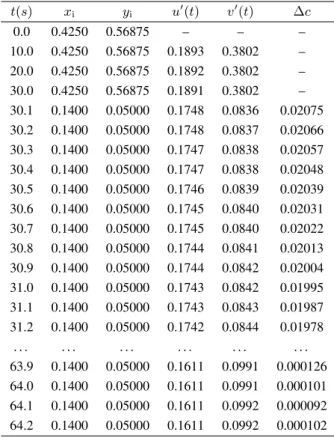
Table 2:Example of iteration
t(s) xi yi u0(t) v0(t) ∆c
0.0 0.4250 0.56875 – – –
10.0 0.4250 0.56875 0.1893 0.3802 – 20.0 0.4250 0.56875 0.1892 0.3802 – 30.0 0.4250 0.56875 0.1891 0.3802 – 30.1 0.1400 0.05000 0.1748 0.0836 0.02075 30.2 0.1400 0.05000 0.1748 0.0837 0.02066 30.3 0.1400 0.05000 0.1747 0.0838 0.02057 30.4 0.1400 0.05000 0.1747 0.0838 0.02048 30.5 0.1400 0.05000 0.1746 0.0839 0.02039 30.6 0.1400 0.05000 0.1745 0.0840 0.02031 30.7 0.1400 0.05000 0.1745 0.0840 0.02022 30.8 0.1400 0.05000 0.1744 0.0841 0.02013 30.9 0.1400 0.05000 0.1744 0.0842 0.02004 31.0 0.1400 0.05000 0.1743 0.0842 0.01995 31.1 0.1400 0.05000 0.1743 0.0843 0.01987 31.2 0.1400 0.05000 0.1742 0.0844 0.01978
. . . . 63.9 0.1400 0.05000 0.1611 0.0991 0.000126 64.0 0.1400 0.05000 0.1611 0.0991 0.000101 64.1 0.1400 0.05000 0.1611 0.0992 0.000092 64.2 0.1400 0.05000 0.1611 0.0992 0.000102
blue, a bright blue color appears in perception that trans- forms into common blue after a short period of time nec- essary for the restoration of the equilibrium in terms of the relative concentration of photopigment, which is the time period required for virtual color perception, namely for the perception of bright blue (Fig. 2).
Our kinetic simulation model (Section 2.2) is illus- trated in Table 2. The first five lines in the first four columns show the same values of the color coordinates of incident lightxi, yi, zi, against time (0−30seconds).
Figure 3:Photopigment relative concentration values in the iteration inTable 2
Over this30second-long period, theu0(t)andv0(t)val- ues of color perception are quasi identical. However, af- ter 30 seconds, a rapid change in color of the incident light from red to blue results in virtual color perception, as demonstrated by line 6 and column 5. The values of∆c in column 7 concern the intensity of virtual color percep- tion.(∆c)maxdenotes the peak intensity in virtual color perception and the minimum∆c stands for the duration of virtual color perception (tvirtcol). Actual relative con- centrations of photopigment of cone receptors L, M and S are shown in the diagram inFig. 3.
In terms of simulating virtual color perception, rapid changes in the color of incident light were indicated on CCFL and RGB LED monitors by the assignment of de- fined gamut points to each other (Fig. 1). Altogether,24 changes in color were simulated.
2.4 Validation of the simulation
Our kinetic model was validated by a test that consisted of20subjects involving an in-house piece of software run in a Python environment. Accordingly, a homogeneous solid colored circle is displayed on a homogeneous back- ground of a different color for30seconds (Fig. 4), then the circle disappears (Fig. 5) and the intensity and dura- tion of virtual color perception is determined by the key inputs of the user. Further details concerning the test are found below:
• First, the test subject looked at a white screen for30 seconds.
Figure 4:Second screen of validation test.
Figure 5:Third screen of validation test: circle removed.
Table 3:Comparison of virtual color perception intensity in model situations and in validation test results
Ranking in model Ranking category
Ranking in validation test results
ID Rank ID
Median of ranking
Corre- lation
R→G 1
High
B→G 1.00 No
G2B2→R 2 B2R2→G 2.00 Yes
G1B3→R 3 R→G 3.00 Yes
B2R2→G 4 B→R2G2 4.00 No
R→G2B2 5 Medium R→G2B2 4.00 Yes
R2G2→B 6
Low
G1B3→R 4.50 No
G→B2R2 7 G2B2→R 5.00 No
B→G 8 G→B2R2 5.00 Yes
B→R2G2 9 R2G2→B 7.00 Yes
Matching percentage between model and validation test results:56%
Table 4:Comparison of virtual color perception time pe- riod in model situations and in validation test results
Ranking in model Rankingcategory validation test resultsRanking in
ID Rank ID
Median of ranking
Corre- lation
R→G2B2 1
High
B→G 1.00 No
R→G 2 G1B3→R 2.00 No
G→B2R2 3 B→R2G2 3.00 No
B2R2→G 4 R→G2B2 4.00 Yes
R2G2→B 5 Medium G2B2→R 4.00 No
G2B2→R 6
Low
G→B2R2 4.50 No
B→R2G2 7 B2R2→G 5.00 No
G1B3→R 8 R→G 5.00 No
B→G 9 R2G2→B 7.00 No
Matching percentage between model and validation test results:11%
• Second, the eyes of the subject were fixed on a circle at the center of the subsequent colored image (Fig.
4) for30seconds. According to our definition, the color of the central circle represents the first gamut point, while the color of the background represents the second gamut point. Altogether, 9 assignments of gamut points have been validated so far.
• Third, the central circle suddenly disappeared (Fig.
5) and the subject responded according to the inten- sity and duration of virtual color perception experi- enced.
• The intensity of virtual color perception was rated on a four-grade scale, where zero stands for the ab- sence of virtual color perception and 4 denotes its highest intensity. The duration of virtual color per- ception was indicated by the subject pressing a key as the perception faded away.
First, the assignments of gamut points for each test subject were ranked according to the intensity (Table 3) and duration (Table 4) of virtual color perception in- duced. Then, the median of the rank order with regard to the intensity and duration of virtual color perception was calculated.
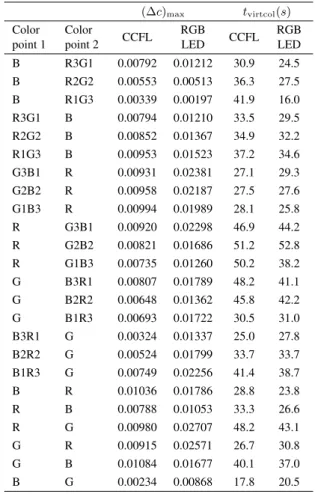
Table 5:Intensity and time period of virtual color percep- tion related to gamut points assignments
(∆c)max tvirtcol(s) Color
point 1 Color
point 2 CCFL RGB
LED CCFL RGB
LED B R3G1 0.00792 0.01212 30.9 24.5 B R2G2 0.00553 0.00513 36.3 27.5 B R1G3 0.00339 0.00197 41.9 16.0 R3G1 B 0.00794 0.01210 33.5 29.5 R2G2 B 0.00852 0.01367 34.9 32.2 R1G3 B 0.00953 0.01523 37.2 34.6 G3B1 R 0.00931 0.02381 27.1 29.3 G2B2 R 0.00958 0.02187 27.5 27.6 G1B3 R 0.00994 0.01989 28.1 25.8 R G3B1 0.00920 0.02298 46.9 44.2 R G2B2 0.00821 0.01686 51.2 52.8 R G1B3 0.00735 0.01260 50.2 38.2 G B3R1 0.00807 0.01789 48.2 41.1 G B2R2 0.00648 0.01362 45.8 42.2 G B1R3 0.00693 0.01722 30.5 31.0 B3R1 G 0.00324 0.01337 25.0 27.8 B2R2 G 0.00524 0.01799 33.7 33.7 B1R3 G 0.00749 0.02256 41.4 38.7
B R 0.01036 0.01786 28.8 23.8
R B 0.00788 0.01053 33.3 26.6
R G 0.00980 0.02707 48.2 43.1
G R 0.00915 0.02571 26.7 30.8
G B 0.01084 0.01677 40.1 37.0
B G 0.00234 0.00868 17.8 20.5
Since the number of test subjects was limited, the re- sults could not be divided according to their age and gen- der. Further tests are needed to ensue virtual color per- ception with regard to gender and age.
3. Results and Discussion
In Table 5, the maximum (∆c)max for the CCFL and RGB LED displays were identified during the rapid change in the color of incident light from gamut point G to B (from green to blue) and R to G (from red to green), respectively.
When compared to the CCFL display, the RGB LED display appears to yield higher(∆c)max values with the exception of rapid changes in the color of the incident light from gamut point B to R2G2 (from blue to orange).
With regard to our results, the duration of virtual color perception seems to be platform-free, i.e. tvirtcol dis- played on both the CCFL and RGB LED monitors was identical. However, rapid changes in the color of the in- cident light from gamut point B to R1G3 (from blue to yellowish green) was an exception with regard to the val- ues oftvirtcol. As is shown inTable 5,tvirtcolcomputed on the CCFL display has doubled in value compared to that computed on the RGB LED display.
The kinetic simulation results so far point to the like- lihood of the appearance of virtual color perception on all
display platforms.
As for our preliminary tests performed on20test sub- jects so far as well as the parameters(∆c)maxandtvirtcol, a correlation between model situations (simulations) and the results of a validation test cannot be confirmed at present. Further tests, statistical evaluations and the in- troduction of additional parameters are also necessary to achieve more accurate conclusions.
4. Conclusion
Photopic human color vision is a combined response to the stimulation from light of red, green and blue cone re- ceptors. Cone receptors adapt individually to the actual color of the incident light. Since the adaptation of cone receptors is time-consuming, virtual color perception can be achieved in the meantime by rapid changes in the color of the incident light.
Our kinetic model developed for individual cone re- ceptors is based on mathematical correlations that simu- late the intensity and duration of virtual color perception which result from rapid changes in color. According to our model, virtual color perception can result from both CCFL and RGB displays.
Our preliminary validations are yet to confirm a cor- relation between model situations (simulations) and the results of a validation test. Some refinements to the simu- lation by the introduction of additional parameters as well as further validation tests with regard to the gender and age of participants are indispensable to reach more accu- rate conclusions.
Acknowledgement
This research would not have been possible without the participation of volunteers from Széchenyi István Univer- sity as test subjects.
Notations
Symbol Meaning Unit
J
in actual color perception:
JL= red cone receptors specific for long wavelength
JM= green cone receptors specific for medium wavelength JS= blue cone receptors specific for short wavelength
dimensionless
p relative photopigment concentration
dimensionless (range:0. . .1)
D
conversion constant between rhodopsin cleavage and neural impulses
dimensionless (value: 1) E incident light intensity troland Qs Synthesis of photopigment dimensionless Qc Spontaneous cleavage of
photopigment dimensionless
Qi Light induced cleavage of
photopigment dimensionless
τ time constant in rhodopsin
synthesis seconds
Symbol Meaning Unit
p0 photopigment initial relative
concentration dimensionless
p(t) photopigment relative
concentration at t time afterp0 dimensionless b percentage of photopigment
cleaved dimensionless
M
transformation matrix of tristimulus valuesXYZand the actual color perceptionJ
dimensionless
REFERENCES
[1] Mikamo, M.; Slomp, M.; Raytchev, B.; Tamaki, T.;
Kaneda, K.: Perceptually inspired afterimage synthe- sis,Computers & Graphics, 201337(4), 247–255DOI:
10.1016/j.cag.2013.02.008
[2] Gutierrez, D.; Anson, O.; Munoz, A.; Seron, F.
J.: Perception-based rendering: eyes wide bleached in Dingliana, J.; Ganovelli, F. (eds): Eurographics 2005 - Short Presentations (The Eurographics Asso- ciation, Geneve, Switzerland) 2005 pp. 49–52 DOI:
10.2312/egs.20051021
[3] Ritschel, T.; Eisemann, E.: A computational model of af- terimages,Comput. Graph. Forum,201231(2pt3), 529–
534DOI: 10.1111/j.1467-8659.2012.03053.x
[4] Horváth, A; Dömötör, G.: Computational simulation of mesopic vision based on camera recordings,Light and En- gineering,201422(1), 61–67
[5] Reidenbach, H.-D.: Determination of the time depen- dence of colored afterimages in Stuck, B. E.; Belkin, M.; Manns, F.; Söderberg, P. G.; Ho, A. (eds): Proceed- ings Ophthalmic Technologies XVIII 6844, 2008 DOI:
10.1117/12.762852
[6] Padgham, C. A.: Quantitative study of visual after- images, Brit. J. Ophthal., 1953 37, 165–170 DOI:
10.1136/bjo.37.3.165
[7] Padgham, C. A.: Measurements of the colour sequences in positive visual after-images,Vision Res.,19688(7), 939–
949DOI: 10.1016/0042-6989(68)90142-9
[8] Alpern, M.: Rhodopsin kinetics in the human eye, J. Physiol., 1971 217(2), 447–471 DOI: 10.1113/jphys- iol.1971.sp009580
[9] Smith, C. V.; Pokorny, J.; Van Norren D.: Densitomet- ric measurement of human cone photopigment kinet- ics,Vision Res.,198323(5), 517–524DOI: 10.1016/0042- 6989(83)90126-8
[10] Linksz, A.: An essay on color vision and clinical color- vision tests,Am. J. Ophthalmol., 1964 58(3), 513 DOI:
10.1016/0002-9394(64)91250-4
[11] Hurvich, L. M.: Color Vision, (Sinauer Associates Inc., Sunderland, USA), 1981ISBN: 978-0878933365
[12] Ábrahám, Gy.; Kovács, G.; Antal, Á.; Németh, Z.;
Veres, Á. L.: Járm˝u optika (in Hungarian), 2014
http://www.mogi.bme.hu/TAMOP/jamu_optika/ch02.
html#ch-II.3.3.2.2(downloaded on: 02/10/2018)
[13] Szentágothai J.: Functionalis anatomia, (in Hungarian) (Medicina Kiadó, Budapest, Hungary), 1977, vol. 3, pp.
1590–1597
[14] Colorimetry,3rdEdition, CIE 15:2018ISBN: 978 3 901906 33 6
[15] http://www.color-theory-phenomena.nl/10.03.htm (downloaded on: 02/10/2018)
[16] Csuti P.: The characterization of the photometry and colorimetry of light emitting diodes, PhD dis- sertation (in Hungarian) DOI: 10.18136/PE.2016.642 (http://konyvtar.uni-pannon.hu/doktori/2016/
Csuti_Peter_dissertation.pdf)
[17] Horváth A.: A fényterjedés és -észlelés fizikája mérnököknek (in Hungarian), (SZE-MTK, Fizika és Kémia Tanszék, Gy˝or) 2013, pp. 165-178, ISBN:
978-963-7175-97-8
[18] Smith T.; Guild J.: The C.I.E. colorimetric standards and their use, Trans. Opt. Soc., 1932 33(3), 73–134 DOI:
10.1088/1475-4878/33/3/301
[19] Schanda J.: Colorimetry: understanding the CIE system (John Wiley & Sons, Inc., New Jersey, USA), 2007DOI:
10.1002/9780470175637