Cooperation and exClusion: an
explorative analysis of Collaborative networks of Hungarian disability
organizations
Roland Keszi–Judit Pál–GeRGõ PaPP1
AbstrAct In this paper we present the results of analysis into the collaboration network of disability organizations in Hungary using survey and social network research methods. The aim was to compare Hungarian and international cases regarding cooperation between disability organizations. Consequently, we tried to find answers to the following questions: (1) what types of organizations are disability organizations in contact with? (2) what influences selection of partner organizations? (3) in what areas? (4) how often? and, (5) under what form do these organizations cooperate with each other? Results showed that all forms of cooperation are considered advantageous. By analyzing specific name-generated cooperation networks we also found that the larger, national organizations have a dominant role in applications and project implementation arrangements.
Keywords people with disability, disability organizations, cooperation, social network analysis, disability studies
1 Roland Keszi, Ph.D, is an assistant professor at Eötvös Loránd University, Research Group for Vocational Rehabilitation, Bárczy Gusztáv Faculty of Special Education, e-mail: roland.
keszi@barczi.elte.hu
Judit Pál is a Ph.D candidate and junior research fellow at The MTA TK “Lendület” Research Center for Educational and Network Studies / Corvinus University of Budapest, Doctoral School of Sociology, e-mail: pal.judit@tk.mta.hu
Gergõ Papp is a Ph.D student at Corvinus University of Budapest, Doctoral School of Sociology, e-mail: gergo.papp@uni-corvnus.hu
144 ROLAND KESZI–JUDIT PÁL–GERGŐ PAPP
introduCtion, researCH questions
It is estimated that there are 561,000 persons living with a disability in Hungary, representing 5.6 per cent of the population.2 According to demographic forecasts, the number of persons with special needs will increase over the next decade to reach 8% by 2021 (Hablicsek and Richter 2004: 53). The resulting burdens cannot be handled solely using state means;
the civil sphere, including the types of organizations examined in this study, will play an increasingly prominent role in Hungary in improving the quality of life of persons with special needs and their family members. It is therefore very important to understand the characteristics of the collaboration that takes place between the organizations that support people with special needs.
Taking all this into consideration, the three key questions in our research were the following:
1. What patterns of collaboration characterize Hungarian disability organizations?
2. How can communication between Hungarian disability organizations be described?
3. What means do the organizations have to contact each other, to mobilize and to carry out combined activities?
What gives the topic relevance on the one hand is that there has been no research of this type in Hungary. Even in the international literature there are very few examples of analyses that have explored collaboration among disability organizations. The only example we found of relevance to our topic was a study by Johnston and colleagues who mapped the collaboration of Scottish disability organizations (Johnston et al. 2009); we refer to their findings in the presentation of our results. On the other hand, network research, both from a methodological point of view as a way of approaching social phenomena and the actors involved – in our case disability organizations – has become increasingly popular and important in the past decade in both international and Hungarian sociology (see, for example, Bartal et al. 2005;
Bartal 2006; Bartal – Molnár 2006).
2 The number of persons with special needs can only be determined through estimation and one of the bases we used for this was Census data. At the time the data survey of our research was concluded, the final data of the 14th census could be regarded as the basis and point of departure for these estimates. Since then, processing of the data from the 15th (2011) census was nearly finished; the results are being published in several waves up to December 2013 following a publication plan. On the basis of the figures of the 2011 census there are 561,247 persons with special needs in Hungary, which as a percentage of the total population is not substantially different to the 2001 figures.
MetHodology
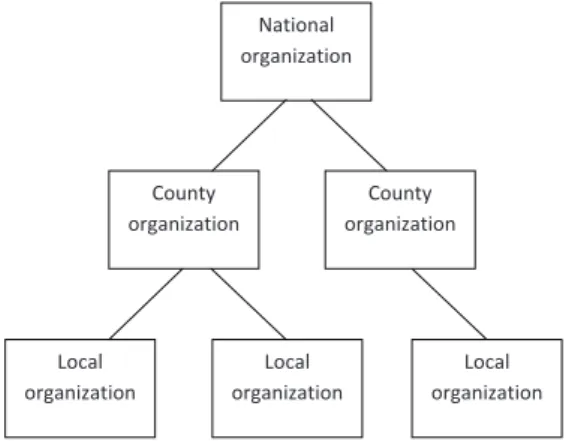
All the organizations that support people with special needs that operate in Hungary belong to the population we studied.3 The fact that there were many organizational changes in pre-existing, earlier databases (termination of organizations, mergers, etc.) up to the time the research was carried out caused problems when sampling. Because of this fact, and because of the lack of a full list of Hungarian disability organizations, in our study we used a survey method and network analysis on a sample comprised of 500 elements obtained through a non-probability sampling procedure (namely, expert sampling) to examine collaborative connections with other organizations of primarily civil organizations that support people with special needs.4 Online data collection – before which we conducted interviews with the heads of national and local disability organizations – was carried out in February and March 2011. We succeeded in obtaining 218 completed questionnaires (representing a high response rate of 43%). We came up against a number of difficulties in identifying the organizations. There are organizations that are member institutions of a national umbrella organization; in certain cases they themselves also have sub-organizations. These organizations are mainly grouped around national associations for the major branches of disability; they also have regional and/or county member organizations, and in some cases even local settlement (in Budapest, district-level) groups. Such institutions may function as part of national organizations but at the same time also operate under their own names and with decision-making rights (for example, in the form of autonomous associations). Figure 1 shows the general structure of the national umbrella organizations and more concretely of the National Federation of Disabled Persons’ Associations (MEOSZ) 5.
3 An important indicative figure in connection with the research population is that, according to (incomplete) data received from the Central Statistical Office, more than 1200 organizations among the nonprofit organizations in Hungary participate in providing social services and support for people with special needs, and around 700 of these organizations received non- normative support from the central budget in the years 2007–2009 (ÁSZ 2010: 10).
4 Obviously there is methodological difficulty involved with simply selecting among the so- called disability organizations. On the one hand most deeds of foundation list a variety of types of activity, while on the other hand it is quite possible that organizations that do not list various kinds of disability activities in their deeds of foundation do, in fact, also carry out activities of this nature.
5 In Hungarian: Mozgáskorlátozottak Egyesületeinek Országos Szövetsége (abbreviated to MEOSZ)
146 ROLAND KESZI–JUDIT PÁL–GERGŐ PAPP
Figure 1. The general structure of national umbrella organizations (and specifically of the National Federation of Disabled Persons’ Associations)
Mapping the network of disability organizations is also complicated by the fact that some organizations also function as social service institutions with their own foundations, in many cases also with state assistance. As a result, our database could have included (for example) both a residential home and its foundation. After cleaning the data our database comprised a total of 606 organizations, of which – as we have already mentioned – 218 nominated themselves (‘senders’).6 Among the nominated organizations (‘receivers’), 354 organizations could be clearly identified, while in the case of 17 organizations it was not possible to decide unequivocally which organization the nominator had in mind. In another 17 cases the organization could not be identified at all. Thus on the whole we were able to work with a relatively low non-response rate.
6 By ‘nominating’ organization we mean the organizations that filled out the questionnaire, while
‘nominated’ organizations are those named in responses. The name generation method results in asymmetric networks, which means that we can portray networks from only one direction, that of the nominator. This also means that we do not obtain complete networks but rather collaborative networks based on ego-networks.
Figure 1. The general structure of national umbrella organizations (and specifically of the National Federation of Disabled Persons’ Associations)
National organization
County organization
County organization
Local organization
Local organization
Local organization
results
descriptive results of the survey data Collection
Basic characteristics of the organizations, extent of their activity and level of familiarity
The disability organizations in the sample have been operating for an average of 16.2 years; in other words they are mature organizations which is of great significance for networking as it takes time to develop collaborative networks.
The overwhelming majority of the organizations examined operate as foundations or associations (84%). The legal classification of the remaining institutions shows that they operate in the typical operational forms of the civil sphere that are defined in the relevant laws, while an examination of the founding agents of the disability organizations reveals the strong predominance of civil initiatives (85% arose through the efforts of private individuals), while state, local government and market actors represent only a small proportion.
Territorial operation and places where the organizations are active are characterized in our sample by regional articulation. It is obvious that some of the organizations – especially the large ones – are capable of operating simultaneously at various places throughout the country, but the central location of operations (the region where most of the organization’s activities take place) is important. The operations of the organizations examined shows a fairly high level of heterogeneous regional articulation; the disability organizations are operating across the whole country and more or less follow the geographical distribution of persons with special needs within the population.
The extent to which the organizations are recognized – based on data that reflects the judgment of the respondents – is significant and largely national.
40% of the organizations indicated that they are known nationally, while a further 6%, according to their own assessments, are also known internationally.
The level of identification with a single institution or settlement can be said to be relatively low, a positive feature of the network potential of the organizations.
Examination of the operation of the organizations by settlement type reveals – not surprisingly – their concentration in large towns, while smaller settlements are practically not covered at all. These predominantly civil organizations typically have an urban form, and, as a result, persons with special needs that live in small settlements are unable to enjoy the benefits
148 ROLAND KESZI–JUDIT PÁL–GERGŐ PAPP
that arise from the operation of such organizations; this obviously further compounds the already unfavorable situation of the subpopulation concerned (regarding transport, infrastructure, job opportunities, etc.). Only 7% of all the organizations state that their work is concentrated in villages and scattered farms.
The organizations in the sample cover all branches of disabilities. The smallest organizations have a narrow scope of operation: only a few clients belong to their target group. However, a considerable number of institutions provide services for many thousands and, in a few cases, hundreds of thousands of persons with special needs and their family members.7
The disability target groups served by the organizations examined are complex; in most cases organizations focus not on a single branch of disability but deal with several, unrelated groups of disabilities.8 One of the reasons for this complex approach to clientele is obviously the fact that persons with special needs typically have multiple loss of function and in the majority of cases more than one type of disability is present (unrelated, originally independent types of disabilities may account for the loss of function first medically diagnosed). In our investigation at the data level the relatively high frequency of mentions of persons with multiple disabilities (65 organizations) is also a reflection of this phenomenon, well known in disability studies. The high number of institutions that deal with clients with physical disabilities (77 organizations) and intellectual disabilities (71 organizations) could be predicted on the basis of the data available in Hungary for the population with special needs. However, many organizations also consider persons with multiple disabilities to belong to their clientele, along with a number of other branches of disability. This is perhaps the first point where – taking only the organizations’ clientele as a starting point – the outstanding importance of the organizations’ “network sensitivity” can be seen. Individual persons with special needs or their family members are in contact during the same period of time with various organizations, so there is a high chance that the organizations can learn of each other’s existence through the clients themselves.
The organizations’ scope of activity and the nature of the services provided
7 The organizations examined offer services to a combined total of over 1.7 million persons with special needs or their family members.
8 We grouped the organizations on the basis of their self-classifications; all the organizations were able to indicate more than one disability type. As a result, certain organizations were associated with several types of disability. The categories were the following: persons with physical disability, persons with hearing impairment, persons with sight impairment, persons with intellectual disability, autistic persons, persons with multiple disabilities, other target groups, no definable target group.
is also characterized by diversity. The greatest number (166 organizations) mentioned providing information and advice. Organizing leisure activities and events, and community organizing activity (158 organizations) were also frequently mentioned. Close to 60% (130 organizations) were involved in a fundamentally different type of activity: interest representation. Special mention must be made of a negative characteristic from the viewpoint of the population with special needs; namely, that only a small proportion of the disability organizations studied (around a quarter) typically provided labor market services for persons with special needs.
The total number of employees in the sample examined was 5876 persons, of whom 3341 were employed full or part-time. The average paid full-time labor force of the organizations was 12.18 persons, although most organizations did not use paid, full-time employees, and the greatest number of paid, full-time employees of a single organization was 260 persons. Less than half of all the disability organizations (43%) operate without a full-time employee and a further 11% have only one employee.
Full-time, paid employees represent only a part of the human resources available to the disability organizations examined. The organizations also use volunteers to carry out their tasks, with an average of 11.6 volunteers per organization. This average can be regarded as high and it seems probable that with this manpower management advantage the disability organizations are able to compensate in part for their lack of funds that arise from their financing disadvantages.
Sources of financing include applications for grants in the case of 83% of the organizations in the sample, support from the public in the form of the 1% of personal income tax that can be disposed of in this way (mentioned by 73% of the organizations as a source of revenue), membership dues (48%), and donations from the public over and above the 1% of personal income tax (46%). Government and local government support were mentioned by a slightly lower but not insignificant proportion of organizations among their sources of funds.
Collaboration among the disability organizations in general
In the course of the research we gathered information about the importance respondents attach to their collaboration with other organizations and in what way it is realized. Regarding how the importance of collaboration is judged, none of the respondents representing the organizations regarded the collaboration as being unimportant; 69.3% of respondents regarded it as very important and 19.3% held collaboration with other disability organizations to be important. Accordingly, there are only 11 organizations in the sample
150 ROLAND KESZI–JUDIT PÁL–GERGŐ PAPP
that do not collaborate with any other institutions. In explaining the lack of collaboration they mentioned, among other things, that their organization had been reorganized, ceased to exist, or there was no similar organization at a county level. In addition, the issue of fragmentation also arose: some respondents stated that there were too many organizations that would like to survive and to deliver services.
Examining the collaboration that exists, we find that the organizations that collaborated with other organizations are connected to an average of 12 others (minimum: 1 partner; maximum: 200 partners [standard deviation:
19.5 partners]). 63% of the organizations collaborate with fewer than 10 organizations, 26% with between 10 and 25, 7% with between 26 and 50, and 5% with more than 50 organizations.
On the basis of the connections mentioned, in providing services for persons with special needs the respondents are in contact mainly with other disability organizations, with other civil organizations, then with local governments, social and educational institutions, church organizations, and finally with political parties. In addition, 40% claimed that they also collaborate with international partners.
When examining collaborations between the different branches of disability we find that the greatest proportion of organizations collaborate with organizations that support the physically disabled, followed by the intellectually disabled, the sight impaired (16%), persons with multiple disabilities (15%), the hearing impaired (12%), autistic persons and other persons with special needs. An important finding is that there is close correlation between the target groups covered by the organizations and their partners’ target groups; organizations belonging to a given branch of disability were most likely to nominate each other. This observation is corroborated by the connection network analysis to be discussed later. At the same time – as already mentioned – the organizations individually also belong to more than one branch of disability and are in contact with organizations that operate across several branches of disability.
The aims of their collaboration with other organizations – as with the services provided by the individual organizations – are quite heterogeneous:
disability organizations most often cooperate to assert interests, exchange experience, provide community leisure programs, submit applications for grants and to seek advice.
The results show that the two most important considerations in the choice of partners are the disability branch to which the partner organization belongs (this is indicated in 38% of answers), and personal acquaintance (35% of mentions). Relations between organizations arise by choice rather than
spontaneously: 63% of collaborative efforts were characterized by conscious choice while in 37% of cases collaboration came about spontaneously.
Concerning the nature of the collaborative relations, close to 69% of collaborations were project-based, which meant that they came about for the purpose of organizing a joint event or writing/submitting applications for funding. Engaging in case-based collaboration – for example, collaboration initiated for the purpose of providing services for a particular person with special needs – characterized 31% of the organizations.
With the overwhelming majority of organizations it is the leader of the organization (president, general secretary, secretary) who maintains contact with the institution’s external partners. 23% of the organizations have a paid liaison officer, while in 15% of institutions this task is handled by a volunteer.
Judgment of collaborative relations between disability organizations In our survey we asked respondents to classify their relations with other organizations according to how collaborative or conflictual they were.9 According to the results, the relations of the responding organizations are most collaborative with other disability organizations and other civil organizations, and with educational institutions. The institutions questioned have the least collaborative relations with the various market organizations and with state bodies. But it is important to note that relations for all organizational types fall into the ‘collaborative’ domain, suggesting that the organizations basically judge their relations to be positive.
Examining the actual collaborations themselves we find that organizations that collaborate with other organizations build up connections with an average of 12 other organizations. The minimum value in the sample was 1, the maximum 200, with a very high standard deviation (19.5). To facilitate analysis, on the basis of the number of collaborating organizations we classified the organizations in the sample into 4 categories: 63% of the organizations collaborate with fewer than 10 organizations, 26% with between 10 and 25, 7% with between 26 and 50, and 5% with more than 50 organizations. The results show that the number of collaborative relations of the disability organizations operating in Hungary in the sample are relatively low, and the organizations show a very variable picture regarding the number of organizations with which they collaborate in supporting persons with special needs. The number of collaborating organizations is influenced by the size of the target group served by the organization, the extent to which
9 The relations had to be rated on an 11-point semantic differential scale, where -5 refers to a conflictual relationship, and 5 a collaborative relationship.
152 ROLAND KESZI–JUDIT PÁL–GERGŐ PAPP
the organization’s activity is known, and by the size of the funds available for the organization’s operations. The data reveal the unsurprising situation that the bigger the organization, the more widely its activity is known and the more collaborating partners it has. Regarding the type of organizations they collaborate with, the organizations in the sample collaborate with an average of 4.5 types out of a maximum of 10 types of organizations. On the basis of the mentions, the respondents principally maintain relations with other disability organizations and with other civil organizations in order to provide services for persons with special needs (followed by local governments, social and educational institutions, church organizations and finally, with political parties).
Our questionnaire included an open question asking respondents, all things considered, what they regarded as the greatest advantage of collaborative relations. In answer to this question 170 respondents gave their opinion (response rate: 82%), and a number of respondents mentioned 2-3 factors in their reply. The organizations most frequently mentioned exchange of information and experience as the biggest advantage of collaborative relations. Fewer mentions were made of attaining common goals and joint representation of interests, and of raising the standard and effectiveness of the service provided by the institution. Although Johnston and colleagues examined the advantages only of participation in formal networks and forums, a parallel can be drawn between their results and our findings as the Scottish disability organizations regarded participation in the flow of information, more effective assertion of interests and joint action, and mutual support as the greatest advantages of formal collaborative relations (Johnston et al. 1990: 21).
Besides the advantages of collaborative relations we also asked about possible disadvantages, and according to the results a parallel can be drawn between the most frequently-mentioned disadvantages and the advantages discussed above: many organizations complained of the difficulties of maintaining relations and the flow of information, and of differences in interests and goals.
We also examined if there were other important things that the organizations could mention about their collaborative relations that had not been raised in the questionnaire. The most mentions concerned the importance of further developing collaboration between organizations; that is, to increasing the intensity of pre-existing relations, and to expanding collaborative relations (to building up missing connections). Regarding how to develop collaboration, most respondents mentioned improving the flow of information – a number of organizations considered that this could be done with a shared online
information data base – as well as increasing funding, because, according to many organizations, a number of organizations are struggling to survive and so are unable to focus on cultivating collaborative relations. At the same time, a number of respondents mentioned that cooperation often impedes action and that the collaborative relations are often formal and empty. Correspondingly, the aim of the collaboration must be to help persons with special needs, not to maintain organizational and personal relations. The main problem regarding the missing connections is that the organizations that operate in the various disability branches do not collaborate, and in fact there is often rivalry among organizations that serve the same disability target group over obtaining funding, and this reduces the chances of collaboration. In many cases the obstacle to collaboration was often of a personal nature: a number of organizations mentioned ill will, egoism, dissension, and the absence of readiness to compromise, solidarity and sincerity.
Problems arising in the course of collaboration
Examining the conflicts experienced by organizations in their collaboration was an important part of the research. 51 of the institutions that cooperate with other organizations (representing 25% of the sample) reported that they had had conflicts during their collaborative efforts to support persons with special needs; 44% of these mentions concerned conflicts of professional interest and 31% were personal conflicts.
36% of the organizations in the sample could name other organizations with which they would not collaborate under any circumstances, while in the case of organizations that had perceived a conflict in their earlier collaborative relations, this proportion was 69%. These results suggest that even a single negative experience has a stronger influence (e.g. on the renewal of collaborative relations) than positive experiences have (Labianca and Brass 2006). Most frequently, professional reasons, political commitment or the reputation of the partner organization were the reasons why organizations refused to cooperate; personal reasons were cited less often (by only 12% of all respondents). These replies are an indication that conflicts that arise in the course of earlier collaborative efforts can influence readiness to cooperate in the future.
4.2. analysis of the collaborative network of disability organizations
Besides using traditional means of measuring collaborative relations we
154 ROLAND KESZI–JUDIT PÁL–GERGŐ PAPP
also strove to map and so to give a visual picture of the collaborative relations that exist among disability organizations in Hungary. We used a name generation method along three dimensions of collaborative network relations, where the (nominating) organizations questioned could name a maximum of 5 other organizations.10
The first indicator of cooperation in our collaborative network analysis was the creation of joint projects. The significance of this aspect of the investigation was confirmed by the figure mentioned earlier (namely, that 69% of cases of collaboration were focused around some kind of joint project). This network involves a total of 481 organizations, of which 218 were nominating organizations.
We first examined the networks according to how they were obtained in the database; this resulted in an asymmetric, directed network (that is, we differentiated between the ‘giving’ and ‘receiving’ [or nominators and nominated] organizations). We observed a total of 598 relationships; the density indicator expressing the ratio of all possible and actual relationships was quite low at only 0.26%. In the next step we symmetrized the networks (that is, we made no distinction between the organizations giving and receiving the connection, a step that was justified by the name-generating measurement process). In the case of the symmetrized network, the total number of relationships was 1170 and the density value was 0.5%. On this basis there was an average of 1.24 relationships per organization in the asymmetrical network and 2.39 in the symmetrical network. The organization with the most relationships had joint projects with 34 other organizations in the asymmetrical matrix and with 39 in the symmetrical matrix. The centralization index – measuring how many of the existing relationships a given organization possesses – shows that the biggest national organizations in Hungary (that focus on a particular disability) are the most important actors.
We also examined whether typical cliques or subgroups can be observed in the network of joint projects. The biggest subgroups in which each member is in connection with all the others contain 3 organizations. A total of 23 such cliques can be found within the network, for the most part the biggest national organizations.
An examination of the collaborative network – based on joint projects –
10 Two dimensions concerned the content of relations between the organizations, and one dimension the quality of those relations. The questions were worded as follows: 1. Please name no more than five organizations with which you have had the most joint projects; 2.
Please name no more than five organizations with which you have submitted the most joint applications. 3. Please name no more than five organizations with which you have the most harmonious collaboration.
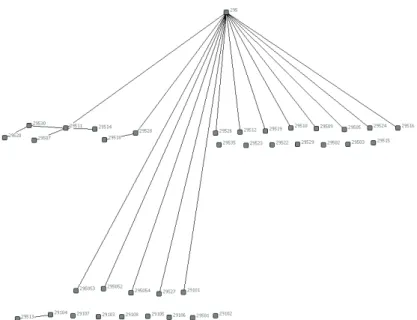
among disability organizations by disability branch showed that although there is some cross-over of the organizations between disability branches, the majority of organizations tend to conduct joint projects with organizations in their own area of disability. A good example of this is the separate network diagram for organizations dealing with support for persons with physical disability, grouped for the most part around MEOSZ, the big national organization (coded 295). We also made a separate analysis of the collaborative relations among the organizations affiliated to MEOSZ which were included in our data base; this resulted in the following diagram:
Figure 2 Networks of organizations affiliated to MEOSZ
It can be seen from the above figure firstly that joint projects are quite rare among organizations operating on the same levels, and secondly that local groups tend to have connections not with the corresponding county or regional member organizations but with the national organization (see Figure 1). Johnston and colleagues also observed a separation of this type between organizations at the national and local levels in their study of Scottish disability organizations. According to their findings, 57% of national organizations are in contact with other national organizations and none of them reported that they had connections with local organizations, while 44%
Figure 2. Networks of organizations affiliated to MEOSZ
156 ROLAND KESZI–JUDIT PÁL–GERGŐ PAPP
of local organizations were cooperating with national organizations and only 8% had contacts with local organizations (Johnston et al. 2009: 20).
The other aspect of cooperation in our analysis of collaborative networks concerns the submission of joint applications. This factor is also interesting because 83% of the disability organizations listed grants among their revenue sources. A total of 275 organizations appear in this network, the density is 0.34% and in the case of the symmetrized network 0.66%. In the asymmetrical network there is an average of 0.92 connections per organization and in the symmetrical network 1.82. The organization with the most connections in both the asymmetrical and the symmetrical matrix implemented joint projects with 12 other organizations. According to the results, in this case the big Hungarian national organizations were also indicated most frequently.
When measuring the quality of the connections in our collaborative network analysis, we focused on mapping only harmoniously collaborating networks and we did not ask in detail about conflictual relations. The network of harmonious collaborations contains a total of 413 organizations.
In the original, asymmetric, directed network based on the replies of the organizations interviewed we observed a total of 460 connections with a density of 0.27%. In the case of the symmetrized network there were a total of 902 connections and the density was 0.53%. There was an average of 1.24 connections per organization in the directed network and 2.39 in the undirected; the organization with the most connections in the case of the undirected network carried out joint projects with 34 organizations and in the symmetric matrix this figure was 39; in this case too, the central position of the national organizations can be observed.
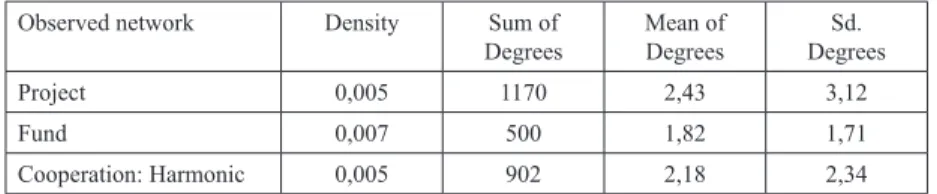
Table 1 contains details of the descriptive analyses of the three networks.
Observed network Density Sum of
Degrees
Mean of Degrees
Sd.
Degrees
Project 0,005 1170 2,43 3,12
Fund 0,007 500 1,82 1,71
Cooperation: Harmonic 0,005 902 2,18 2,34
Graphic comparison of the three collaborative networks
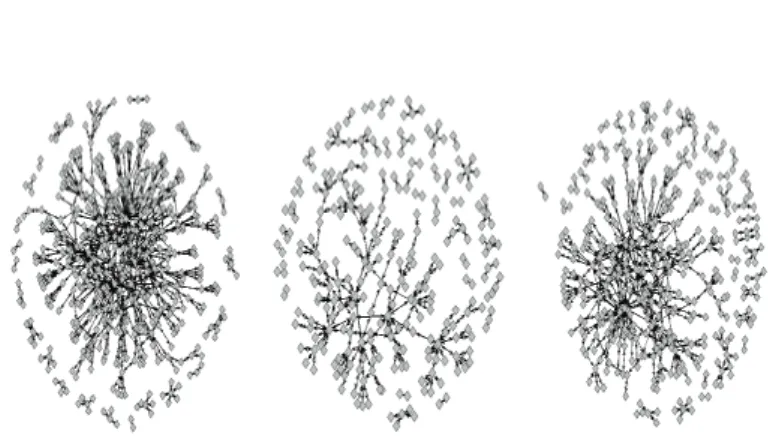
We also compared the three collaborative networks graphically using the Fruchterman-Reingold method which traces the points that belong close together and separately positions them on a connections diagram.
If we compare the three collaborative networks mapped in the course of the research, we find in all three collaborative network diagrams a few
CORVINUS JOURNAL OF SOCIOLOGY AND SOCIAL POLICY 1 (2014)
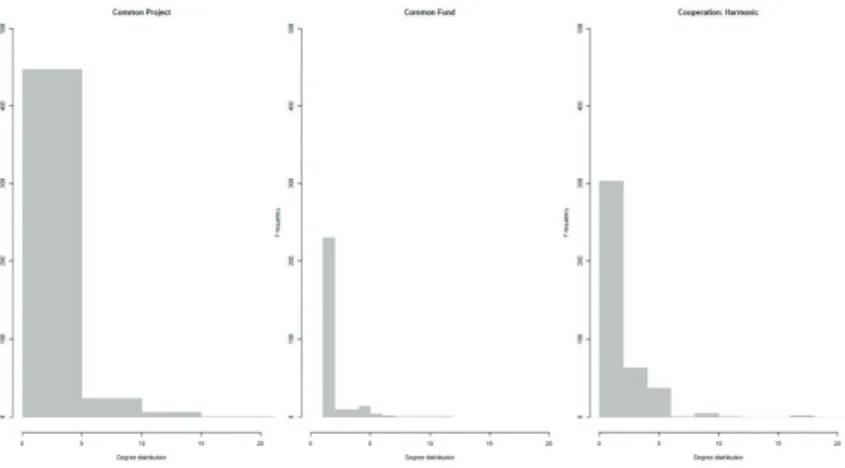
organizations that can be regarded as the core; that actively collaborate and link many other networks. However, in general most organizations typically form ‘islands’, implementing projects with only a very few organizations, and moreover in such a way that they are not linked to the organizations at the core of the network. This picture is essentially comparable to the scale- independent network formation that can be seen in the analysis of degree distribution: there are few organizations that actively collaborate with many other organizations, while we find many organizations that collaborate with a few organizations both in the implementation of projects and in submitting applications. In parallel with the results of the mathematical characteristics, a comparison of the three diagrams also shows that the greatest number participate in the implementation of ad hoc projects and submit far fewer applications in tandem with other organizations. The connections diagram about the harmonious nature of the cooperation shows that, when actually realised, the two kinds of collaboration (joint projects and applications) are far from harmonious in all cases. Unfortunately, due mainly to the different sizes of the individual networks, our database did not allow us to explore deeper correlations between the three networks, such as overlapping connections.
Figure 3 Graphical comparison of the three observed networks
Degree distribution
The degree distribution of the individual networks also clearly illustrates the difference between the networks: in all three cases there is a left-skewed, scale-independent distribution. It can be
Figure 3. Graphical comparison of the three observed networks
Figure 4. Degree distributions of the observed networks
158 ROLAND KESZI–JUDIT PÁL–GERGŐ PAPP
seen from the diagram that there are very few organizations with which many others cooperate, although it is clear that projects predominate over applications in terms of the type of collaboration. It is interesting to note that where there is harmonious collaboration there are very few organizations that have any kind of conflict-free cooperation.
figure 4 Degree distribution of the networks examined
Regional distribution in the case of projects
We also examined the regional distribution of the organizations in the three connection networks. It might seem to be evident that organizations that operate in the same region would carry out a higher proportion of joint projects with each other than with organizations operating in other regions.
However, our earlier results showed that collaborative relationships are often lacking at the local level and that organizations tend rather to have connections with the national organization for the given branch of disability. As part of the analysis we created diagrams for the denser networks to illustrate the results.
The first diagram was designed to create groups on the basis of regions; that is, so that organizations classified in a similar region appear together in a largely similar place. In contrast, in the second figure we used the Spring embedded method where the visualization process positions the organizations in the centre and those in the periphery separately. The third diagram is a variation of the second, in which we showed actors with high betweenness
Figure 3. Graphical comparison of the three observed networks
Figure 4. Degree distributions of the observed networks
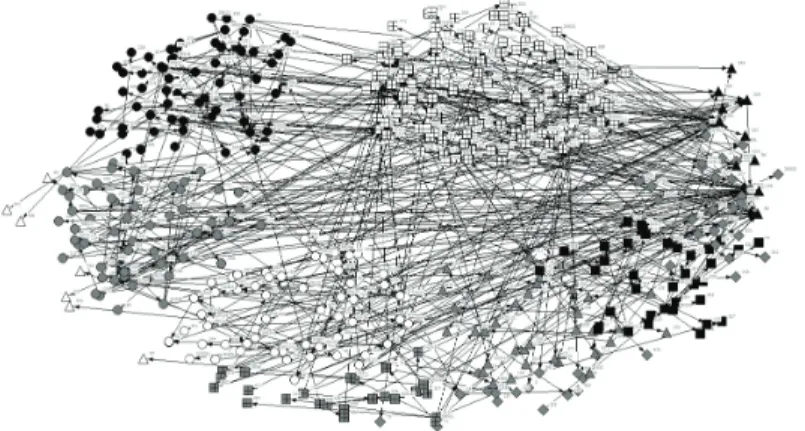
values. The results show that there is some kind of regional segregation - although collaborations tend to be dominated much more by organizations of a national character, at the same time in many cases these collaborations are also realized between neighboring regions. These results are in line with our earlier findings.
Figure 5 Distribution of organizations by region
In conclusion, it can be said from the results of our network analysis that joint projects are more common among disability organizations than joint applications, and that the larger, national organizations receive the most nominations and they therefore play a linking, bridging role in the realization and implementation of projects. In the course of
harmonious collaborations these organizations also received the most nominations; that is, besides playing a leading role in projects and submitting applications, these organizations are able to handle their collaborative relationships harmoniously thanks to their size and experience. However, we also identified smaller organizations that, although they received fewer nominations than the bigger organizations, nevertheless play a significant role in the creation of projects and in applications.
Figure 5. Distribution of organizations by region
Legends: Northern Hungary (circle and black), Northern Great Plain (gray and circle), Southern Plain (white and round), Central Transdanubia (squares and black), Western Transdanubia (square and gray), Central Hungary (square and white), South Transdanubia (triangle and gray), National (triangle and black) - foreign (triangle and white), on the basis of information not classified (squares and gray)
Table 1.: Descriptive network statistics
Observed network Density Sum of Degrees
Mean of
Degrees Sd. Degrees
Project 0,005 1170 2,43 3,12
Fund 0,007 500 1,82 1,71
Cooperation: Harmonic 0,005 902 2,18 2,34
160 ROLAND KESZI–JUDIT PÁL–GERGŐ PAPP
suMMing up
In our study we examined the collaborative connections that disability organizations have with other (mainly civil) organizations that support people with special needs using a non-representative sample of 500 respondents using a survey method and network analysis. For the survey we gathered information about the situation of the disability organizations, the positive and negative sides of their collaborative relationships, and on the concrete collaborative relations between the organizations. According to our findings regarding collaborative relationships, disability organizations in Hungary are characterized by duality. On the one hand, the great majority of the organizations in the sample consider it necessary to cooperate with other organizations in supporting persons with special needs, and the majority of them do in fact collaborate with other organizations. Moreover, on the basis of several questions we found that, in general, the respondents judge their collaborative relations positively. But together with this favorable judgment, a quarter of the organizations reported that conflicts had arisen in the course of cooperation, most often caused by professional problems and personal factors. Taking into account the types of partner organizations, it was found that the relationships that tended to be most collaborative involved other disability organizations, while the least collaborative relations of the institutions questioned involved different market organizations and state bodies.
The network analysis of the concrete collaborative network relations that exist among disability organizations in Hungary reinforced in a number of ways the results obtained by the survey method. For example, it revealed that collaboration among organizations that operate in different disability branches is quite limited, while it is intensive among organizations with the same target groups. Another important finding is that, in the case of joint projects and applications, the national umbrella organizations for the big disability branches play a central role, functioning as bridges in the collaborative networks. In addition to joint activities, these organizations also occupy a central place in the network of harmonious relations. This could be because their size (in terms of members and finances), nation-wide recognition and experience make them capable of conducting numerous projects efficiently and without conflict. At the same time, the results also show that besides the national umbrella organizations the smaller organizations are also actors that cannot be ignored in Hungarian disability affairs. The network approach also revealed that in many cases collaborative relations are hierarchical; that is, they are burdened with inequalities of power (for example, organizations
that belong to national umbrella organizations do not always seek partners for collaboration at their own level but cooperate directly with the national organization and this pattern of collaboration dominates regional articulation).
As a final conclusion, our results showed the ambiguity of cooperation and exclusion. Although cooperation was seen as an important value for all respondents, in some cases when organizations should have established a cooperative relationship for practical reasons, they showed reluctance and appeared to place their own interests above others.
referenCes
Állami Számvevõszék (2010), Jelentés a fogyatékos személyek támogatásában részt vevõ nonprofit szervezeteknek nyújtott nem normatív állami támogatás és ingyenes állami vagyonjuttatás felhasználásának ellenõrzésérõl, Budapest: ÁSZ.
Önkormányzati és Területi Ellenõrzési Igazgatóság.
Bartal, Anna Mária – Kákai, László – Szabó, István (2005), A nonprofit szervezetek érdekképviselete, kapcsolatrendszere, Budapest: Századvég Civil Akadémia Bartal, Anna Mária (2006), A hálózatelemzés lehetõségei és gyakorlati konzekvenciái a
nonprofit szervezetek vizsgálatában – egy ernyõszervezet esettanulmánya alapján, Budapest: Magyary Zoltán Felsõoktatási Közalapítvány - Civil Társadalomért Alapítvány.
Bartal, Anna Mária – Molnár, Krisztina (2006), Civil kapcsolati hálók az Ister-Granum Eurorégióban. Kutatási jelentés, Esztergom: Eurohíd Alapítvány
Hablicsek, László – Richter, H. Mária. (2004), A fogyatékossággal élõk számának területi elõrebecslése 2021-ig – Zárótanulmány”, Budapest: Aktív Társadalom Alapítvány.
Johnston, Lucy – Lardner, Clare – Barton, Anna – Martin, Mike (2009), Mapping Scotland’s disability organisations, Edinburgh, Scottish Government Social Research
Labianca, Giuseppe – Brass, Daniel J. (2006), ”Exploring social ledger: negative relationships and negative asymmetry is social networks in organizations”, Academic Management of Review, Vol. 31, No. 3, pp. 596–614.