Vol. 46 2020 No. 1 DOI: 10.37190/epe200104
BALÁZS LEMMER1, ZOLTÁN JÁKÓI1, NIKOLETT GULYÁS1, SZABOLCS KERTÉSZ1, SÁNDOR BESZÉDES1, ZSUZSANNA LÁSZLÓ1, CECILIA HODÚR1
THE EFFECT OF SONICATION AND STIRRING ON ULTRAFILTRATION OF FERMENTATION BROTH
Membrane separation is a widely used technique whose main obstacle is membrane fouling, dur- ing which a solution or particles accumulate on the membrane surface or inside its pores. This phe- nomenon causes both reversible and irreversible flow resistances that can be minimized with comple- mentary techniques such as sonication and/or stirring. The application of ultrasonic energy can increase the flux by breaking the concentration polarization and cake layer on the membrane surface without affecting the intrinsic permeability of the membrane. Our work focused on cellulase and β-glucosidase enzyme recovery through sonicated/stirred ultrafiltration from the real fermentation broth, at which the fermentation liquid was produced from tobacco plants. Membrane filtrations were carried out in a la- boratory-grade batch ultrafiltration cell, extended with stirrer and ultrasound processor. The effects of stirring speed and ultrasound treatment were investigated on the membrane’s permeate flux efficiency and on the quality of recycled enzymes. Resistance values were calculated by the resistance-in-series model, as well as by Hermia’s analysis, to reveal deeper, process-related information. Our results re- vealed that enzymes could be efficiently separated from real fermentation broth. Furthermore, the en- zyme activity test showed that neither stirred nor sonicated processes were detrimental to the enzyme activity.
1. INTRODUCTION
The economically exploitable classic fossil energy sources on Earth are considera- bly limited. Biomass energy is one possible substitute, of which, for instance, bioethanol could be produced from numerous raw materials besides starches and sugars such as from lignocellulose sources [1]. However, lignocellulosic-based bioethanol production needs significant enzyme utilization. Enzymatic hydrolysis of a cellulosic matrix is a very cost-intensive processing step that is largely determined by the market price of _________________________
1Department of Process Engineering, Faculty of Engineering, University of Szeged, 9 Moszkvai krt., Szeged, H6725, Hungary, corresponding author C. Hodúr, e-mail address: hodur@mk.u-szeged.hu
enzymes [2]. To reduce costs, our study focused on the membrane separation tech- niques, which are considered to be the most efficient methods for enzyme recovery [3], as they are widely used in special installations such as in bioreactors [4]. The fouling problem is one of the most important questions for the membrane application [5]. Both sonication and stirring were investigated as enhancements to the processing efficiency.
Both methods should increase the permeation flux and reduce flow resistances which should make enzyme filtration cheaper and provide a more environmentally friendly processing method. The enhancing effect of stirring is well known due to the resulting increase in turbulence on the membrane surface.
Ultrasound (US) refers to sound waves with a frequency higher than 20 kHz, which, when passed through a medium, generates acoustic cavitation and induces surface vi- brations. The phenomenon of mechanical vibrations is used to clean or disrupt mem- brane fouling and minimizes cake formation during filtration [6]. A supposed mechan- ical effect from the US are mechanical shear forces created by microstreaming and shock [7, 8]. Since our work is focused on enzyme recovery, it is important to know the effect of the US on not only the permeate flux but also on the enzymatic activity. Au- thors working with the US to achieve enzymatic hydrolysis have attributed the process to two different effects: i) temperature-induced acceleration [9], and ii) pressure-in- duced degradation [10]. The activity change in enzymes results predominantly from the variations of their secondary and tertiary chemical structures, while still controversial attributions are the different US frequencies, intensities and application conditions. In short, low-frequency US (<100 kHz) mainly promotes inhibition of enzymatic activity, which is probably caused by cavitation and shear forces [11]. Higher US frequencies should be applied to investigate their influence, which could be very different from that observed in low-frequency US [12].
2. MATERIALS AND METHODS
Membrane separations. Membrane separation was carried out with a laboratory- -grade, stirred-batch, ultrafiltration cell with a capacity of 400 cm3 (Fig. 1). The cell was equipped with a polyethersulphone membrane 76 mm, in diameter, with a 10 kDa cut- off value (Sterlitech PW UF Membrane). During filtration, the samples – originated from the fermentation broth – were stirred and/or sonicated at the following combina- tions: without stirring and the US, only stirring, only US and both stirring and US. Stir- ring was carried out with a magnetic stirrer at a revolution range of 0–500 rpm and a 30 kHz ultrasound processor (Hielscher, UP100H with MS10 transducer). Sonication was used at 60% amplitude, half duty cycle and with a 30 mm membrane-transducer distance. Initially, the volume of the filtrated media was 200 cm3 (i.e., at the beginning of the ultrafiltration) which then has been reduced to 50 cm3, thus, gaining 150 cm3 of permeate. The transmembrane pressure between the two sides of the membrane was
0.3 MPa. The permeate was discharged continuously and fermentation broth was con- centrated during the process.
Fig. 1. Sonicated ultrafiltration cell module during operation
The filtration time and permeate volume were measured. The membrane permea- bility J, dm3/(m2·h), is expressed as the permeate flux through the membrane:
J dV Adτ
= (1)
where A is the filter’s surface area, m2, V is the filtration volume, dm3, and τ is the filtration time, h. The total flow resistance, 1/m, Rt consists of three components. One of them is the membrane resistance Rm, and the two other constitute the irreversible resistance Rirr and the reversible resistance Rrev:
t m irr rev
R =R +R +R (2)
The total flow resistance R, 1/m, is:
R dP ηJ
= (3)
where dP is the transmembrane pressure, Pa, η is the dynamic viscosity of the perme- ate, Pa·s.
Rt was calculated by assuming the critical flux of separation, Rm was calculated from the flux of distilled water through a new and clean membrane, while Rirr was figured out from the flux of distilled water through a rinsed membrane after the separation [13]:
m
w w
R dp J η
= (4)
irr m
w A w
R dp R
J η
= − (5)
rev irr m
C p
R dp R R
J η
= − − (6)
where Jw is the water flux of the clean membrane, dm3/(m2·h), ηw is the dynamic vis- cosity of water, Pa∙s, jwA is the water flux after the concentration test, JC is the constant flux at the end of the filtration, and ηp is the dynamic viscosity of the permeate.
The fermentation broth was obtained from the hydrolysis of experimental tobacco plants by cellulase sources from Trichoderma reesei (C2730, Sigma-Aldrich) and β-gluco- sidase from Aspergillus niger (Novozyme 188, Sigma-Aldrich) in equal volumes. The total enzyme concentration of the broth was 0.6 vol. %. C2730 cellulase (with a nominal enzyme activity of 700 U/g), containing β-glucanase units, catalyzes the breakdown of cellulose into glucose and cellobiose (and with significantly lower probability into higher glucose polymers), while β-glucosidase (with a nominal enzyme activity of 250 U/g) catalyzes the hydrolysis of cellobiose units into glucose molecules. C2730 enzyme pro- tein has an average molecular mass of 85 kDa (which corresponds to approximately 0.09 µm in size), and the MW of the applied β-glucosidase is 26 kDa (approximately 0.03 µm), according to the datasheet provided by Sigma Aldrich. Cellobiose units (i.e., two β-D-glucose units linked by a β(1–4) bond) have an average molecular size of 1.03 nm, whilst glucose molecules in an open-chain form (i.e., when dissolved in water) have an average length of 1.5 nm. The molecular size (weight) of a cellulose chain can vary greatly, depending on how many glucose units it contains, that is, which part of a given plant it has been extracted from. Therefore, the average particle size distribution of the ultrafiltrated fermentation media extended from 1 to 90 nm, since it contained the en- zymes and the end products (i.e., saccharides) of the enzymatic digestion processes to the largest degree. Even so, it should definitely be taken into account that the fermenta- tion broths might have contained larger particles as well, for example, higher carbohy- drate polymers, contaminants or plant-originated proteins, but their average concentra- tion compared to the enzymes and sugars discussed above, can be considered negligible.
The broth was centrifuged at 5400 rpm for 30 min and the supernatant was used for the separation. The supernatant had 1.9±0.05 wt. % of dry matter and pH = 5.5. The
solid matter consisted of mono- and disaccharides from the hydrolysis of cellulose, small particles from the raw material, enzymes and other proteins.
Enhancement factor. Enhancement factor, E, is used to measure the permeate flux improvement [14]:
treated untreated
E J
= J (7)
where Jtretaed is the steady-state flux achieved when sonication and/or stirring was ap- plied, and Juntreated is the steady-state flux when neither stirring nor sonication was used.
Energy consumption. Power consumed by the stirrer (Pstr) was calculated from [15]:
5 3
str e
P =N d n ρ (8)
m
Ne =kRe (9)
d N2
Re ρ
= η (10)
where Ne is the power number, Re the Reynolds number. The constants k and m of eq. (9) were calculated after [16] since a paddle-type stirrer was used, d is the diameter of the stirrer, m, N is the stirring speed, 1/s, ρ is the density of the fluid, kg/m3, η is the viscosity.
Ultrasonic power dissipated in the liquid (PUS) was calculated by the calorimetric method [17] based on the measurement of the temperature increase due to the conver- sion of US energy into heat:
US p
P mc dt dτ
= (11)
where m is the weight of the liquid, kg, cp the specific heat capacity, J/(kg·K), and t is the temperature, K, τ is the time, s.
Hermia’s empirical models. The Hermia model, one of the most comprehensive fouling prediction models, incorporates four different fouling mechanisms, namely:
complete blocking, intermediate blocking, standard blocking and cake layer formation [18]. Four empirical models for dead-end filtration were developed by Hermia [19].
Equation (7) is based on constant pressure filtration laws that correspond to four basic types of fouling: complete blocking, intermediate blocking, standard blocking, and cake
layer formation. The considered type of fouling depends on the value of parameter n in the following equation:
2 2
d d n
dV K dV
τ τ
=
(12)
Here, V is the accumulated permeate volume, m3, K is the model constant, and n is the model parameter which depends upon the predominate fouling mechanism involved. Typ- ical values of the parameter n are as follows: n = 2 – complete blocking, n = 1 – interme- diate blocking, n = 3/2 – standard blocking and n = 0 if a gel layer is formed.
Hermia empirical model applicable to dead-end filtration was modified [20] for crossflow filtration:
( )
2p n
CF p pss p
dJ K J J J
dτ
= − − (13)
where Jp is the permeate flux, KCFis the phenomenological coefficient dependent upon the specific fouling mechanisms, and Jpss is the steady-state permeate flux, m/s.
Enzyme activity. The enzyme activity was determined by the classical filter paper test. In laboratory fermenters with a volume of 100 cm3, 90 cm3 of distilled water and 10 cm3 of concentrated broths from ultrafiltration were added to 1 g of crystalline cel- lulose. Then the samples were incubated in a laboratory water bath heated to a constant temperature of 45 °C. Every 2 h, 1 cm3 of the sample was removed from the broth and boiled for 2 min to quench further enzyme activity. pH was then fixed at 5 by means of dilute H2SO4 and NaOH solutions.
The reducing sugar content, proportional to the enzyme activity, was determined spectrophotometrically by the 3,5-dinitrosalicylic acid (DNSA) method, at which 1 cm3 of DNSA and 0.1 cm3 of the sample were mixed and heated at 90 °C for 15 min. After cooling in ice water, 1 cm3 of distilled water and 1 cm3 of 40% potassium sodium tartrate were added to the samples. The absorbance was measured at 575 nm.
3. RESULTS
During the first series of experiments, the fermentation liquid was being ultrafil- trated without the application of ultrasound with different stirring speeds to determine the effects of it on the permeate flux. Figure 2 shows the results obtained for the change of flux under various stirring speeds. As shown in Fig. 2, the flux value of 0 rpm no US (no stirring, no sonication) was the lowest. Stirring creates higher flux at all stirring speeds, but over 300 rpm no significant flux increments could be observed. Every flux
curve starts from a similar and higher value followed by a rapid drop and an approxi- mately steady-state period from 750 s. The decrease was observed at 0 rpm no US, and the increase of the stirring pH reduces the flux decrease.
Fig. 2. Permeate flux of fermentation broth vs. time at different stirring speeds (no US means ultrasound was not used)
To characterize the flux, power functions with decreasing exponent values were fitted to each curve. The dynamics of the decrease is expressed by the index of fitted functions shown in Table 1, which presents the values of the fitted parameters and the degree of model fitness (represented by R2 values).
T a b l e 1 Fitted parameters of power functions
Parameter 0 rpm no US
50 rpm no US
100 rpm no US
300 rpm no US
400 rpm no US
500 rpm no US Index –0.493 –0.147 –0.169 –0.159 –0.173 –0.149 Intersection 8×10⁻⁵ 2×10⁻⁵ 3×10⁻⁵ 3×10⁻⁵ 4×10⁻⁵ 3×10⁻⁵ R2 0.999 0.919 0.9157 0.9299 0.9037 0.8569
That means that the character of the flux curves, i.e., the filtration mechanisms, were independent of the stirring speed. The intersection of the ordinate is also shown in Table 1.
This parameter refers to the initial filtering flux and displays high similarities among every stirred sample. The largest value occurred when stirring was not used, while the greatest decrease in the flux was observed.
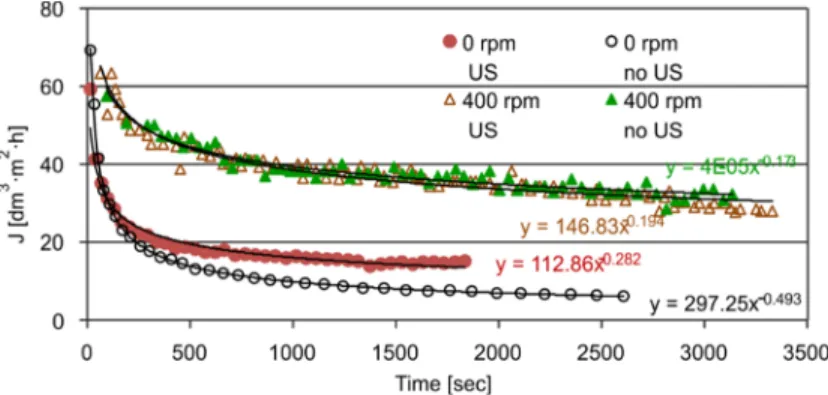
Figure 3 shows the variation of permeate flux with time when combining stirring and the US. When stirring was applied, no real difference was present in either the flux values or in the increments and indices of the fitted power functions. The steady-state values of the permeate flux were much lower for all operating conditions when stirring was not applied, but sonication produced a noticeable change. Fitted power functions show the difference between treatment types. For example, the index for 0 rpm US was
less than 60% of the index for 0 rpm no US which resulted in a minor decrease when ultrasound was used. The positive effect of ultrasound may be caused by mechanical forces or shear forces created by microstreaming and shock. The ultrasound processor applied operates at a 30 kHz frequency, where cavitation is a predominant force. Sig- nificant differences cannot be observed when both stirring, and US were used because the effect of stirring had a dominant effect on the flux behavior.
Fig. 3. Permeate flux of fermentation broth vs. time under various treatment types (US/no US means ultrasound was/was not used)
Flux data does not always give enough information about the deeper behavior of filtering parameters or mechanisms, although different types of resistances should be taken into account (Fig. 4).
Fig. 4. Resistance values during the filtering of fermentation broth at different treatment types (Rm, Rt, Rrev, and Rirr means membrane, total, reversible and irreversible resistance;
US/no US means ultrasound was/was not used)
Membrane resistances were low in all cases (Fig. 4) which implies that the selection of membrane material was appropriate because it was not the main obstacle for the sep- aration of fermentation broth. The total resistance was significantly different from the
other types of resistances, and the total was the highest when neither stirring nor ultra- sound was applied. The main contribution to the total resistance was the irreversible resistance when no stirring was applied. It was caused by the accumulated layer – that consisted of particles bigger than the pore size of the membrane (i.e., proteins, carbohy- drates originated from cellulose, etc.) and the enzyme molecules themselves on the sur- face of the membrane, which could not be removed due to the lack of force, or present but insufficient force in the system. The irreversible resistances were smaller than ex- pected; the layer on the surface of the membrane protected the membrane’s pores from fouling and there was a quite big difference between the molecular weight of separated components (e.g., enzymes) and the cut off value, as discussed in Chapter 2. When ul- trasound was applied, the resistances decreased significantly: reversible resistance de- creased greatly (by 62%), while the irreversible resistance decreased by 34% compared to 0 rpm no US. This phenomenon was the consequence of ultrasound-induced cavitation and shear forces. There is a similar but more expressed tendency when stirring is applied. The value of total resistance and reversible resistances decreased significantly further (by 16 and 28%, respectively) compared to 0 rpm US but there was no significant difference between stirred and sonicated samples and samples that were only stirred but not sonicated.
Fig. 5. Ratios of resistances (Rm, Rt, Rrev, and Rirr means membrane, total, reversible and irreversible resistance; US/no US means ultrasound was/was not used)
Ratios between different types of resistances (Fig. 5) provide useful information about the filtration mechanisms. The ratio of irreversible to total resistance without stir- ring was low (0.1) but stirring increased the ratio to 0.38. The ratio decreased to 0.29 when stirring and ultrasound were jointly used. This phenomenon could be explained by the following: stirring helped the particles reach the membrane pores by reducing the thickness of the gel layer above the membrane, but when ultrasound was used, cavitation assisted the particles in permeating through the membrane. An opposite tendency was
observed in the ratio of the reversible to total resistance; the ratio was the largest at samples without stirring and without sonicating, i.e., the cake above the membrane sur- face was the most developed. Application of stirring and/or ultrasound reduced the cake layer thickness, i.e., the value of irreversible resistance. Meanwhile, the particles had a greater chance to reach the pores, i.e., the resistance value belonging to the irreversible fouling increased. This tendency was also observed with the Rirr/Rrev ratio. The highest value occurred when stirring single-handedly was applied and smaller when both stir- ring, and ultrasound were applied together.
To accurately predict fouling phenomena in real solutions, Hermia’s mathematical fouling models can be useful. The four main models were tested for the combinations of stirring and/or ultrasound. Figure 6 shows the matching of the experimental results to Hermia’s models under various conditions.
Fig. 6. Fittings of the experimental results to Hermia’s models under various conditions:
a) without stirring and sonication, b) 400 rpm stirring without sonication, c) sonicated but without stirring, d) stirred at 400 rpm and sonicated
Complete blocking occurs when the foulant sizes are similar to the membrane pore size, which results in reducing the number of open pores without particle deposits on the membrane surface. Intermediate blocking is similar to complete blocking to some extent, i.e., a single particle can precipitate onto other particles to form multi-layers, and it can directly block some membrane areas resulting in an increase in cake thickness.
a) b)
c) d)
Standard blocking is similar to adsorption, at which the particles approaching the mem- brane are adsorbed and deposited onto the internal pore wall thereby reducing the pore volume. Cake formation is the most severe fouling mechanism. In this process, foulants deposit on the particles that already block the pores and result in cake formation. For simplicity, the degree of model fitness (R2) was used mainly to determine the fouling mechanisms that could explain the experimental data rationally.
T a b l e 2 R2 of fitted Hermia’s models
Conditions
Complete pore blocking
n = 2
Standard pore blocking
n = 1.5
Intermediate fouling
n = 1
Cake n = 0 US 0, 0 rpm 0.7494 0.8862 0.9465 0.9931 US 0, 400 rpm 0.8953 0.9153 0.932 0.9554 US 0.5, 400 rpm 0.9442 0.9599 0.9683 0.9655 US 0.5, 0 rpm 0.665 0.7189 0.7665 0.8379
For our samples, i.e., fermentation broth, it was obvious that complete and interme- diate blocking, as well as gel cake formation, were fitted well to the experimental results in all cases. Table 2 shows the fitted parameter values for Hermia’s models to the ex- perimental data obtained with/without the US and with/without stirring. According to the physical meaning and the definitions of the parameters of Hermia’s models (eq. 12), the values of these parameters should be higher when membrane fouling is more severe.
The fitting results of the complete pore-blocking model were the smallest, and the cake formation model was the highest except when both the US and stirring were used. Re- garding the molecular size distribution of the suspended and dissolved particles in broth (1–90 nm on average [21], not taking into account the negligible greater pollutants or other molecules) it was probable that most of the molecules were larger than the mem- brane pore (ca. 3 nm [22]), which suggests that all of the blocking mechanisms poten- tially occurred during the filtration process. This interpretation is consistent with the results of the measured reducing sugar concentrations discussed next.
In similar investigations, Liu et al. [1] used microfiltration to separate grape press extracts, while Simon et al. [14] for separation of dextran (MW = 500 kDa). Although the flux values also increased in their studies as mixing speed and US power intake increased, there were differences depending on the experimental conditions. Despite the much higher energy input/higher stirring speed of Rushton blades [1], the permeate flux increased, i.e., the efficiency value (Estirr) was much lower, at least a quarter of the values found for the paddle-mixers used in the present experiments.
According to the initial and the final volume of the filtered media, the specific dis- sipated US power during the process ranged from 0.0255 to 0.102 W/cm3, respectively.
Stirring, despite having significantly lower energy input (Pstirr) than dissipated ultra- sound power (PUS) resulted in a greater flux increase at our measurements. By increasing the mixing energy input, the efficiency factor also increased but in any case, exceeded the effect of ultrasound. The results confirm the filtration mechanisms derived from the use of the Hermia model, that is, the cake layer resistance on the membrane surface can be reduced more effectively by mixing than by the cavitation effect of US in the case of separation of high-molecular-weight molecules like proteins and/or enzymes.
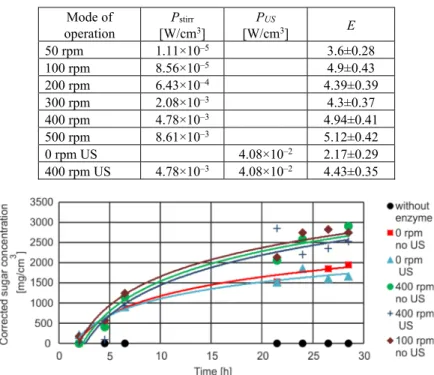
T a b l e 3 Average specific dissipated power and enhancement factors (E)
for ultrasound-assisted and stirred ultrafiltration Mode of
operation
Pstirr
[W/cm3]
PUS
[W/cm3] E
50 rpm 1.11×10⁻⁵ 3.6±0.28
100 rpm 8.56×10⁻⁵ 4.9±0.43
200 rpm 6.43×10⁻⁴ 4.39±0.39
300 rpm 2.08×10⁻³ 4.3±0.37
400 rpm 4.78×10⁻³ 4.94±0.41
500 rpm 8.61×10⁻³ 5.12±0.42
0 rpm US 4.08×10⁻² 2.17±0.29
400 rpm US 4.78×10⁻³ 4.08×10⁻² 4.43±0.35
Fig. 7. Corrected reducing sugar content measured by the enzyme activity tests (US/no US means that ultrasound was/was not used)
To improve the applicability of our separation methods, i.e., to be able to reuse the separated enzyme, enzyme activity tests were carried out. The corrected reducing sugar contents measured by the enzyme activity tests are shown in Fig. 7, where the corrected sugar content refers to the deducted, residual sugar content of the samples. The initial sugar content for each curve was considered as their zero points since the residual sugar content of the samples was deducted from the current value so that only the amount of reducing sugar produced during the test should be considered.
The time dependences of the measured sugar content show that the enzymes remain active in each sample, where neither the high-speed stirring nor the sonication had a det- rimental effect on the enzyme activity. Low energy sonication was also not harmful to the enzymes. A significant difference between sonicated and unsonicated samples was not found.
4. CONCLUSIONS
Ultrafiltration is an excellent separation method for enzyme recovery even from fermentation broth. The applied ultrasound (US) and/or stirring enhanced the separation efficiency and reduced the total resistance but stirring demonstrated a more beneficial effect than ultrasound on these parameters. Although there were no significant differ- ences between the total membrane filtration resistances of combined stirred and the US or only stirred samples, the filtration mechanisms differed, i.e., Hermina’s model anal- yses showed cake blocking mechanisms and intermediate blocking mechanisms, respec- tively. The result of Hermia’s model was proved by the ratio of reversible and irreversi- ble resistances. Intermediate blocking occurs when the solute molecule sizes are similar to the membrane pore size, thus some molecules can obstruct a membrane pore entrance without blocking the pore completely. Permeate flux increases with an increase of stir- ring speed as well as with the increase of ultrasound power. The activity of separated enzymes was satisfyingly high, i.e., neither ultrafiltration nor sonication reduced the enzyme activity.
ACKNOWLEDGMENTS
The authors are grateful for the financial support provided by the projects EFOP-3.6.2-16-2017 -00010 – RING 2017 and the National Office for Research, Development, and Innovation, NKFIH/OTKA, K115691.
REFERENCES
[1] LIU D.,VOROBIEV E.,SAVOIRE R.,LANOISELLÉ J.L., Comparative study of ultrasound-assisted and conven- tional stirred dead-end microfiltration of grape pomace extracts, Ultrason. Son., 2013, 20, 708.
[2] SINGH S.,SARMA S.,AGARWAL M.,GOYAL A.,MOHOLKAR V.S., Ultrasound enhanced ethanol produc- tion from Parthenium hysterophorus. A mechanistic investigation, Biores. Technol., 2015, 188, 287.
[3] PRASAD S.,SINGH A.,JOSHI H.C., Ethanol as an alternative fuel from agricultural, industrial and urban residues, Res., Cons. Rec., 2007, 50 (1), 1.
[4] ŚWIERCZYŃSKA A.,BOHDZIEWICZ J., Determination of the most effective operating conditions of mem- brane bioreactor used to industrial wastewater treatment, Environ. Prot. Eng., 2015, 41 (1), 41.
[5] ŚWIERCZYŃSKA A.,BOHDZIEWICZ J.,KAMIŃSKA G.,WOJCIECHOWSKI K., Influence of the type of mem- brane-forming polymer on the membrane fouling, Environ. Prot. Eng., 2016, 42 (2), 197.
[6] GAJENDRAGADKAR C.N.,GOGATE P.R., Intensified recovery of valuable products from whey by use of ultrasound in processing steps. A review, Ultrason. Son.., 2016, 32, 102.
[7] DELGADO-POVEDANO M.M.,DE CASTRO M.D.L., A review on enzyme and ultrasound. A controversial but fruitful relationship, Anal. Chim. Acta, 2015, 889, 1.
[8] O’DONELL C.P.,TIWARRI B.K.,CULLEN P.J., Effect of ultrasonic processing on food enzymes of indus- trial importance, Trends Food Sci. Technol., 2010, 21, 385.
[9] TUULMETS A.,RAIK P., Ultrasonic acceleration of ester hydrolyses, Ultrason. Son., 1999, 6, 85.
[10] VERCET A.,BURGOS J.,CRELIER S.,LÓPEZ-BUESA P., Inactivation of proteases and lipases by ultra- sound, Innov. Food Sci. Emerg. Technol., 2011, 2, 139.
[11] JADHAV S.H.,GOGATE P.R.,Ultrasound assisted enzymatic conversion of nonedible oil to methylesters, Ultason. Son., 2014, 21, 1374.
[12] FROMET M.T.,LOCKRIDGE O.,MASSON P., Resistance of butyrylcholinesterase of inactivation by ul- trasound. Effect of ultrasound on catalytic activity and subunit association, Biochim. Biophys. Acta, 1998, 1387, 53.
[13] FIELD R., Fundamentals of fouling, [In:] K.-V. Peinemann, S.P. Nunes (Eds.), Membrane Technology, Vol. 4, Membranes for Water Treatment, Wiley, Weinheim 2010.
[14] SIMON A.,GONDREXON N.,TAHA S.,CABON J.,DORANGE G., Low frequency ultrasound to improve dead-end ultrafiltration performance, Sep. Sci. Technol., 2000, 35, 2619.
[15] GREEN D.W.,PERRY R.H.,Perry’s Chemical Engineers’ Handbook, 8th Ed., McGraw-Hill Profes- sional, New York 2007.
[16] MCLAREN WHITE A.,SUMERFORD S.D.,BRYANT E.O.,LUKENS B.E., Studies in agitation, Ind. Eng.
Chem. 1932, 24 (10), 1160.
[17] RATONAINORO C.F.,WILHELM A.M.,BERLAN J.,DELMAS H., Power measurement in sonochemistry, Ultrason. Son., 1995, 2, 543-547
[18] MOHAMMADI T.,ESMAEELIFAR A., Wastewater treatment of a vegetable oil factory by a hybrid ultra- filtration-activated carbon process, J. Membr. Sci., 2005, 254, 129.
[19] HERMIA J., Constant pressure blocking filtration laws. Application to power law non-Newtonian fluids, Trans. Inst. Chem. Eng., 1982, 60, 183.
[20] VELA V.C.V.,BLANCO S.A.,GARCIA J.L.,RODRIQUEZ E.B., Analysis of membrane pore blocking mod- els adapted to crossflow ultrafiltration in the ultrafiltration of PEG, Chem. Eng. J., 2009, 149, 232.
[21] CHOO K.H.,LEE C.H., Effect of anaerobic digestion broth composition on membrane permeability, Water Sci. Technol., 1996, 34, 173.
[22] ABELS C.,CARTENSEN F.,WESSLING M., Membrane processes in biorefinery application, J. Membr.
Sci., 2013, 444, 285.