dOi: 10.1556/168.2018.19.3.8
Introduction
Carnivores are important components of ecosystems with wide-ranging effects on their ecological communities (Estes and Palmisano 1974, Ripple et al. 2014). Carnivores can influence the structure and composition of ecological com- munities (Estes and Palmisano 1974, McLaren and Peterson 1994, Estes 1996, Allen et al. 2014), and affect nutrient cy- cling within and between habitats (Cederholm et al. 2011).
Carnivores can also affect prey directly (i.e., through preda- tion; Estes 1996, Ripple et al. 2014, and competition; Krofel et al. 2012, Allen et al. 2015, Sivy et al. 2017) and indirectly (i.e., causing shifts in habitat selection to avoid predation;
Brown et al. 1999, Altendorf et al. 2001, Ripple and Beschta 2004, Atwood et al. 2007), and can compete with sympatric carnivores, altering their distribution and abundance (Estes and Palmisano 1974, Hunter and Price 1992, Courchamp et al. 1999, Prugh et al. 2009, Wolf and Ripple 2017).
Despite their importance to ecological communities, many carnivore populations are threatened due to factors
including habitat loss and human intolerance (Laliberte and Ripple 2004, Ripple et al. 2014). Carnivores are also among the most charismatic wildlife species (Kellert 1997, Ray et al.
2013), and national park visitors are often interested in seeing carnivores as part of their experience (Okello et al. 2008).
Therefore, conservation of carnivore communities within national parks and other wildlife refuge areas is critical to ensure ecosystem functionality and to enhance the experi- ences of national park visitors (Anderson and Barbour 2003).
However, monitoring carnivores can be difficult due to their low population densities and cryptic behaviors (Harmsen et al. 2010, Krofel et al. 2012, Allen et al. 2016a).
Due to remoteness and the difficulties involved with monitoring carnivores, the presence and distribution of the carnivore species in the Apostle Islands National Lakeshore (APIS) is largely unknown. APIS was established in 1970 and includes 21 of the 22 islands in the archipelago to conserve their unique natural and cultural values for the benefit and inspiration of current and future generations (Busch 2008).
Islands in the archipelago vary in size and distance from the
Is there anybody out there? Occupancy of the carnivore guild in a temperate archipelago
M. L. Allen
1, M. J. Farmer
2,5, J. D. J Clare
2, E. R. Olson
3, J. Van Stappen
4and T. R. Van Deelen
21Illinois Natural History Survey, University of Illinois, 1816 S. Oak Street, Champaign, IL 61820, USA
2Department of Forest and Wildlife Ecology, University of Wisconsin, 1630 Linden Drive, Madison, WI 53706, USA
3Natural Resources, Northland College, 1411 Ellis Ave S, Ashland, WI 54806, USA
4Planning and Resource Management, Apostle Islands National Lakeshore, 415 Washington Ave, Bayfield, WI 54814, USA 5Corresponding author. Email: mjmorales@wisc.edu
Keywords: Apostle Islands, Camera traps, Carnivore, Community, Distribution, Island biogeography, Occupancy, Species richness.
Abstract: Carnivores are important components of ecological communities with wide-ranging effects that vary with carni- vore size, natural history, and hunting tactics. Researchers and managers should strive to understand both the presence and distribution of carnivores within their local environment. We studied the carnivore guild in the Apostle Islands, where the distribution and occupancy of carnivores was largely unknown. We monitored 19 islands with 160 functioning camera traps from 2014-2017, from which we collected 203,385 photographs across 49,280 trap nights. We documented 7,291 total wildlife events with 1,970 carnivore events, and detected 10 of the 12 terrestrial carnivores found in Wisconsin. Detection rates for species were generally higher in summer than winter, except for coyotes (Canis latrans) and red foxes (Vulpes vulpes). Finite- sample occupancy estimates for carnivores varied across islands, with mean estimated occupancy across islands varying from a high of 0.73 for black bears to a low of 0.21 for gray wolves. Of the potential island biogeography explanatory variables for carnivore occupancy we considered, island size was the most important, followed by distance to the mainland, and then inter- island distance. We estimated that terrestrial carnivore species varied in the number of islands they were detected on from 1 island for gray wolves to 13 islands for black bears. Estimated carnivore richness across islands (i.e., the number of carnivores occupying an island) also varied substantively from 1 species on Michigan Island to 10 species on Stockton Island. Island size and connectivity between islands appear important for the persistence of the carnivore community in the Apostle Islands.
Nomenclature: List of Mammals (2018).
mainland. Based on the theory of island biogeography, small- er islands that are farther from the mainland should contain a subset of the species found on larger islands closer to the mainland due to connectivity and availability of resources;
however, the presence and distribution of carnivore popu- lations was largely unknown within the national lakeshore.
A historical report of observations reported the presence of red fox (Vulpes vulpes) and coyotes (Canis latrans) in the archipelago (Jackson 1920). In the early 2000’s, researchers found substantial connectivity between black bear (Ursus americanus) populations across the archipelago and high rates of immigration from mainland bear populations (Belant et al. 2005). Additionally, the recent discovery of American martens (Martes americana), Wisconsin’s only endangered mammal, in the archipelago (Allen et al. 2018) has sparked a greater interest in understanding the carnivore community within the park. Despite this, no research has been conducted to describe the distribution of the full suite of carnivore spe- cies within the archipelago.
To better understand the carnivore community within the Apostle Islands archipelago, we used a systematic grid of 160 functioning camera traps deployed on 19 of 22 islands to de- termine occupancy, detection probability, and richness of the terrestrial carnivore community. Our objectives were to: 1) Determine the importance of island biogeography variables (island size, distance to nearest other island, and distance to mainland) in species-specific occupancy. We expected that one or all of the island biogeography variables would affect occupancy and that these would be consistent across species.
2) Determine archipelago-wide detection probabilities in summer and winter, hypothesizing that detection rates would be higher in summer when most species are more active. 3) Determine the finite-sample estimated occupancy and mean
estimated occupancy for each of our focal carnivore species to understand patterns of distribution for each species. And, 4) Calculate observed and estimated species richness for each of the 19 islands surveyed to understand the patterns in distri- bution of the carnivore community.
Methods Study area
The Apostle Islands are an archipelago of Pleistocene rel- ict sandstone islands located in southwestern Lake Superior, Wisconsin, USA. Microclimatic conditions, which influence vegetative communities, are highly variable between islands and depend on the island’s size, elevation, and location with respect to Lake Superior (Table 1) (Judziewicz and Koch 1993). The islands are in the transition zone between northern boreal coniferous forest and deciduous forest, which creates a diverse vegetative structure (Craven and Lev 1987). The mean annual temperature for the duration of this study was 4.4°C, with minimum and maximum temperatures ranging from −30.0°C to 32.8°C. Average annual precipitation for the three years in this study was 82.8 cm of rainfall and 197.4 cm of snowfall (National Centers for Environmental Information 2017). Ice cover is an important factor for mammalian com- munity structure in temperate archipelagos, as it influences the propensity for immigration and emigration (Lomolino 1988, Adams et al. 2011). Ice cover in the Bayfield harbor, which is indicative of overall lake trends, has decreased over the past 150 years at a rate of about 3 days/decade (Howk 2009), and ice bridge connection between Isle Royale, a sin- gle-island system also in Lake Superior, has decreased due to Table 1. Characteristics of the individual islands (in order of size) monitored within the Apostle Islands National Lakeshore, Wisconsin (USA, 2014-2017).
Island Island size
(km2) Distance to mainland (km)
Distance to nearest island
(km)
Maximum
elevation (m) Mean elevation (m)
Eagle 0.08 3.54 5.13 8 5.4
North Twin 0.65 20.76 2.73 13 8.4
York 1.10 1.48 3.47 12 6.3
Raspberry 1.16 2.69 2.91 30 15.4
Devils 1.25 14.33 3.36 21 10.6
South Twin 1.36 15.06 1.05 15 8.3
Ironwood 2.69 14.44 1.66 27 15.3
Hermit 3.17 3.67 2.20 56 21.7
Rocky 4.24 12.41 1.05 31 14.4
Otter 5.35 8.43 1.29 44 24.4
Manitou 5.36 8.43 1.66 43 19.7
Cat 5.41 18.03 2.74 25 13.3
Michigan 6.18 17.86 4.09 29 15.0
Bear 7.34 7.23 2.84 72 26.9
Basswood 7.74 1.87 2.20 58 32.3
Sand 11.58 2.04 3.47 19 9.6
Oak 20.32 2.12 2.22 147 66.8
Outer 21.78 23.83 4.28 83 31.7
Stockton 40.00 7.84 2.15 61 25.7
climate change (Licht et al. 2015). We considered all terrestri- al carnivore species found in Wisconsin to potentially be pre- sent in the study area, including American badger (Taxidea taxus), American marten, black bear, bobcat (Lynx rufus), coyote, fisher (Pekania pennant), gray fox (Urocyon cinereo- argenteus), gray wolf (Canis lupus), raccoon (Procyon lo- tor), red fox, striped skunk (Mephitis mephitis), and weasels [long-tailed weasel (Mustela frenata) and short-tailed weasel (Mustela erminea) lumped due to difficulty of identifying from photographs].
Field methods and design
Careful and deliberate camera trap placement is critical for accurately and efficiently documenting carnivores and estimating their distributions and abundance (Chandler and Royle 2013, Burton et al. 2015, Allen et al. 2016b, Rich et al.
2017). Therefore, we systematically deployed camera traps by placing camera traps near the center points of 1 km2 grids.
This creates relatively equal camera trap densities between islands with the exception of islands smaller than a square kilometer including Eagle Island. After locating the center point of a grid cell, we walked in concentric circles from the grid point until a suitable location was found. We explicitly targeted fine-scale features, including camera trap height, ori- entation, distance to wildlife sign, and course woody debris to maximize carnivore detection when placing camera traps.
We recorded the coordinates of each camera trap site with a handheld GPS unit, but we did not place flagging or physi- cally mark any of the sites.
Following this protocol, we placed 164 camera traps (HC600 Hyperfire™ High Output Covert, PC 800 Hyperfire
Professional Semi-covert, and HC500 Hyperfire Semi- covert cams; RECONYX, Inc., Holmen, WI, USA) on 19 of the islands (Table 2); however, 4 of the camera traps malfunctioned, so we excluded them from our analyses. All of the camera traps had an infrared flash, trigger speed of 1/5 sec, and a 1080p high definition image resolution. We programmed camera traps to take a series of photographs when triggered by an animal and to record the time, date, temperature, and moon phase for each photograph. We also programmed the camera traps to take a time-lapse picture at 11 am every day. These pictures allowed us to ensure that the camera traps were functional on a daily scale. We ini- tially programmed the camera traps on Stockton Island to take 5 photographs and a 15 sec delay between events. We then changed our programming to take 3 photographs, with no refractory period between each event as we expanded our camera trap grid to other islands. The difference in program- ming did not preclude comparison between islands because we did not use the raw number of photos in our analysis.
Instead, we used detection versus no detection over a twen- ty-four hour period. We conducted camera trapping year- round to encompass seasonal changes in carnivore activity and visual obstructions caused by changes in vegetation or snow cover. We returned to each camera trap approximately six months after initial deployment to replace the lithium ion batteries and memory cards. Battery life was not an is- sue due to low levels of human recreation and low wildlife detection rates.
On each island, we randomly assigned a lure treatment to half of the camera trap sites. We used a commercial preda- tor trapping scent lure (Caven’s Gusto, Minnesota Trapline Products Inc.) and placed aerial call lures (at ~3-4 m high) and local lures (on downed woody vegetation) to draw car- Table 2. Characteristics of sampling effort for camera traps deployed on each island within the Apostle Islands National Lakeshore, Wisconsin (USA, 2014-2017).
Island Functioning
camera traps Total trapnights Mean nights per
camera trap Camera trap density (cams/km)
Basswood 8 1736 217.0 1.03
Bear 8 4104 513.0 1.09
Cat 5 2433 486.6 0.92
Devils 2 712 356.0 1.59
Eagle 1 536 536.0 12.50
Hermit 3 1618 539.3 0.95
Ironwood 4 635 158.8 1.49
Manitou 4 1859 464.8 0.75
Michigan 6 1229 204.8 0.97
North Twin 2 861 430.5 3.08
Oak 16 6549 409.3 0.79
Otter 7 3277 468.1 1.31
Outer 26 6935 266.7 1.19
Raspberry 2 743 371.5 1.72
Rocky 6 3196 532.7 1.41
Sand 12 2333 194.4 1.04
South Twin 2 952 476.0 1.47
Stockton 30 7330 244.3 0.75
York 2 422 211.0 1.82
nivores into the camera trap’s core detection area. Caven’s Gusto is used to attract a wide variety of carnivores and scav- engers (e.g., fishers; Popescu et al. 2014, badgers; Harrison 2015, and red fox; Black et al. 2018). After approximately 6-months of deployment, we rotated sites so that all previ- ously non-lured sites received lure during the second 6-month deployment.
Statistical analyses
We used program R version 3.4.4 (R Core Team 2018) for all statistical analyses. We used occupancy models (MacKenzie et al. 2006) to estimate the occurrence of each carnivore species we observed across islands. Succinctly, oc- cupancy models assume that an animal’s presence at a spe- cific site i (zi), follows a Bernoulli distribution (ψ) and that observed presence or absence at specific sites over j repeated intervals (yi,j) follows a Bernoulli distribution (zi × p), where p is the probability of detecting a present species. Both oc- cupancy probability (ψ) and detection probability may vary as a function of site-specific or site and interval-specific co- variates—e.g.: logit(ψi) = β0 + β1X1,I. If no temporal variation in p is considered within a model, yi,j can be reformulated as a Binomial count—e.g., yi ~ Binomial (zi × p, k)—for in- creased computational efficiency (MacKenzie et al. 2006).
We used this Binomial formulation, summing the number of 24 h periods sampled by all cameras on each island and cal- culating the number of 24 h periods in which each of our fo- cal species were detected. In other words, we pooled specific camera encounter histories within islands and estimated the occupancy state of each species upon each island, or the de- gree to which a given species collective space-use overlapped with specific camera locations (Efford and Dawson 2012).
Given the survey intensity associated with most islands, we believe there is little practical difference between the two for most species of interest. As we were specifically interested in relating species’ occurrence to metrics associated with is- land biogeography, we modeled the occurrence of species s on island i as logit(ψi,s) = β0,s + β1,sSizei + β2,sInter-Islandi + β3,sMainlandi, where Size indicates the area/size of the given island, Inter-Island indicates the nearest inter-island distance, and Mainland indicates the distance from the given island to mainland Wisconsin.
We were further interested in identifying seasonal pe- riods during which subsequent monitoring efforts might be most effective. We assigned all survey effort into two de- tection periods: summer (May through October) and winter (November through April). We then modeled species-spe- cific detection probabilities on separate islands (pi,s) as logit (pi,s) = α0,s + α 1,sWinter + εp,i; the last term represents un- modeled sources of variation as error normally distributed on the logit-scale across species and island combinations such that εp,i~N(0, σp).
Given the small number of islands, we expected the full model to be over-parameterized, and we used indicator vari- able selection (Kuo and Mallick 1998) to select suitable and parsimonious models for each species. Indicator variable se- lection associates each coefficient with a binary random vari-
able (wβ) that iteratively dictates whether a term is included within a model: when w = 0, the term is not included within the model, and when w = 1, the term is included in the model (i.e., logit (ψi,s) = β0,s + wi,1 * β1,sIslandSizeiw1,s). The poste- rior mean of any wβ is equivalent to the probability that the model term should be included within the predictive model, with values > 0.5 generally considered to be useful terms.
A full Bayesian analysis requires placing a prior on wβ, and rather than selecting a scalar prior value (which implicitly suggests a prior for how many terms should be included), we specified a random variable inclusion prior for each species as Uniform(0, 1) so that more or less variables would be includ- ed with the analysis for a given species depending upon how well they explained the observations for that species (O’Hara et al. 2009). As a posterior sample associated with specific effect is simply drawing from the prior and has no explicit effect when wβ = 0, we fixed these samples as equal to zero when calculating uncertainty intervals.
We fit models using Markov chain Monte Carlo (MCMC) simulation using JAGS (Plummer 2003) through the jagsUI (Kellner et al. 2015) library for R and used appropriately balanced priors for beta coefficients with scaled predictors within logistic models (Gelman et al. 2008) and uniform (0, 1) priors for probability parameters. We considered models to have converged if trace plots exhibited adequate mixing and if point estimates of the Gelman-Rubin convergence statistic were less than 1.1 (Gelman and Rubin 1992).
We used posterior samples from the fitted model to derive several additional metrics of interest. First, we report finite- sample occupancy estimates for each carnivore on each island (i.e., the posterior mean of zspecies,island). We further derived finite-sample estimates of the proportion of islands in which each species was present (PAO) and island-specif- ic estimates of carnivore richness based upon the mode of the posterior distribution, and report associated uncertainty intervals. Because estimated detection probability per trap- night was small for each species, we report derived detec- tion probabilities for each season per 100 trap-nights (a more realistic unit of monitoring effort).
Results
Summary statistics
We collected data using 160 camera traps on 19 islands within the archipelago. We had a mean 7.68 (±1.87 SE) func- tioning camera traps per island (range 1-30) (Table 2). Our camera trap density on islands averaged 1.89 (±0.60 SE, range 0.75-12.50) functioning camera traps/km2 (Table 2).
We collected 203,385 photographs (including time-lapse photographs) across 49,280 trap nights, and documented 7,291 wildlife events, including 1,970 carnivore events. We detected 21 unique species and 6 other groups of species (raptors, small rodents, songbirds, squirrels, waterfowl, weasels), including 10 terrestrial carnivores and two semi-aquatic carnivores (mink, Neovison vison, and river otter, Lontra canadensis).
ˆ
︠ ︡
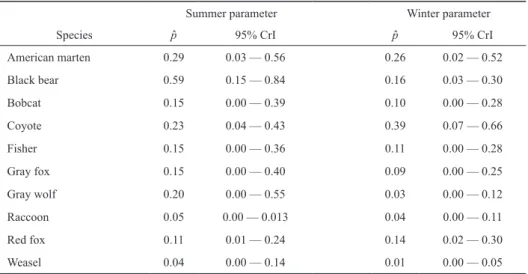
Table 3. Estimates of detection parameters for carnivores on 19 islands in APIS (Table 3) by season (summer and winter). We report detection probability (p) over a 100 trap-night effort with 95% credible intervals (CrI).
Carnivore occupancy and detection rates
Our summer detection probability estimates (p) for 100 trap nights of effort at an island ranged from 0.04 (95% CrI 0.00—0.13) for weasels and 0.05 (95% CrI 0.00—0.13) for raccoons to 0.59 (95% CrI 0.15—0.84) for black bear (Table 3). Our winter p ranged from 0.01 (95% CrI 0.00—0.05) for weasels to 0.392 (95% CrI 0.07—0.66) for coyote (Table 3).
The uncertainty associated with these estimates directly re- flects island-specific variability in detection rates. For most species, detection probability was lower during winter and winter had a negative effect, with the exception of red foxes and coyotes (Table 3). The only specific effects estimated with high confidence, however, were that black bears were more likely to be detected in summer and coyotes were more likely to be detected during winter (Table 3).
Of the three explanatory variables for carnivore occu- pancy considered, island size appeared to be the most im- portant (across species, average wβ = 0.65, Table 4) followed by distance to the mainland, and then inter-island distance.
However, the importance of these variables varied widely across species: it appeared that the optimal predictive model for coyotes included all three terms, while black bear occur- rence was primarily impacted by island size and inter-island
distance, and none of the predictive terms appeared to greatly affect weasel occurrence. Similarly, estimated effects also varied inter-specifically: although individual species ap- peared either more likely or neutrally likely to occur on larger islands, there was some indication that smaller carnivores (weasels, American marten) were more likely to occur on is- lands farther from the mainland, while other species exhibited little response (Table 4.)
Finite-sample occupancy estimates for carnivores varied across islands (Table 5). Mean estimated occupancy across islands varied from a high of 0.73 (± 0.09 SE) for black bears to a low of 0.21 (± 0.04 SE) for gray wolves. Our estimated richness for terrestrial carnivore species varied across spe- cies from 1 (CI =1—13) island for gray wolves to 13 (CI = 12—17) islands for black bears. Estimated carnivore richness across islands also varied substantively from 1 (CI = 0—4) species on Michigan Island to 10 (all observed) species on Stockton Island (Figure 1).
Discussion
Carnivores have wide-ranging effects on ecological communities (Cederholm et al. 2011, Estes and Palmisano 1974, McLaren and Peterson 1994, Estes 1996, Allen et al.
Summer parameter Winter parameter
Species p 95% CrI p 95% CrI
American marten 0.29 0.03 — 0.56 0.26 0.02 — 0.52
Black bear 0.59 0.15 — 0.84 0.16 0.03 — 0.30
Bobcat 0.15 0.00 — 0.39 0.10 0.00 — 0.28
Coyote 0.23 0.04 — 0.43 0.39 0.07 — 0.66
Fisher 0.15 0.00 — 0.36 0.11 0.00 — 0.28
Gray fox 0.15 0.00 — 0.40 0.09 0.00 — 0.25
Gray wolf 0.20 0.00 — 0.55 0.03 0.00 — 0.12
Raccoon 0.05 0.00 — 0.013 0.04 0.00 — 0.11
Red fox 0.11 0.01 — 0.24 0.14 0.02 — 0.30
Weasel 0.04 0.00 — 0.14 0.01 0.00 — 0.05
Table 4. Standardized coefficients for the island biogeography variables that we considered as possible explanations of carnivore oc- cupancy in the Apostle Islands, where larger coefficients indicate a stronger effect. We include the marginal mean for each variable and the mean of the coefficients for each species.
Variable American marten Black
bear Bobcat Coyote Fisher Gray
fox Gray
wolf Raccoon Red
fox Weasel Marginal mean
Island size 0.61 0.74 0.78 0.86 0.68 0.77 0.62 0.57 0.45 0.46 0.66
Mainland
distance 0.66 0.47 0.70 0.84 0.57 0.69 0.49 0.49 0.61 0.47 0.59
Neighbor
distance 0.57 0.55 0.62 0.67 0.56 0.61 0.53 0.51 0.51 0.48 0.56
Mean 0.61 0.59 0.70 0.79 0.60 0.69 0.55 0.52 0.53 0.47
ˆ
ˆ
ˆ
ˆ
ˆ
2014), but can be difficult to rigorously monitor due to their low population densities and cryptic behaviors (Harmsen et al. 2010, Krofel et al. 2012, Allen et al. 2016a). Because of this, there was little known about the carnivore guild in the Apostle Islands, but knowledge of the carnivore guild is im- portant in preserved areas as carnivores are among the most charismatic wildlife species (Kellert 1997, Ray et al. 2013), and many visitors are interested in viewing them (Okello et al. 2008). We used a systematic grid of camera traps to moni- tor cryptic carnivore species in the Apostle Islands archipel- ago, which includes the Apostle Islands National Lakeshore, to investigate multiple aspects of their ecology and acquire
background knowledge to inform management decisions.
Although we could not identify weasel detections to species, the 10 terrestrial carnivores we were able to identify to spe- cies represent all but two of the native terrestrial carnivores present in Wisconsin (exceptions: American Badgers and striped skunks). Our study fills knowledge gaps in the pres- ence and distribution of carnivores in the archipelago and provides a foundation for understanding the carnivore com- munity dynamics.
The distribution and number of islands occupied by car- nivores varied, but over half of the carnivores had a mean estimated occupancy value greater than 0.40. Some species, Table 5. Finite-sample occupancy estimates across surveyed islands within APIS by carnivore species 2014-2017. Islands where a carnivore species was actually observed have perfect occupancy (1.00, noted by boldface), and the derived finite-sample estimates of the proportion of islands in which each species was present (PAO).
American
marten Black
bear Bobcat Coyote Fisher Gray
fox Gray
wolf Raccoon Red fox Weasel
Basswood 0.13 1.00 1.00 1.00 1.00 1.00 0.19 0.48 0.52 0.35
Bear 1.00 1.00 0.11 1.00 0.11 0.12 0.12 0.34 1.00 0.32
Cat 1.00 1.00 0.08 0.06 0.10 0.09 0.14 1.00 0.17 0.38
Devils 0.20 0.20 0.10 0.15 0.10 0.10 0.15 0.35 0.19 1.00
Eagle 0.09 0.15 0.18 0.44 0.09 0.18 0.20 0.35 0.15 0.46
Hermit 0.12 1.00 0.19 1.00 0.22 0.19 0.14 0.43 1.00 0.32
Ironwood 0.40 1.00 0.16 0.10 0.28 0.17 0.18 0.46 0.51 0.37
Manitou 1.00 1.00 0.17 1.00 0.26 0.18 0.16 0.45 1.00 0.32
Michigan 0.19 0.18 0.10 0.14 0.07 0.10 0.18 0.33 0.10 0.47
North Twin 0.34 0.24 0.09 0.07 0.12 0.09 0.15 0.36 0.22 0.40
Oak 0.10 1.00 1.00 1.00 1.00 1.00 0.17 1.00 1.00 0.31
Otter 1.00 1.00 0.16 0.09 0.27 0.17 0.15 1.00 1.00 0.30
Outer 1.00 1.00 0.11 1.00 0.07 0.11 0.20 0.32 0.04 0.46
Raspberry 0.12 0.25 0.19 1.00 0.18 0.20 0.16 0.42 1.00 0.36
Rocky 1.00 1.00 0.14 0.06 1.00 0.15 0.15 0.41 0.50 0.30
Sand 0.08 1.00 0.24 1.00 0.16 0.25 0.20 1.00 0.26 0.41
South Twin 0.43 0.47 0.16 0.08 0.32 0.17 0.18 0.46 1.00 0.34
Stockton 1.00 1.00 1.00 1.00 1.00 1.00 1.00 1.00 1.00 1.00
York 0.12 0.31 0.23 0.45 0.18 0.23 0.19 0.42 0.37 0.40
PAO 0.49 0.73 0.28 0.56 0.34 0.29 0.21 0.56 0.58 0.43
Figure 1. Map depict- ing the estimated carni- vore species richness for each island within the Apostle Islands National Lakeshore.
︠ ︡
︠ ︡
such as black bears, had high archipelago-wide estimated occupancy, with observations on most of the islands. Other species, such as gray wolves, had low estimated occupancy with observed detections on only one island. This disparity could be due to life history traits of the individual species, which may allow the black bears to persist more readily on the islands than gray wolves. Gray wolves are highly social and have a specialized diet typically consisting of ungulates (Newsome et al 2016), while black bears are generally soli- tary in addition to having a generalist diet (Larivière 2001).
Low immigration rates for a species could result in individu- als moving between islands, leading to a low abundance with conflated estimated occupancy rates, which we believe is the case with raccoons. Alternatively, low detection rates com- bined with a variable environment such as thick forest could have resulted in high estimated occupancy values without ac- tual observations.
Island biogeography (e.g., MacArthur and Wilson 1967, Wilson 2009) appears to be an important explanation for carnivore occupancy and distribution in the Apostle Islands.
Island size was the most important variable in occupancy es- timates for each species, and occupancy also generally de- creased with an island’s distance from the mainland, with the exception of smaller carnivores. Size of an island likely dic- tates the diversity and abundance of resources, such as prey and habitat that are available for carnivores. A larger diversity of habitat also allows carnivores that compete for the same resources to establish foraging or behavioral niches to par- tition resources (Lesmeister et al. 2015, Wang et al. 2015).
Populations of a given carnivore species on an island may be dependent on periodic influxes of individuals, particularly from the mainland to maintain their population, as the end of the archipelago acts as a geographical limit to the dispersal of young animals, or islands far from the mainland may act as population sinks. As such, none of the islands in the archi- pelago are likely large enough to sustain populations of mam- malian carnivores in the face of demographic stochasticity or the genetic effects of small population size.
A key objective for developing our protocol was to ob- tain estimates of detection probabilities for each terrestrial carnivore species to understand how long cameras need to be deployed to ensure detection and to determine the season of greatest detection probability. For most species, with the exception of red foxes and coyotes, our detection rates were higher in summer than in winter. Our low detection rates in winter may be caused by low temperatures which diminish battery performance. A key component of the methodology we developed during the project was to program cameras to take time-lapse photos each day, to determine if a camera was functioning or not on a daily scale. One change that could be made is to program the time-lapse photos to be taken during the coldest part of the night (for example 2:00-3:00 am) to ensure camera functionality at the times that their batteries are most likely to be affected by cold temperatures.
Based on our results, we suspect the dynamics of the mammalian carnivore community of the archipelago is rep- resentative of a metapopulation – and therefore critically de- pendent upon movement of individuals between the islands
and the mainland and between the islands. In the Apostle Islands, the movement of mammals between the islands and into the archipelago occurs through either swimming or travel across ice bridges in winter. Reports exist of some mammal species swimming long distances between islands and the mainland (Jackson 1920, Pauli 2005, Wilton et al. 2015), or species could immigrate and emigrate from the archipelago during winter, when ice forms connective bridges between the islands and the mainland. Over the last 150 years, limnol- ogists have documented declines in the duration of lake ice in the northern hemisphere (Magnuson et al. 2000), suggesting that if travel across the ice is the primary mode of recolo- nization, rates of recolonization may be affected by climate change. This may in turn change the dynamics of the car- nivore community in the Apostle Islands archipelago, as the existence of some species on the islands may be dependent on ice bridges to maintain stable metapopulation dynamics (e.g., wolves, coyotes and red foxes) while others may be more reli- ant on swimming between islands to maintain such dynamics (e.g., black bears). Future work should attempt to assess the effects of changes in connectivity associated with intermit- tent or persistent ice bridge formation between islands and the mainland during the winter months. Greater understanding of Apostle Islands ecology will require on-going monitoring of carnivores to evaluate temporal dynamics as well as related ecological evaluations (e.g., small mammal dynamics, plant community dynamics) to understand trophic effects.
Acknowledgements: This project was supported by the Apostle Islands National Lakeshore (GLNF CESU Agreement P14AC01180), Northland College (Department of Natural Resources; Sigurd Olson Professorship in the Natural Sciences; Morris O. Ristvedt Professorship in the Natural Sciences), NASA Earth and Space Science Fellowship (Grant number NNX16AO61H), and the University of Wisconsin (Schorger fund, Department of Forest and Wildlife Ecology;
Beers-Bascom Professorship in Conservation). We thank the personnel from each group that contributed to this project, especially APIS staff and volunteers, graduate students from the Van Deelen lab at the University of Wisconsin – Madison, and students from Northland College. The support and co- operative spirit between these three groups was key to the success of this project. The authors declare that they have no conflict of interest.
References
Adams, J.R., L.M. Vucetich, P.W. Hedrick, R.O. Peterson, and J.A.
Vucetich. 2011. Genomic sweep and potential genetic rescue during limiting environmental conditions in an isolated wolf population. Proc. Biol. Sci. 278:3336–3344.
Allen, M.L., L.M. Elbroch, C.C. Wilmers and H.U. Wittmer. 2014.
Trophic facilitation or limitation? Comparative effects of pu- mas and black bears on the scavenger community. PLoS One 9:e102257.
Allen, M.L., L.M. Elbroch, C.C. Wilmers, and H.U. Wittmer. 2015.
The comparative effects of large carnivores on the acquisition of carrion by scavengers. Am. Nat. 185:822–833.
Allen, M.L., C.C. Wilmers, L.M. Elbroch et al. 2016a. The impor-The impor- tance of motivation, weapons, and foul odors in driving encoun- ter competition in carnivores. Ecology 97:1905–1912.
Allen, M.L., H.U. Wittmer, E. Setiawan et al. 2016b. Scent marking in Sunda clouded leopards (Neofelis diardi): Novel observations close a key gap in understanding felid communication behav- iours. Sci. Rep. 6:35433.
Allen, M.L., B. Wojcik, B.E. Evans et al. 2018. Detection of endan- gered American martens (Martes americana) in Apostle Islands National Lakeshore, Wisconsin. Am. Mid. Nat. 179:294–298.
Altendorf, K.B., J.W. Laundre, C.A. Lopez and J.S. Brown. 2001.
Effects of predation on foraging of mule deer. J. Mammal.
82:430–439.
Anderson, M.K. and M.G. Barbour. 2003. Simulated indigenous management: a new model for ecological restoration in national parks. Ecol. Restor. 21:269–277.
Atwood, T.C., E.M. Gese and K.E. Kunkel. 2007. Comparative patterns of predation by cougars and recolonizing wolves in Montana’s Madison Range. J. Wildl. Manage. 71:1098–1106.
Belant, J.L., J.F. Van Stappen and D. Paetkau. 2005. American black bear population size and genetic diversity at Apostle Islands National Lakeshore. Ursus 16:85–92.
Black, K.M., S. Preckler-Quisquater, T.J. Batter, S. Anderson, and B.N. Sacks. 2018. Occupancy, habitat, and abundance of the Sacramento Valley red fox. J. Wildl. Manage. DOI: 10.1002/
jwmg.21556.
Brown, J.S., J.W. Laundre and M. Gurung. 1999. The ecology of fear: optimal foraging, game theory, and trophic interactions. J.
Mammal. 80:385–399.
Burton, A.C., E. Neilson, D. Moreira et al. 2015. Wildlife camera trapping: A review and recommendations for linking surveys to ecological processes. J. Appl. Ecol. 52:675–685.
Busch, J.C. 2008. People and places: a human history of the Apostle Islands. Historic resource study of the Apostle Islands National Lakeshore. Midwest Regional Office, National Park Service, Omaha, Nebraska.
Cederholm, C.J., M.D. Kunze, T. Murota and A. Sibatani. 2011.
Pacific salmon carcasses: Essential contributions of nutrients and energy for aquatic and terrestrial ecosystems. Fisheries 24:6–15.
Chandler, R.B. and J.A. Royle. 2013. Spatially explicit models for inference about density in unmarked or partially marked popula- tions. Ann. Appl. Stat. 7:936–954.
Craven, S.R. and E. Lev. 1987. Double-crested cormorants in the Apostle Islands, Wisconsin, USA: population trends, food hab- its, and fishery depredations. Col. Waterbird. 64–71.
Courchamp, F., M. Langlais and G. Sugihara. 1999. Cats protecting birds: modelling the mesopredator release effect. J. Anim. Ecol.
68:282–292.
Efford, M.G. and D.K. Dawson. 2012. Occupancy in continuous habitat. Ecosphere 3:1–15.
Estes, J.A. and J.F. Palmisano. 1974. Sea otters: their role in structur- ing nearshore communities. Science 185:1058–1060.
Estes, J.A. 1996. Predators and ecosystem management. Wildl. Soc.
Bull. 24:390–396.
Gelman, A., A. Jakulin, M.G. Pittau and Y-S. Su. 2008. A weakly informative default prior distribution for logistic and other re- gression models. Ann. Appl. Stat. 2: 1360–1383.
Gelman, A. and D.B. Rubin. 1992. Inference from iterative simula-1992. Inference from iterative simula- tion using multiple sequences. Stat. Sci. 7:457–472.
Harmsen, B.J., R.J. Foster, S.M. Gutierrez et al. 2010. Scrape- marking behavior of jaguars (Panthera onca) and pumas (Puma concolor). J. Mammal. 91:1225–1234.
Harrison, R.L. 2015. A comparison of sign searches, live-trapping, and camera-trapping for detection of American badgers (Taxidea taxus) in the Chihuahuan desert. West. N. Am. Nat.75:387–395.
Howk, F. 2009. Changes in Lake Superior ice cover at Bayfield, Wisconsin. J. Great Lakes Res. 35:159–162.
Hunter, M.D. and P.W. Price. 1992. Playing chutes and ladders: heter- ogeneity and the relative roles of bottom-up and top-down forces in natural communities. Ecology 73:724–732.
Jackson, H.T. 1920. An apparent effect of winter inactivity upon dis- tribution of mammals. J. Mammal. 1:58–64.
Judziewicz, E.J. and R.G. Koch. 1993. Flora and vegetation of the Apostle Islands National Lakeshore and Madeline Island, Ashland and Bayfield Counties, Wisconsin. Mich. Bot. 32:43–
189.
Kellert, S.R. 1997. The Value of Life: Biological Diversity and Human Society. Island Press, Covelo.
Kellner, K. 2015. jagsUI: a wrapper around rjags to streamline JAGS analyses. R package version 1.
Krofel, M., I. Kos and K. Jerina. 2012. The noble cats and the big bad scavengers: effects of dominant scavengers on solitary predators.
Behav. Ecol. Sociobiol. 66:1297–1304.
Kuo, L. and B. Mallick. 1998. Variable selection for regression mod- els. Indian J. Stat. Series. B:65–81.
Laliberte, A.S. and W.J. Ripple. 2004. Range contractions of North American carnivores and ungulates. Bioscience 54:123–138.
Larivière, S. 2001. Ursus americanus. Mamm. Spec. 647:1-11.
Lesmeister, D.B., C.K. Nielsen, E.M. Schauber and E.C. Hellgren.
2015. Spatial and temporal structure of a mesocarnivore guild in midwestern north America. Wildl. Monogr. 191:1–61.
Licht, D.S., R.A. Moen, D.P. Brown, M.C. Romanski, and R.A.
Gitzen. 2015. The Canada Lynx (Lynx canadensis) of Isle Royale: Over-harvest, climate change, and the extirpation of an island population. Can. Field. Nat. 129:139–151.
List of Mammals. 2018. American Society of Mammalogists. https://
www.mammalogy.org/mammals-list.
Lomolino, M.V. 1988. Winter immigration abilities and insular com- munity structure of mammals in temperate archipelagos. In:
J.F. Downhower (ed.), The Biogeography of the Island Region of Western Lake Erie. Ohio State Univ. Press, Columbus. pp.
185–196.
MacArthur, R.H. and E.O. Wilson. 1967. The Theory of Island Biogeography. Princeton Univ. Press, Princeton.
MacKenzie, D.I., J.D. Nichols, J.A. Royle et al. 2006. Occupancy Estimation and Modeling. Elsevier Academic Press, Burlington.
Magnuson, J.J., D.M. Robertson, B.J. Benson et al. 2000.
Historical trends in lake and river ice cover in the Northern Hemisphere. Science 289:1743–1746.
McLaren, B.E. and R.O. Peterson. 1994. Wolves, moose and tree rings on Isle Royale. Science 266:1555–1558.
National Centers for Environmental Information (NCEI). Climate Data Online: Dataset Discovery. Retrieved June 23, 2017, from https://www.ncdc.noaa.gov/cdo-web/datasets
Newsome, T.M., L. Boitani, G. Chapron et al. 2016. Food habits of the world’s grey wolves. Mammal Review 46:255-269.
O'Hara, R.B. and M.J. Sillanpää. 2009. A review of Bayesian vari- able selection methods: what, how and which. Bayesian Analysis 4:85-117.
Okello, M. M., S. G. Manka and D. E. D’Amour. 2008. The relative importance of large mammal species for tourism in Amboseli National Park, Kenya. Tour. Manage. 29: 751–760.
Pauli, J.N. 2005. Evidence for long-distance swimming capabili- ties in red squirrels, Tamiasciurus hudsonicus. Northeast. Nat.
12:245–248.
Plummer, M. 2003. JAGS: A program for analysis of Bayesian graph- ical models using Gibbs sampling. Page 125 in Proceedings of the 3rd international workshop on distributed statistical comput- ing 124.
Popescu, V.D., P. de Valpine, and R.A. Sweitzer. 2014. Testing the consistency of wildlife data types before combining them: the case of camera traps and telemetry. Ecol. Evol. 4:933–943.
Prugh, L.R., C.J. Stoner, C.W. Epps et al. 2009. The rise of the meso- predator. Bioscience 59:779–791.
R Core Team. 2018 R: a language and environment for statistical computing. R Foundation for Statistical Computing, Vienna.
Ray J., K.H. Redford, R. Steneck, J. Berger (eds). 2013. Large Carnivores and the Conservation of Biodiversity. Island Press, Washington D.C.
Rich, L.N., D.A.W. Miller, H.S. Robinson et al. 2017. Carnivore dis- tributions in Botswana are shaped by resource availability and intraguild species. J. Zool. 303:90-98.
Ripple, W.J. and R.L. Beschta. 2004. Wolves and the ecology of fear:
can predation risk structure ecosystems? Bioscience 54:755–766.
Ripple, W.J., J.A. Estes, R.L. Beschta et al. 2014. Status and eco-Status and eco- logical effects of the world’s largest carnivores. Science 343:1241484.
Sivy, K.J., C.B. Pozzanghera, J.B. Grace and L.R. Prugh. 2017. Fatal attraction? Intraguild facilitation and suppression among preda- tors. Am. Nat. 190:663–679.
Wang, Y., M.L. Allen and C.C. Wilmers. 2015. Mesopredator spatial and temporal responses to large predators and human develop- ment in the Santa Cruz Mountains of California. Biol. Conserv.
190:23–33.
Wilson, E.O. 2009. Island Biogeography in the 1960s. In: J.B. Losos and R.E. Ricklefs (eds.), The Theory of Island Biogeography Revisited. Princeton Univ. Press, Princeton. pp. 1–10.
Wilton, C.M., J.L. Belant, J.F. Van Stappen and D. Paetkau. 2015.
American black bear population abundance and genetic structure on an island archipelago. Ursus 26:53–66.
Wolf, C. and W.J. Ripple. 2017. Range contractions of the world’s largest carnivores. R. Soc. Open. Sci. 4:170052. http://dx.doi.
org/10.1098/rsos.170052.
Received September 9, 2018 Revised October 25, 2018 Accepted November 27, 2018